Alert Response
Alert Response provides contextual insights about triggered alerts to minimize the time needed to investigate and resolve application failures.
On-call engineers are tasked with firefighting production issues and recovering quickly. They have to investigate issues and try to identify the root cause and fix it, which requires deep knowledge about the production systems, troubleshooting tools, and tons of experience as on-calls.
By assembling relevant context from prior alerts and by analyzing patterns in logs and metrics underlying alerts, Alert Response enables on-call engineers to cut down the time spent piecing together insights during an incident from various sources and accelerate recovery.
Setting up Alert Response
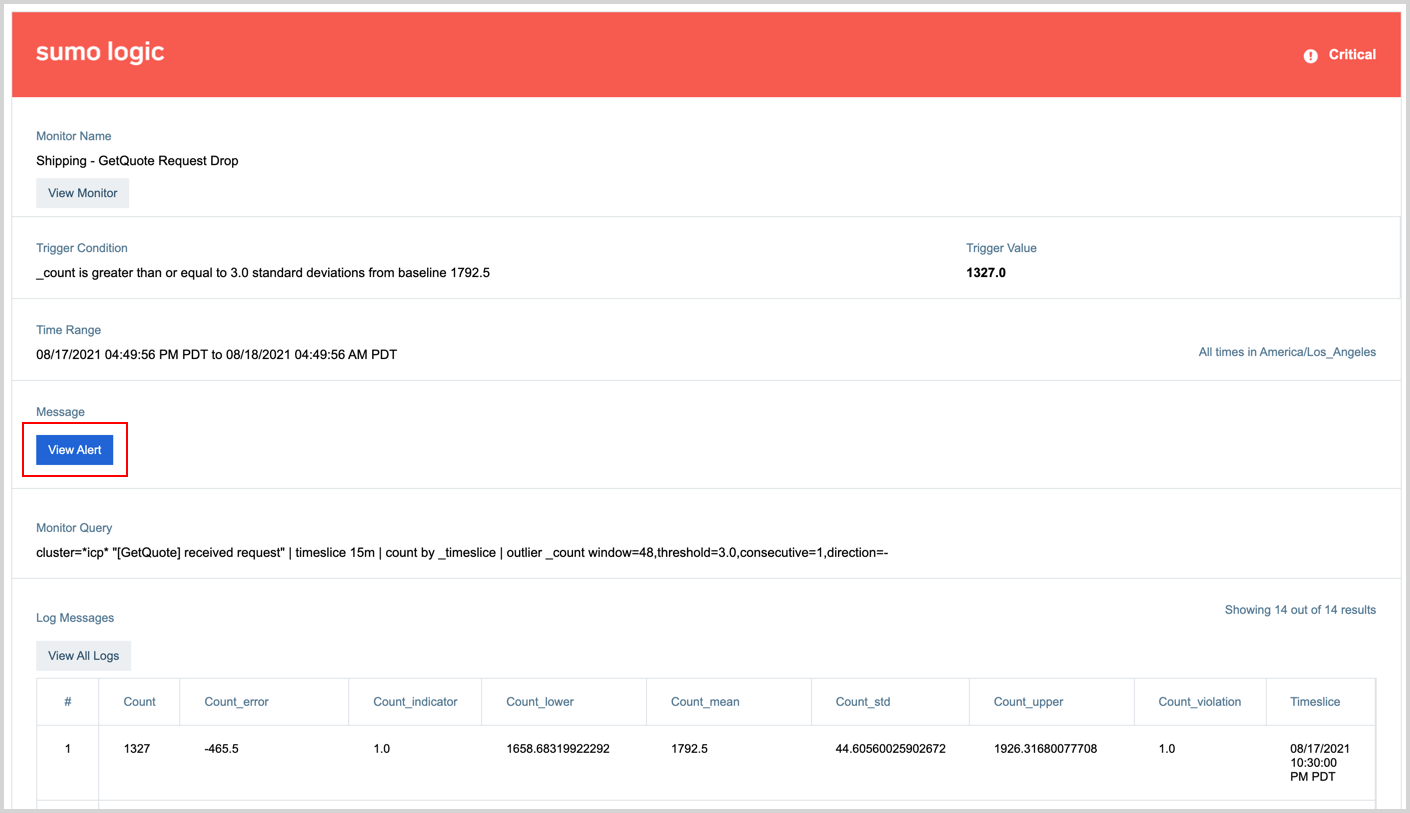
Email alerts automatically get a button labeled View Alert that opens the alert on the Alert page, shown in the below image.
If you use Webhook connections offered by Sumo Logic for receiving notifications you need to provide the alertResponseUrl variable in your notification payload of a Monitor to receive a link that opens Alert Response. When your Monitor is triggered it will generate a URL and provide it in the notification payload where you can use it to open Alert Response. The following is an example Slack payload with the variable:
{
    "attachments":[
        {
            "pretext":"Sumo Logic Alert",
            "fields":[
                {
                    "title":"Alert Page",
                    "value":"{{alertResponseUrl}}"
                }
            ],
            "mrkdwn_in":[
                "text",
                "pretext"
            ],
            "color":"#29A1E6"
        }
    ]
}
Alert list
Alert list shows all the Alerts from triggered Monitors within the past seven days. By default, the list is sorted by status (showing Active on top, followed by Resolved), and then chronologically by creation time.
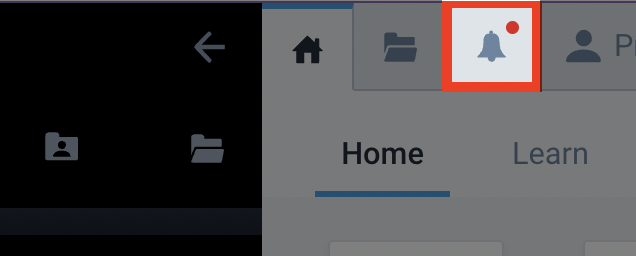
To open the Alert list, click the bell icon in the top menu.
To filter or sort by category (e.g., Name, Severity, Status), you can use the search bar or click on a column header.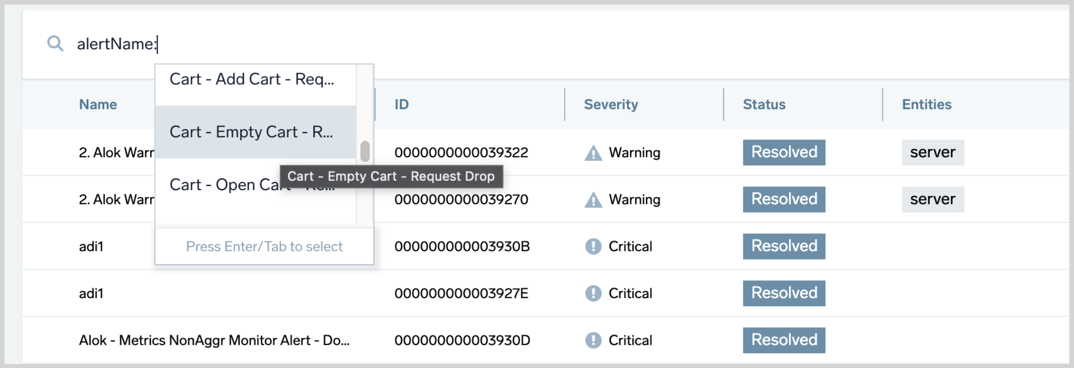
Resolve Alerts
To resolve an alert, click a row to select it and click Resolve.
Alert Page
The Alert Page is where you can view granular details about an individual alert. To get to an Alert page, click on any row from your Alert list.
An Alert provides curated information to on-calls in order for them to troubleshoot issues more quickly. It provides two different types of information to help get to the root cause of the issue quickly.
- Alert Details: Overview of the alert that was triggered to help you understand the issue and its potential impact.
- Alert Context: System curated context helps you understand potential underlying symptoms within the system that might be causing the issue.
Alert Details
The details section provides:
- a chart to visualize the alerting KPI before and during the alert.
- a table with the raw data that triggered the alert.
- related alerts firing in the system around the same time.
- the history of the given alert being fired in the past.
- basic details about the alert like when it was fired and what triggered it.
The following images label each section of the page with a letter, see the list below the image for a description of what each does.

The top of the page provides several details and buttons.
- A - the title of the Monitor.
- B - copy the link to the opened Alert page.
- C - the type of Monitor trigger condition that triggered the alert, either Critical, Warning, or MissingData.
- D - the status of the Alert, either Active or Resolved.
- E - refreshes the Alert page.
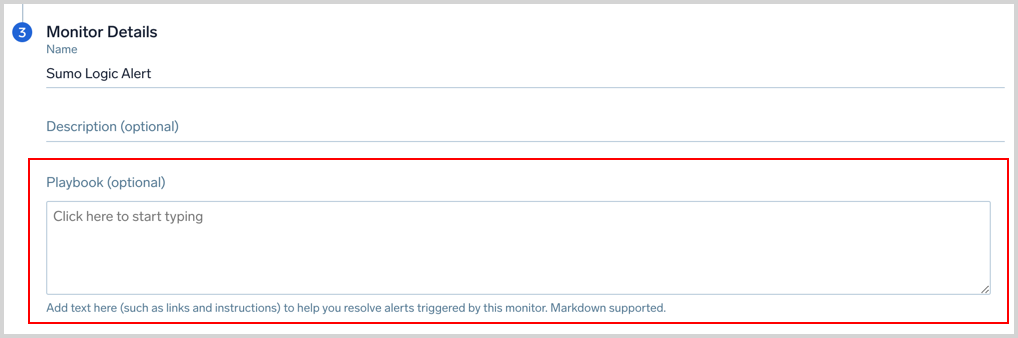
- F - opens the playbook associated with this Monitor. Playbooks allow admins to codify tribal knowledge for an on-call so they know what exactly to do when they receive an alert.
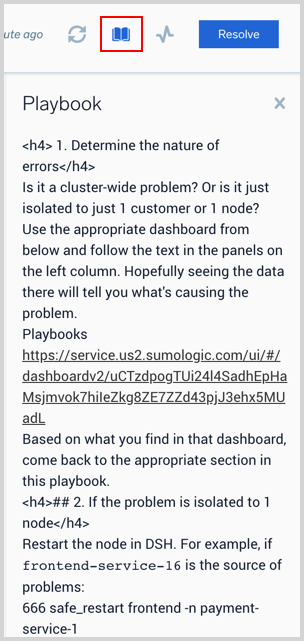
You have the option to provide a playbook when creating a Monitor, as shown in the below image. Markdown is supported.
- G - opens the Monitor that generated this alert.
- H - resolves the Alert. This will also resolve the Monitor that generated the alert. The Monitor will fire again when the alert condition is met.
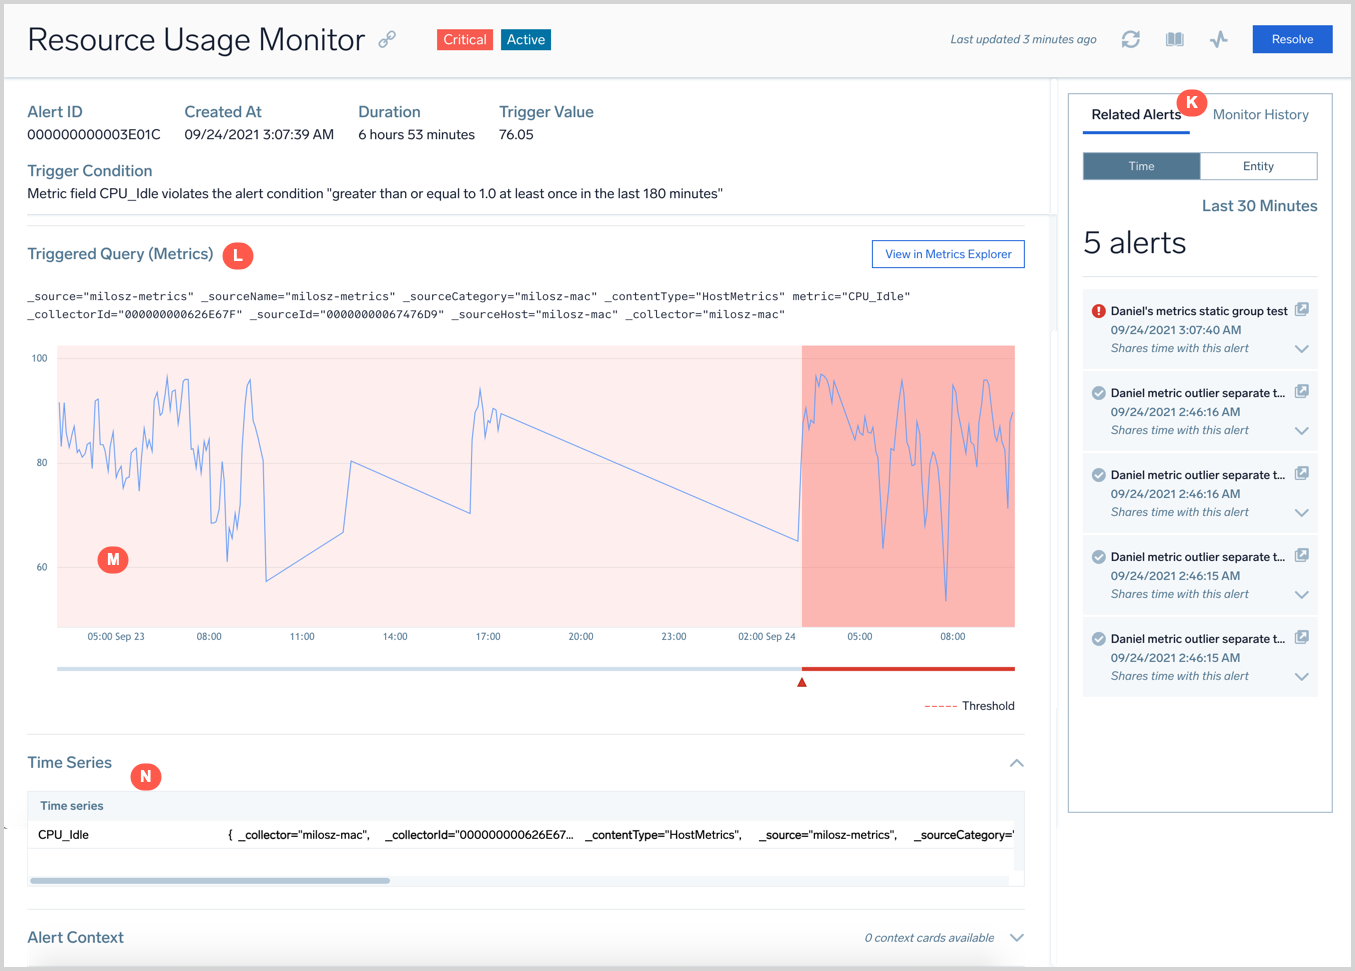
- K - a panel with Related Alerts and the Monitor History. The exclamation mark indicates the alert is still active and a white checkmark in the gray circle indicates it's resolved.
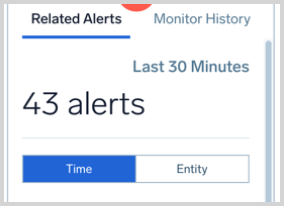
- Related Alerts shows other alerts in the system that were triggered around the same time as this alert. This information is helpful to know what issues are happening in the system and whether the current problem is an isolated issue or a more systemic one. There are two types of relations that a related alert can have.
- Time: Shows all the alerts that were triggered 30 minutes before or after the given alert that doesn't have another association.
- Entity: Shows all the alerts that were triggered one hour before and after the given alert that happened on the same entity (node, pod, cluster, etc.). You can click the expand arrow
 to view the alert's trigger condition and the white arrow in the square
  to open the alert in its own Alert page.
- Monitor History shows the past 30 days of similar alerts that were triggered by the Monitor (that generated the current alert). Monitor History can be helpful to figure out the following:
- How frequently the alert fired in the past and whether it's a flaky alert or not.
- Quickly correlate whether the current problem is similar to a past one by comparing the information shared for the alert.
- Related Alerts shows other alerts in the system that were triggered around the same time as this alert. This information is helpful to know what issues are happening in the system and whether the current problem is an isolated issue or a more systemic one. There are two types of relations that a related alert can have.
- L - the query of the Monitor.
- M - a chart that visualizes the trend of the metric that was tracked as part of the alert condition of the monitor. The visualization tracks the before and during trends of the metric.
- N - a table with the raw data that triggered the alert.
Below this, as you scroll down on the page you'll see context cards covered in the next section.
Context Cards
Alert Context provides additional information about interesting insights that the system has automatically discovered by analyzing your data. The system uses artificial intelligence and machine learning to track your logs and metrics data to find interesting patterns in the data that might help explain the underlying issue and surfaces them in the form of context cards.
Depending on the type of data the alert was based on, metrics or logs, and the detection method, static or outlier, you'll see different context cards. You will see a progress spinner labeled Analyzing alert content at the bottom of the window when cards are still being loaded. It may take a minute for some cards to load.
![]()
Log Fluctuations
This card detects different signatures in your log messages using LogReduce such as errors, exceptions, timeouts, and successes. It compares log signatures trends with a normal baseline period and surfaces noteworthy changes in signatures.
- New: Log signatures that were only seen after the Alert was triggered but not one hour prior to the Alert start time.
- Gone: Log signatures that are not present after the Alert was created but were present one hour prior to the Alert start time, such as, Transaction Succeeded or Success.
- Diff: Log signatures whose counts have changed after the alert when compared to one hour prior to the Alert start time.
The Log Fluctuations card will only work with Log Monitors at this time. It is not rendered for monitors driven by Metrics.
Use the Open button to view the Log Search that provided the Log Fluctuation insights. The box with an arrow icon ![]() opens a Log Search pivoted on a given signature.
opens a Log Search pivoted on a given signature.
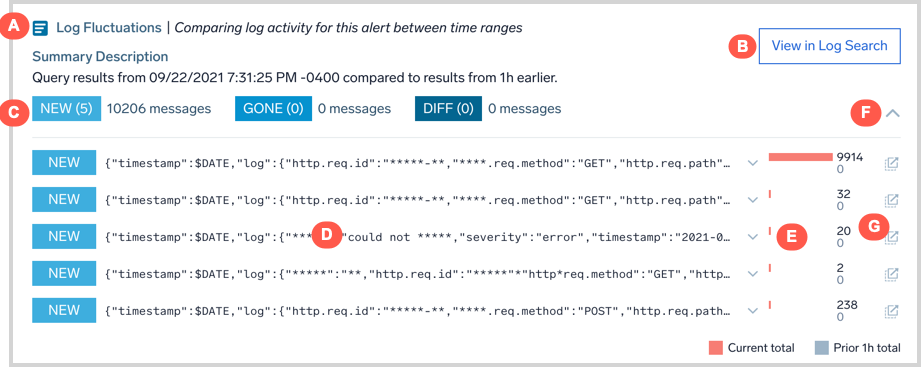
- A - the name of the card (Log Fluctuation) and a short description of what it does.
- B - a link to open the log query that populated the card, in the log search page.
- C - a summary of the discovered NEW, GONE, and DIFF signatures, and how many log messages belong to each type.
- D - the details about the identified log signature.
- E - a histogram showing how many log messages mapped to the given signature after the alert (red bar) and before (gray bar) the alert.
- F - option to collapse the expanded details.
- G - opens a Log Search filtered to the Log messages that mapped to the given signature.
Anomalies
This card detects time series anomalies for entities related to the alert. These insights are powered by the Root Cause Explorer.
Anomalies are grouped into golden signals. Anomalies are also presented on a timeline; the length of the anomaly represents its duration.
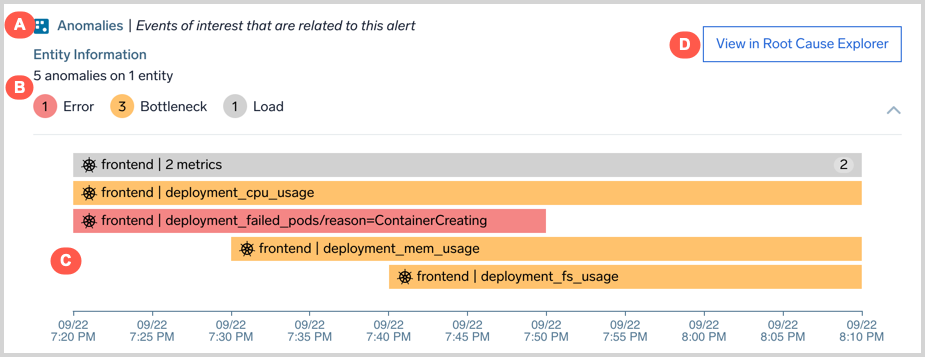
- A - the name of the card (Anomalies) and a short description of what it does.
- B - count of anomalies belonging to each golden signal type.
- C - a timeline view of anomalies with their start time and duration, the domain (e.g. AWS, Kubernetes), and the entity on which it was detected. Anomalies may be grouped based on connections between entities and similarity of metrics. For example, anomalies on EC2 instances that are members of an AutoScaling group may be grouped together. The count shown in each anomaly refers to the number of grouped anomalies.
- D - a link to view the anomalies in the Root Cause Explorer.
Only Anomalies with a start time around 30 minutes before or after the Alert was created show up in the card.
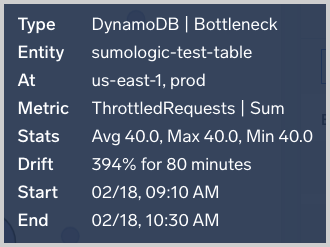
Hover over an EOI to view key information about the event.
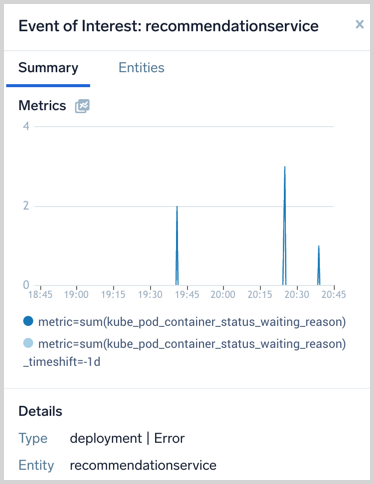
Click on the EOI to open the Summary View and Entity Inspector.
Dimensional Explanations
This card analyzes log data and surfaces dimensions or key-value pairs that drove it to an alerting state. For example, the card below has identified that ~80% of the alert logs have the field log.Error with the value could not retrieve cart: rpc error: code and is therefore a recommended item to investigate. 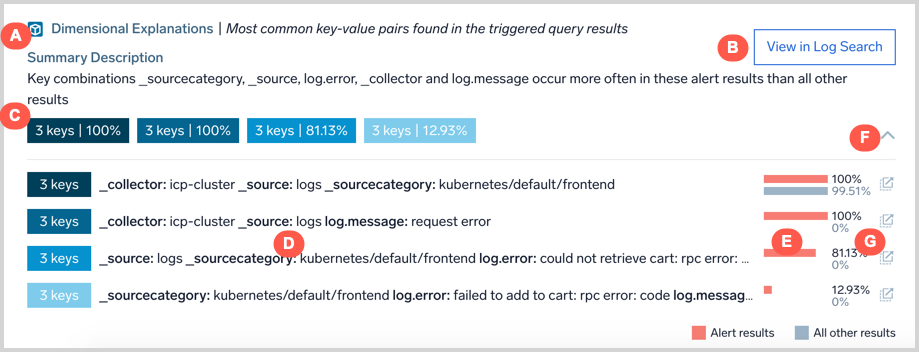
- A - the name of the card (Dimensional Explanations) and a short description of what it does.
- B - a link to open the log query that populated the card, in the log search page.
- C - groupings of the discovered key-value pairs by the count of keys and the percentage of log messages found with the key.
- D - the key-value pairs in each group.
- E - a histogram showing how many log messages with the key-value pair caused the alert (red bar) and did not cause (gray bar) the alert.
- F - option to collapse the expanded details.
- G - opens a Log Search filtered to the Log messages that mapped to the given signature.
Benchmark
Benchmarks refer to baselines computed from anonymized and aggregated telemetry data from Sumo Logic customers in domains such as AWS. If the telemetry values for your entity during an alert period are unusual compared to benchmarks, you may have an unusual configuration change or other backend issues.
For example, the card below shows that “ServiceUnavailable” error is happening 32 times more often in your AWS account compared with other Sumo Logic customer’s accounts. This AWS error pertains to AWS API calls that are failing at a higher rate than what is expected based on cross-customer baselines. This particular error implies an AWS incident affecting the particular AWS resource type and API.
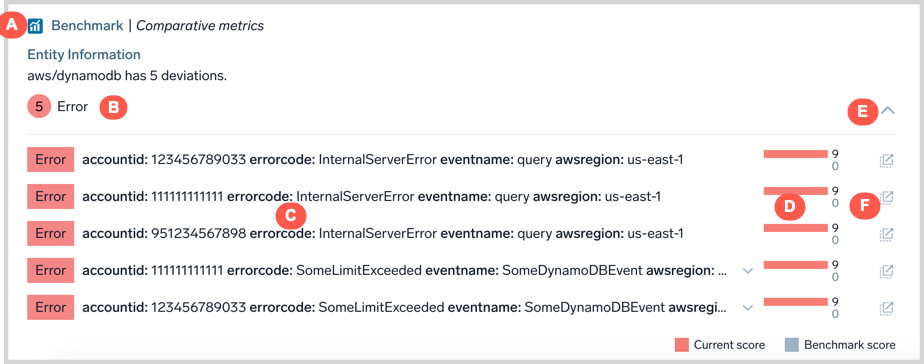
- A - the name of the card (Benchmark) and a short description of what it does.
- B - count of unusual Benchmarks by golden signal type.
- C - dimensional detail of the unusual telemetry value.
- D - comparison of your telemetry value (red bar) against benchmarks computed from other customers (gray bar).
- E - expand / collapse details panel.
- F - opens a Log Search filtered to the Log messages that match the dimensional details of the telemetry value
Subscribe to Alert Monitors
A Monitor creates an Alert. Using the options below, you're subscribing to an Alert's Monitor.
From your Alerts list
- Right-click on a row item > click Subscribe
- Hover your mouse over a row, click the three-dot kebab menu > select Subscribe
- Single-click on a row item > on the opened Alert page, click the three-dot kebab menu > Subscribe to Monitor
From your Monitors list
- Right-click on a row item > click Subscribe
- Hover your mouse over a row > click the three-dot kebab menu > select Subscribe
- Single-click on a row item > in the side panel (Monitor Details), click More Actions > Subscribe
Notification Preferences
Alert notification preferences give you granular control over specific monitor activity you want to follow. 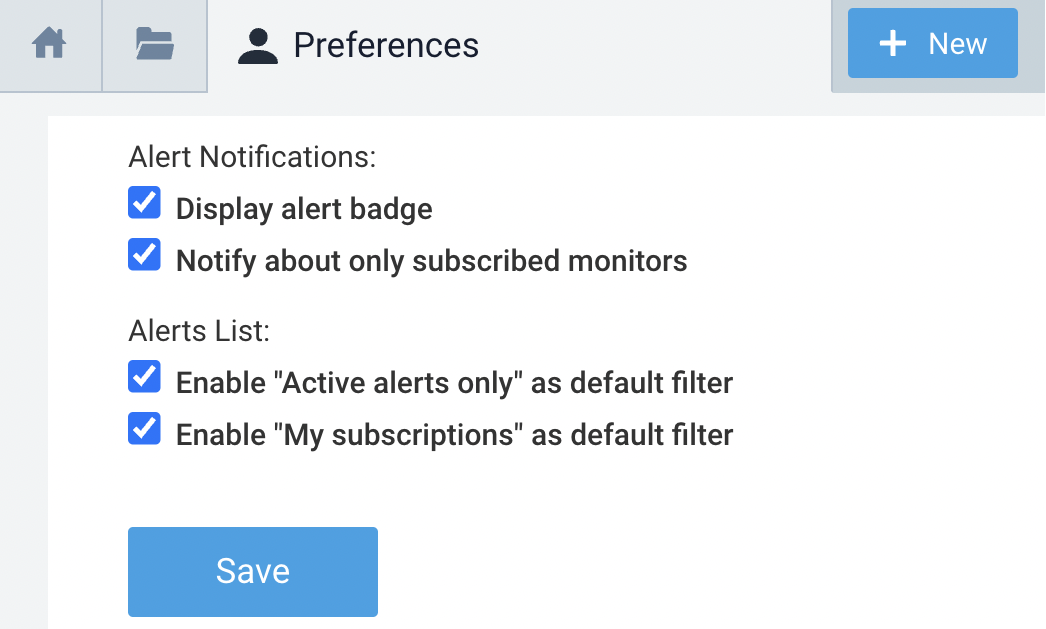
- From the left nav, click on your username > Preferences.
- Click on any of the following checkboxes to enable your desired preferences:
- Display Alert Badge: the bell icon is displayed in the top nav
- Notify about only subscribed monitors: the bell icon will only push notifications for monitors you're subscribed to
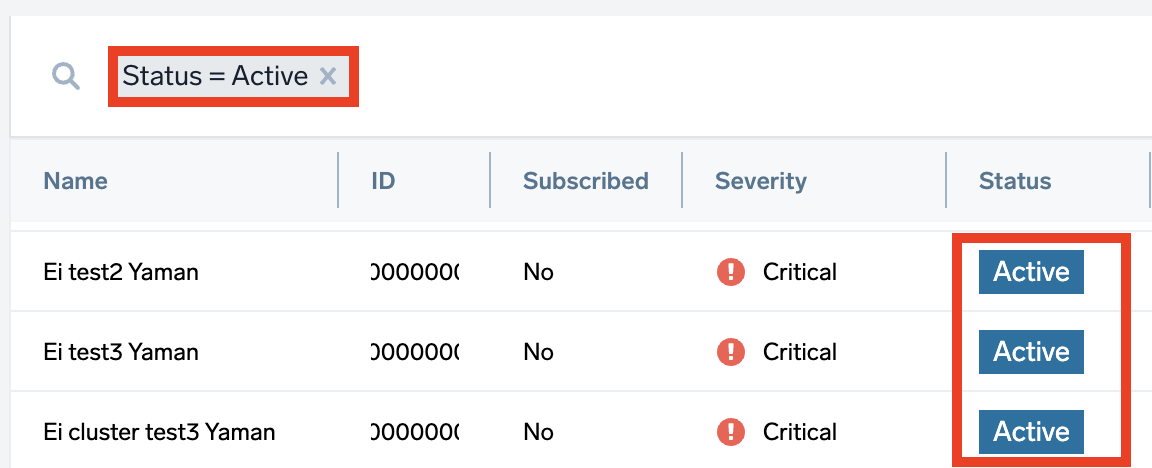
- Enable "Active alerts only" as default filter: your Alert list, by default, will only display alerts with an Active status (excludes Resolved ones)
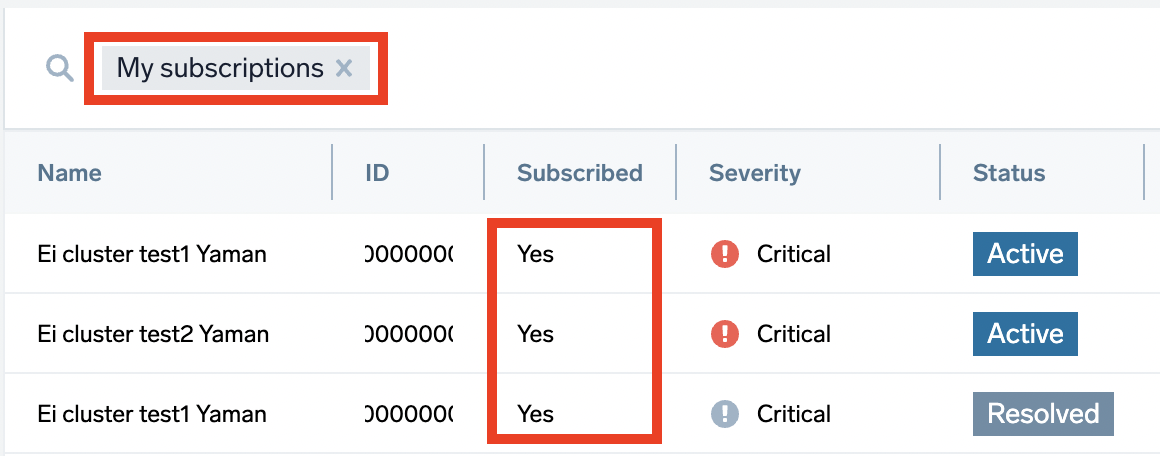
- Enable "My subscriptions" as default filter: your Alert list, by default, will only display alerts you're subscribed to
- Click Save when you're done.
Limitations
- The Alert list page shows up to 1,000 alerts.
- On the Alert page, the Alert visualization, labeled M, is only shown for an alert that is less than 30 days old.
- On the Alert page, Related Alerts and Monitor History show the top 250 alerts.