Real User Monitoring
Real User Monitoring (RUM) gives you the ability to understand how users interact with the digital interfaces of your business and if their experience is satisfactory or not. This open-source powered and flexible capability brings you full visibility into what’s happening in your user's browser while interacting with your web applications.
RUM provides you visibility into end-to-end individual user transactions to quickly understand the user experience. You'll get insights into delays that occurred on the client, overall end-to-end transaction times, network timings, rendering events, and can perform high-level monitoring, alerting, as well as troubleshooting any potential slow-downs. You have full details about the specific performance of top user cohorts, their geographical locations, browsers, and operating systems. You can also fully understand the overall experience of all users and transactions of your digital business, all the time.
See Real User Monitoring in action.
How it works
The Sumo Logic OpenTelemetry auto-instrumentation for JavaScript library enables RUM data collection in the form of OpenTelemetry-compatible traces and logs directly from the browser. It gathers information about the load, execution, and rendering of your JavaScript applications and records information about browser-to-backend performance of every user transaction in real time, without sampling.
This data is gathered directly from your end-user devices and displayed as individual spans representing user-initiated actions (like clicks or document loads) at the beginning of each trace, reflecting its request journey from the client throughout the whole application and back. This includes any unhandled errors, exceptions, and console errors generated by the browser.
All data collected is compatible with OpenTelemetry and doesn't use proprietary vendor code. Real user monitoring supports document load actions as well as XHR communication and route changes for single-page app navigation. The full list of functionalities and configuration is available in the Sumo Logic OpenTelemetry auto-instrumentation for JavaScript README file.
Configuring RUM Data Collection
To collect traces from a browser, you'll first need to create a RUM HTTP Traces Source. The source will have an endpoint URL that you'll put in a script that sends trace data in OTLP/JSON over HTTP protocol.
XHR and navigation/route changes support as well as errors collection require RUM script in version 4 or higher (https://rum.sumologic.com/sumologic-rum-v4.js). Please ensure you are using the correct version in your pages. For automatic updates, use https://rum.sumologic.com/sumologic-rum.js.
For full end-to-end visibility, we recommended supplementing your RUM browser auto-instrumentation with appropriate backend-tracing instrumentation.
Step 1: Create a RUM HTTP Traces Source
To configure a RUM HTTP Traces source:
From Sumo Logic, select Manage Data > Collection > Collection.
On the Collection page, click Add Source next to a Hosted Collector.
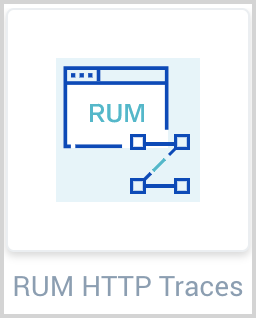
Select RUM HTTP Traces.
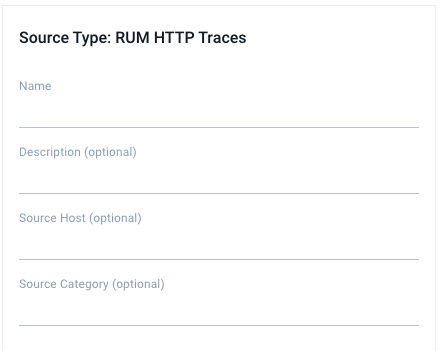
Under Source Type: RUM HTTP Traces, enter the following information:
- Name for the Source.
- Description for the Source (optional).
- Source Host and Source Category (optional): enter any string to tag the output collected from the source. These are built-in metadata fields that allow you to organize your data. We recommend you specify a Source Category indicating the data is from a browser.
Enter Advanced options for Browser RUM. A list of FAQs on the page can provide help for these options. A table with all the available configuration parameters is available in the Sumo Logic OpenTelemetry auto-instrumentation for JavaScript README file.
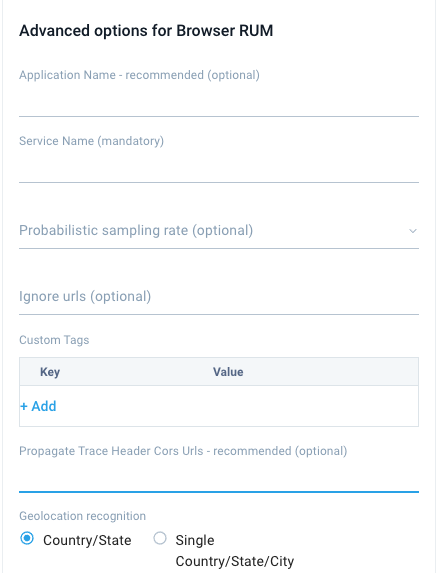
Application Name (recommended): Add an Application Name tag of a text string to show for the app name in spans, for example
bookings-app. This groups services in the Application Service View. If left blank, services will belong to a "default" application. See Application Service Dashboards for more information. This setting is saved in the script forname_of_your_web_application.Service Name (required): Add a Service Name of a text string to show for the service name in spans, for example
bookings-web-app. This setting is saved in the script forname_of_your_web_service.Probabilistic sampling rate (optional): Add a Probabilistic sampling rate for heavy traffic sites in a decimal value based on percentage, for example, 10% would be entered as
0.1.Ignore urls (optional): Add a list of URLs not to collect trace data from. Supports regex. For example:
/^https:\/\/www.tracker.com\/.*/, /^https:\/\/api.mydomain.com\/log\/.*/. Please make sure provided URLs are valid JavaScript flavor regexes.Custom Tags (optional): Click +Add and enter a key and value for each Custom Tags to show in spans from instrumented browsers. For example, click +Add and enter a key
deployment.environmentwith a value ofproduction. This information is saved in the script forname_of_your_web_service.Propagate Trace Header Cors Urls (recommended): Add a list of URLs or URL patterns that pass tracing context to construct traces end-to-end. This information is saved in the script for
list_of_urls_to_receive_trace_context. Some examples are/^https:\/\/api.mydomain.com\/apiv3\/.*/and/^https:\/\/www.3rdparty.com\/.*/.. Please make sure provided URLs are valid JavaScript flavor regexes.Propagate Trace Header Cors Urls Sumo Logic cannot perform configuration validation of services of other origins. You should always enable context propagation and CORS configuration changes in a test environment before setting it up in production.
Review our recommendations (click to expand)
This list is empty by default, which means trace context propagation—allowing creation of end to and front end to backend traces for cross-origin requests—is not enabled because of browser CORS security restrictions. To connect your front-end and back-end traces, make sure your environment supports W3C Trace Context HTTP headers.
To propagate tracing context to create front-end to back-end traces, set domain(s) to propagate W3C tracing context to. You must also configure your servers/APIs to accept and return following CORS headers in its response:
Access-Control-Allow-Headers: traceparent, tracestateValid cross-origin resources must include the prefix
http://orhttps://and the domain name. The port number is not required unless it differs from the default for HTTP (port 80) or HTTPS (port 443).Geolocation recognition: Select a Geolocation recognition option to automatically recognize geographical locations of your end clients from:
- The country down to state (recommended for global websites)
- A single country down to city level (recommended for local, country specific websites)
When you are finished configuring the Source, click Submit.
An HTTP Source Script is displayed in a pop-up with three different formats: synchronous, asynchronous, and npm. These are examples of scripts you can use with all configurations you entered when creating the source, including advanced options. Select a format and click Copy to Clipboard.
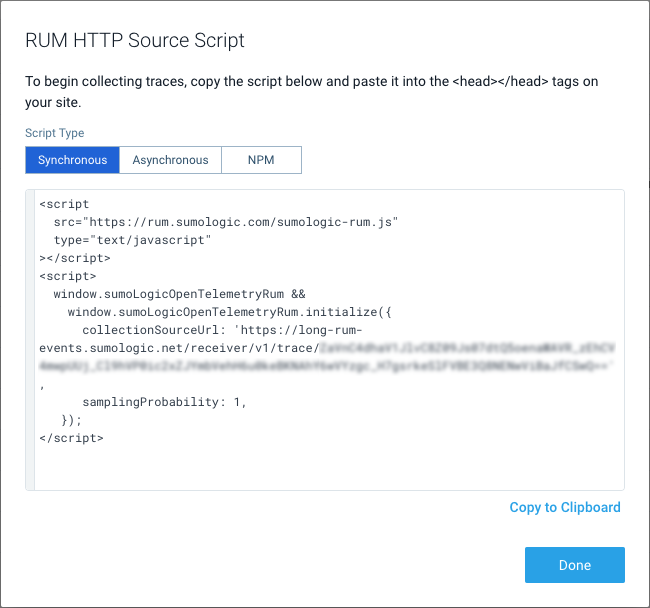
The script includes a RUM HTTP Traces Source URL for
collectionSourceUrlin the generated script. This is saved for the script assumo_logic_http_traces_source_url. Your user's browser should be allowed to POST data to this URL.This can be also replaced with an internal OpenTelemetry collector if you wish to redirect browser traffic over it. In this case, replace this URL with the OpenTelemetry collector OTLP/HTTP receiver endpoint as described in Getting Started with Transaction Tracing. In this case, the OpenTelemetry collector exporter will send data to the RUM HTTP Traces Source URL.
Step 2: Add Script to Your Page Header
Use the copied script in your page head inside the <head> </head> tags. The script sends trace data in OTLP/JSON over HTTP protocol. The following are base script examples, populated when you create and configure a source in the above instructions.
- Synchronous
- Asynchronous
- NPM
<script src="https://rum.sumologic.com/sumologic-rum-v3.js" type="text/javascript"></script>
<script>
  window.sumoLogicOpenTelemetryRum &&
    window.sumoLogicOpenTelemetryRum.initialize({
      collectionSourceUrl: 'sumo_logic_traces_collector_source_url',
      serviceName: 'name_of_your_web_service',
      propagateTraceHeaderCorsUrls: [
        'list_of_domains_to_receive_trace_context',
      ],
    });
</script>
You can load the script asynchronously using the script below but some functionalities like user interactions or requests made before script run will be limited.
<script>
  (function (w, s, d, r, e, n) {
    (w[s] = w[s] || {
      readyListeners: [],
      onReady: function (e) {
        w[s].readyListeners.push(e);
      },
    }),
      ((e = d.createElement('script')).async = 1),
      (e.src = r),
      (n = d.getElementsByTagName('script')[0]).parentNode.insertBefore(e, n);
  })(
    window,
    'sumoLogicOpenTelemetryRum',
    document,
    'https://rum.sumologic.com/sumologic-rum-v3.js',
  );
  window.sumoLogicOpenTelemetryRum.onReady(function () {
    window.sumoLogicOpenTelemetryRum.initialize({
      collectionSourceUrl: 'sumo_logic_traces_collector_source_url',
      serviceName: 'name_of_your_web_service',
      propagateTraceHeaderCorsUrls: [
        'list_of_domains_to_receive_trace_context',
      ],
    });
  });
</script>
The other option is to bundle this library inside your project and initialize it. Inside your project directory, execute:
npm install @sumologic/opentelemetry-rum
RUM needs to be initialized, preferably before other functionalities in your code:
import { initialize } from '@sumologic/opentelemetry-rum';

initialize({
  collectionSourceUrl: 'sumo_logic_traces_collector_source_url',
  serviceName: 'name_of_your_web_service',
  propagateTraceHeaderCorsUrls: ['list_of_domains_to_receive_trace_context'],
});
The above script examples omit the version number and automatically uses most up-to-date version of it (which you can find here). If you want to manually control versioning of the script, please use:
https://rum.sumologic.com/sumologic-rum-vX.js(e.g., https://rum.sumologic.com/sumologic-rum-v4.js) for major version control (no breaking changes)https://rum.sumologic.com/sumologic-rum-vX.Y.js(e.g., https://rum.sumologic.com/sumologic-rum-v4.0.js) for major version control (only bug fixes are automatically included)https://rum.sumologic.com/sumologic-rum-vX.Y.Z.js(e.g., https://rum.sumologic.com/sumologic-rum-v4.0.0.js) for major version control (strict version control)
RUM scripts can be also wrapped in the form of a browser extension/plugin for monitoring SaaS applications in environments where you can control user browser configuration (e.g., internal employees). To obtain a customized browser extension for your environment to monitor Real User Experience with Sumo Logic, contact your Account Team or Sumo Logic support.
You can view and copy a script anytime by clicking Show Script for the source.
![]()
Step 3: Search Traces from the Browser
Create a trace query that specifies traces starting with the value you gave to <name_of_your_web_service> as a root service name. You can also include the following filters as an operation name:
documentLoadas an operation name to find traces that correspond to page loads.Click on *as an operation name to detect click actions that most likely resulted in XHR callsNavigation: *as an operation name to detect single-page app navigation changes
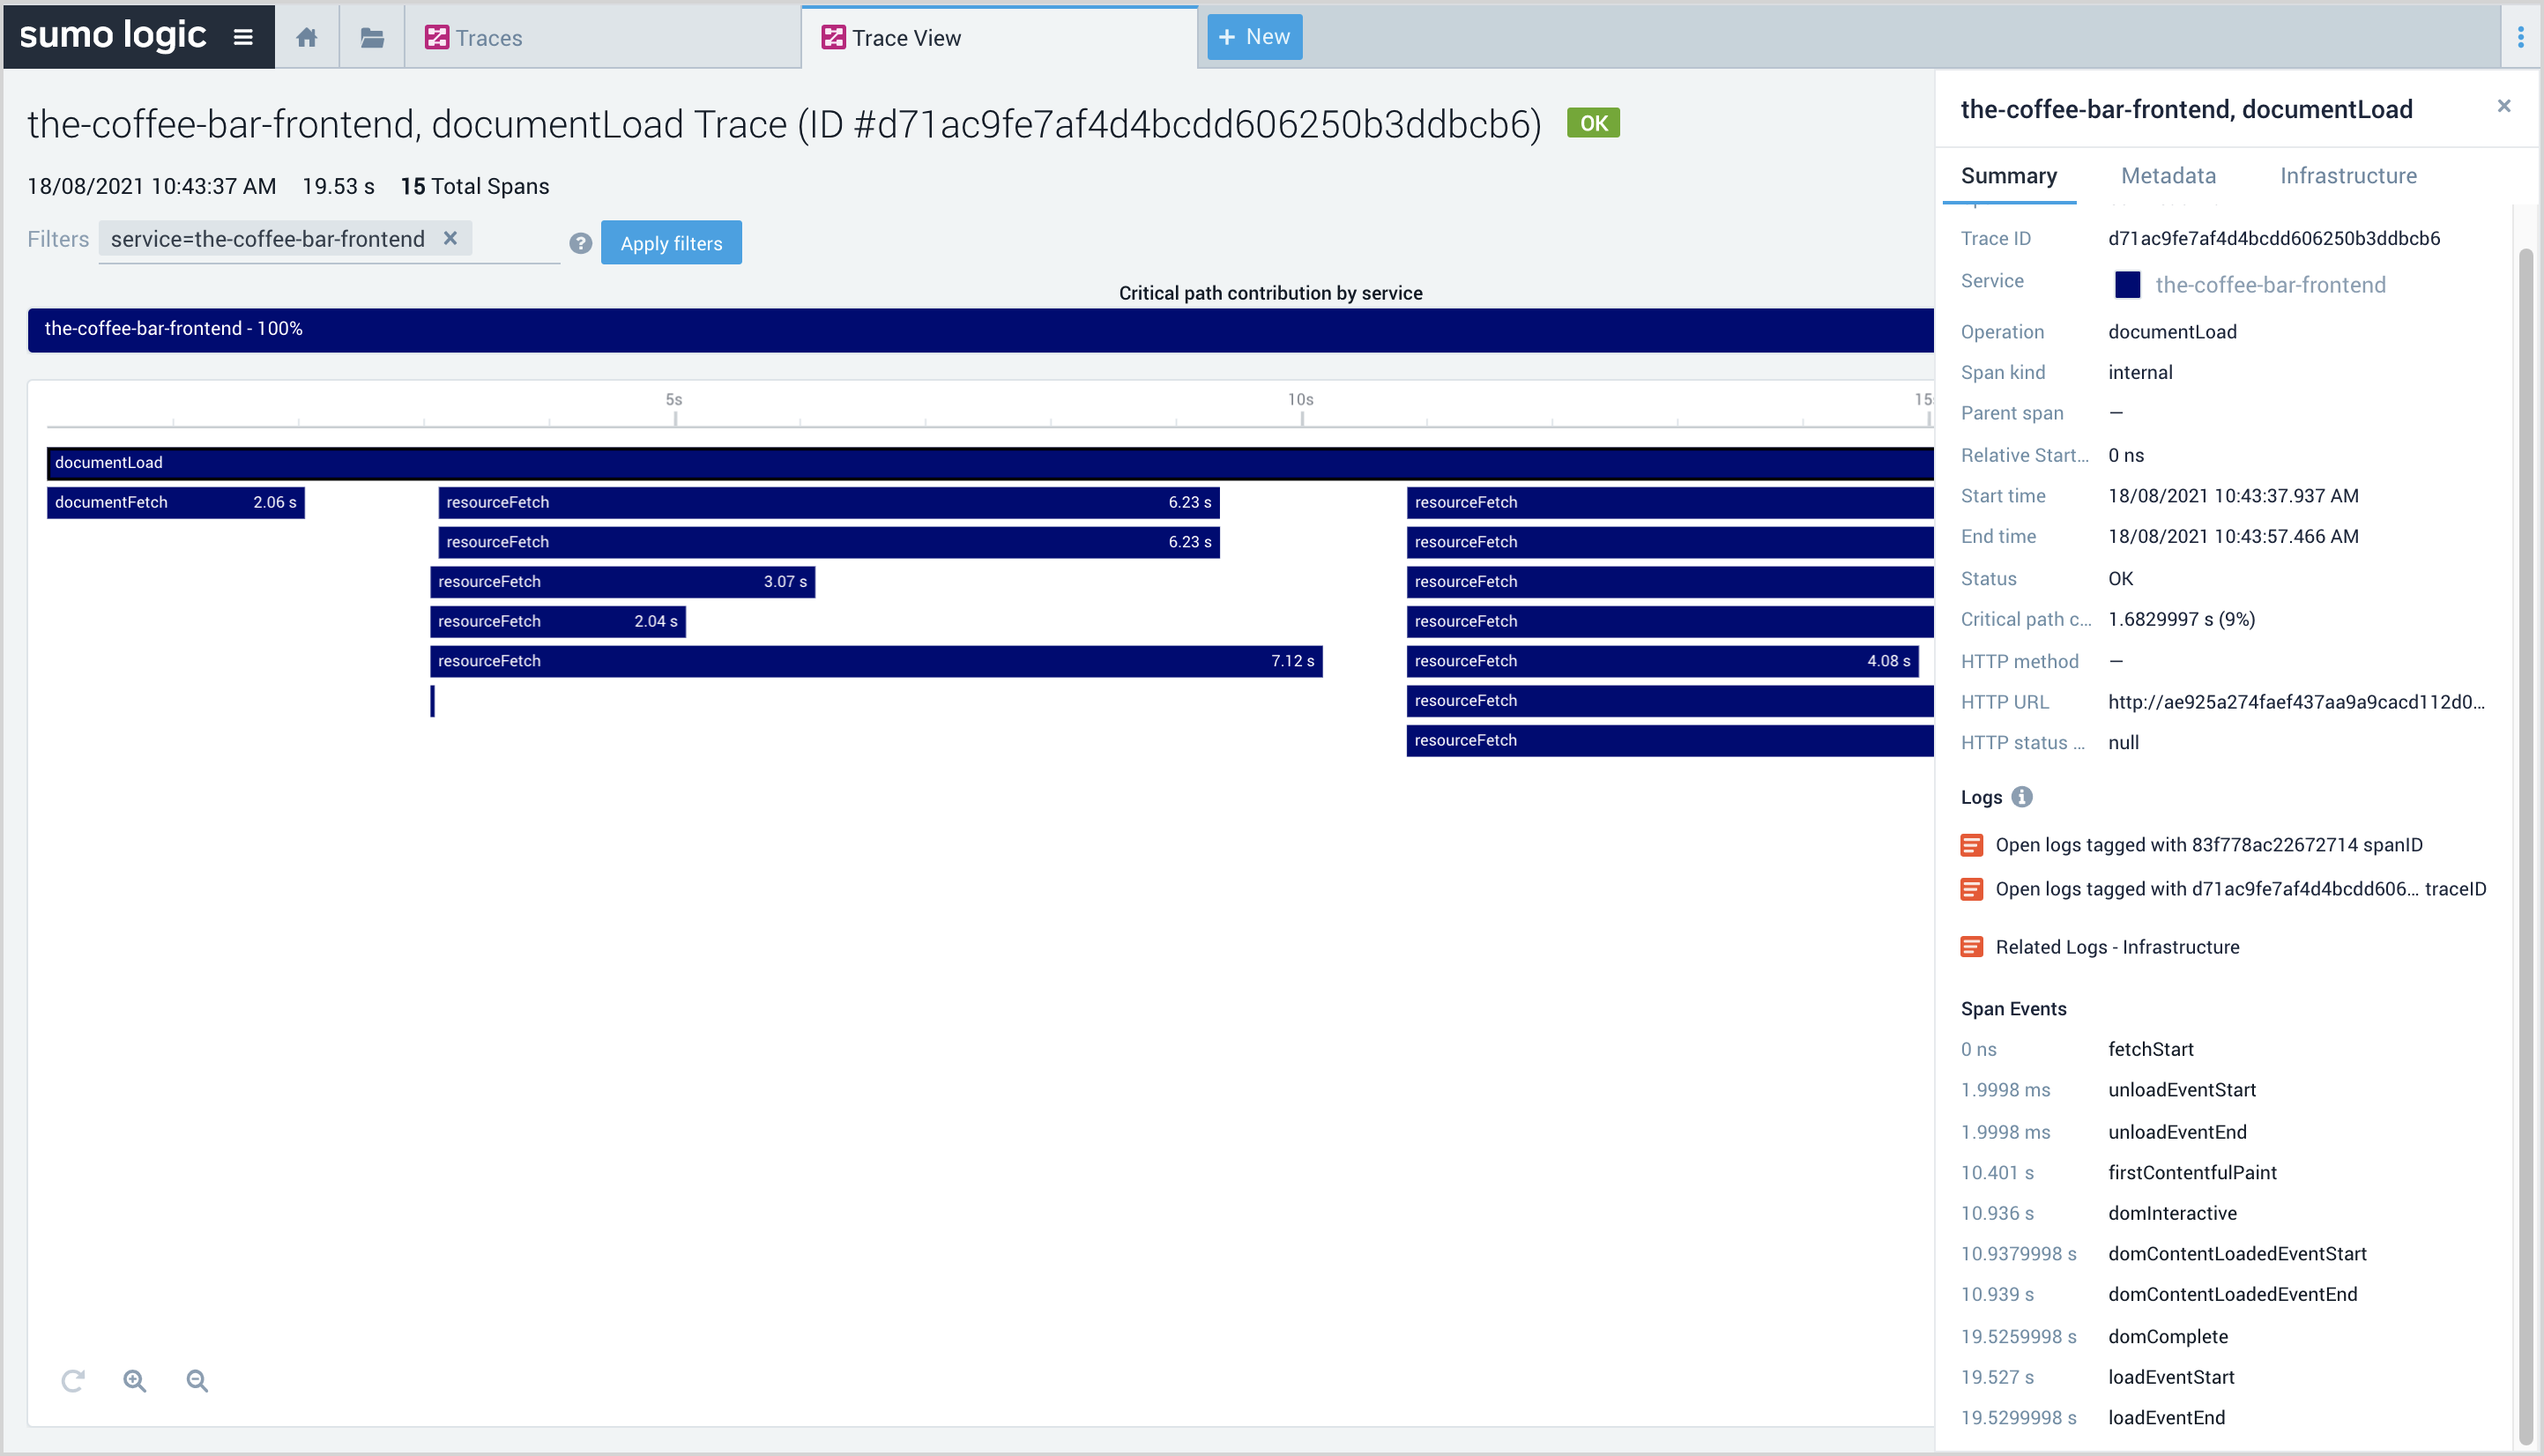
Click on any of the load spans, such as documentLoad, documentFetch, or resourceFetch (for documentLoad), to open a right-side panel with detailed span metadata, including timing events.
RUM Metrics Types
RUM metrics are automatically generated for you from browser traces. They provide insight into your website's overall user experience as well as front-end services, operating systems, geographical locations, and top-loaded page groups and user cohorts categorized by their browsers.
Metrics are collected for user actions representing document loads, which means actual retrieval and execution of web documents in the browser as well as XHR calls and route changes. Measurements include W3C navigation timings, XHR delays, Core Web Vitals KPIs, longtask events (delays) and others.
For ad-hoc queries, you can find these metrics in Metrics Explorer by querying for:
_contenttype=rummetricfromtrace
Document Load Metrics
The following table has details on the Document Load metrics collected from JavaScript. These are available in each trace in the documentLoad and documentFetch spans as span events in the details panel and also used in the Real User Monitoring app to populate the Website Performance and UI Paint Timings panels.
| Name | Calculation |
|---|---|
browser_time_to_dns_resolution_end | domainLookupEnd - span start time (fetch start) |
browser_time_to_ssl_end | if secureConnectionStart > 0: connectionEnd - span start time (fetch start) else NaN |
browser_time_to_tcp_established | if secureConnectionStart > 0: secureConnectionStart - span start time (fetch start) else connectionEnd - span start time (fetch start) |
browser_time_to_request_end | responseStart - span start time (fetch start) |
browser_time_to_fb * | responseEnd - span start time (fetch start) |
browser_time_to_response_end | domInteractive - span start time (fetch start) |
browser_time_to_interactive | domComplete - span start time (fetch start) |
browser_time_to_processing_end | loadEventEnd - span start time (fetch start) |
The above metrics, presented in the form of areas on the Website Performance panels on RUM dashboards, can help you understand the sequence of events (pictured below) from user clicks to a fully loaded document.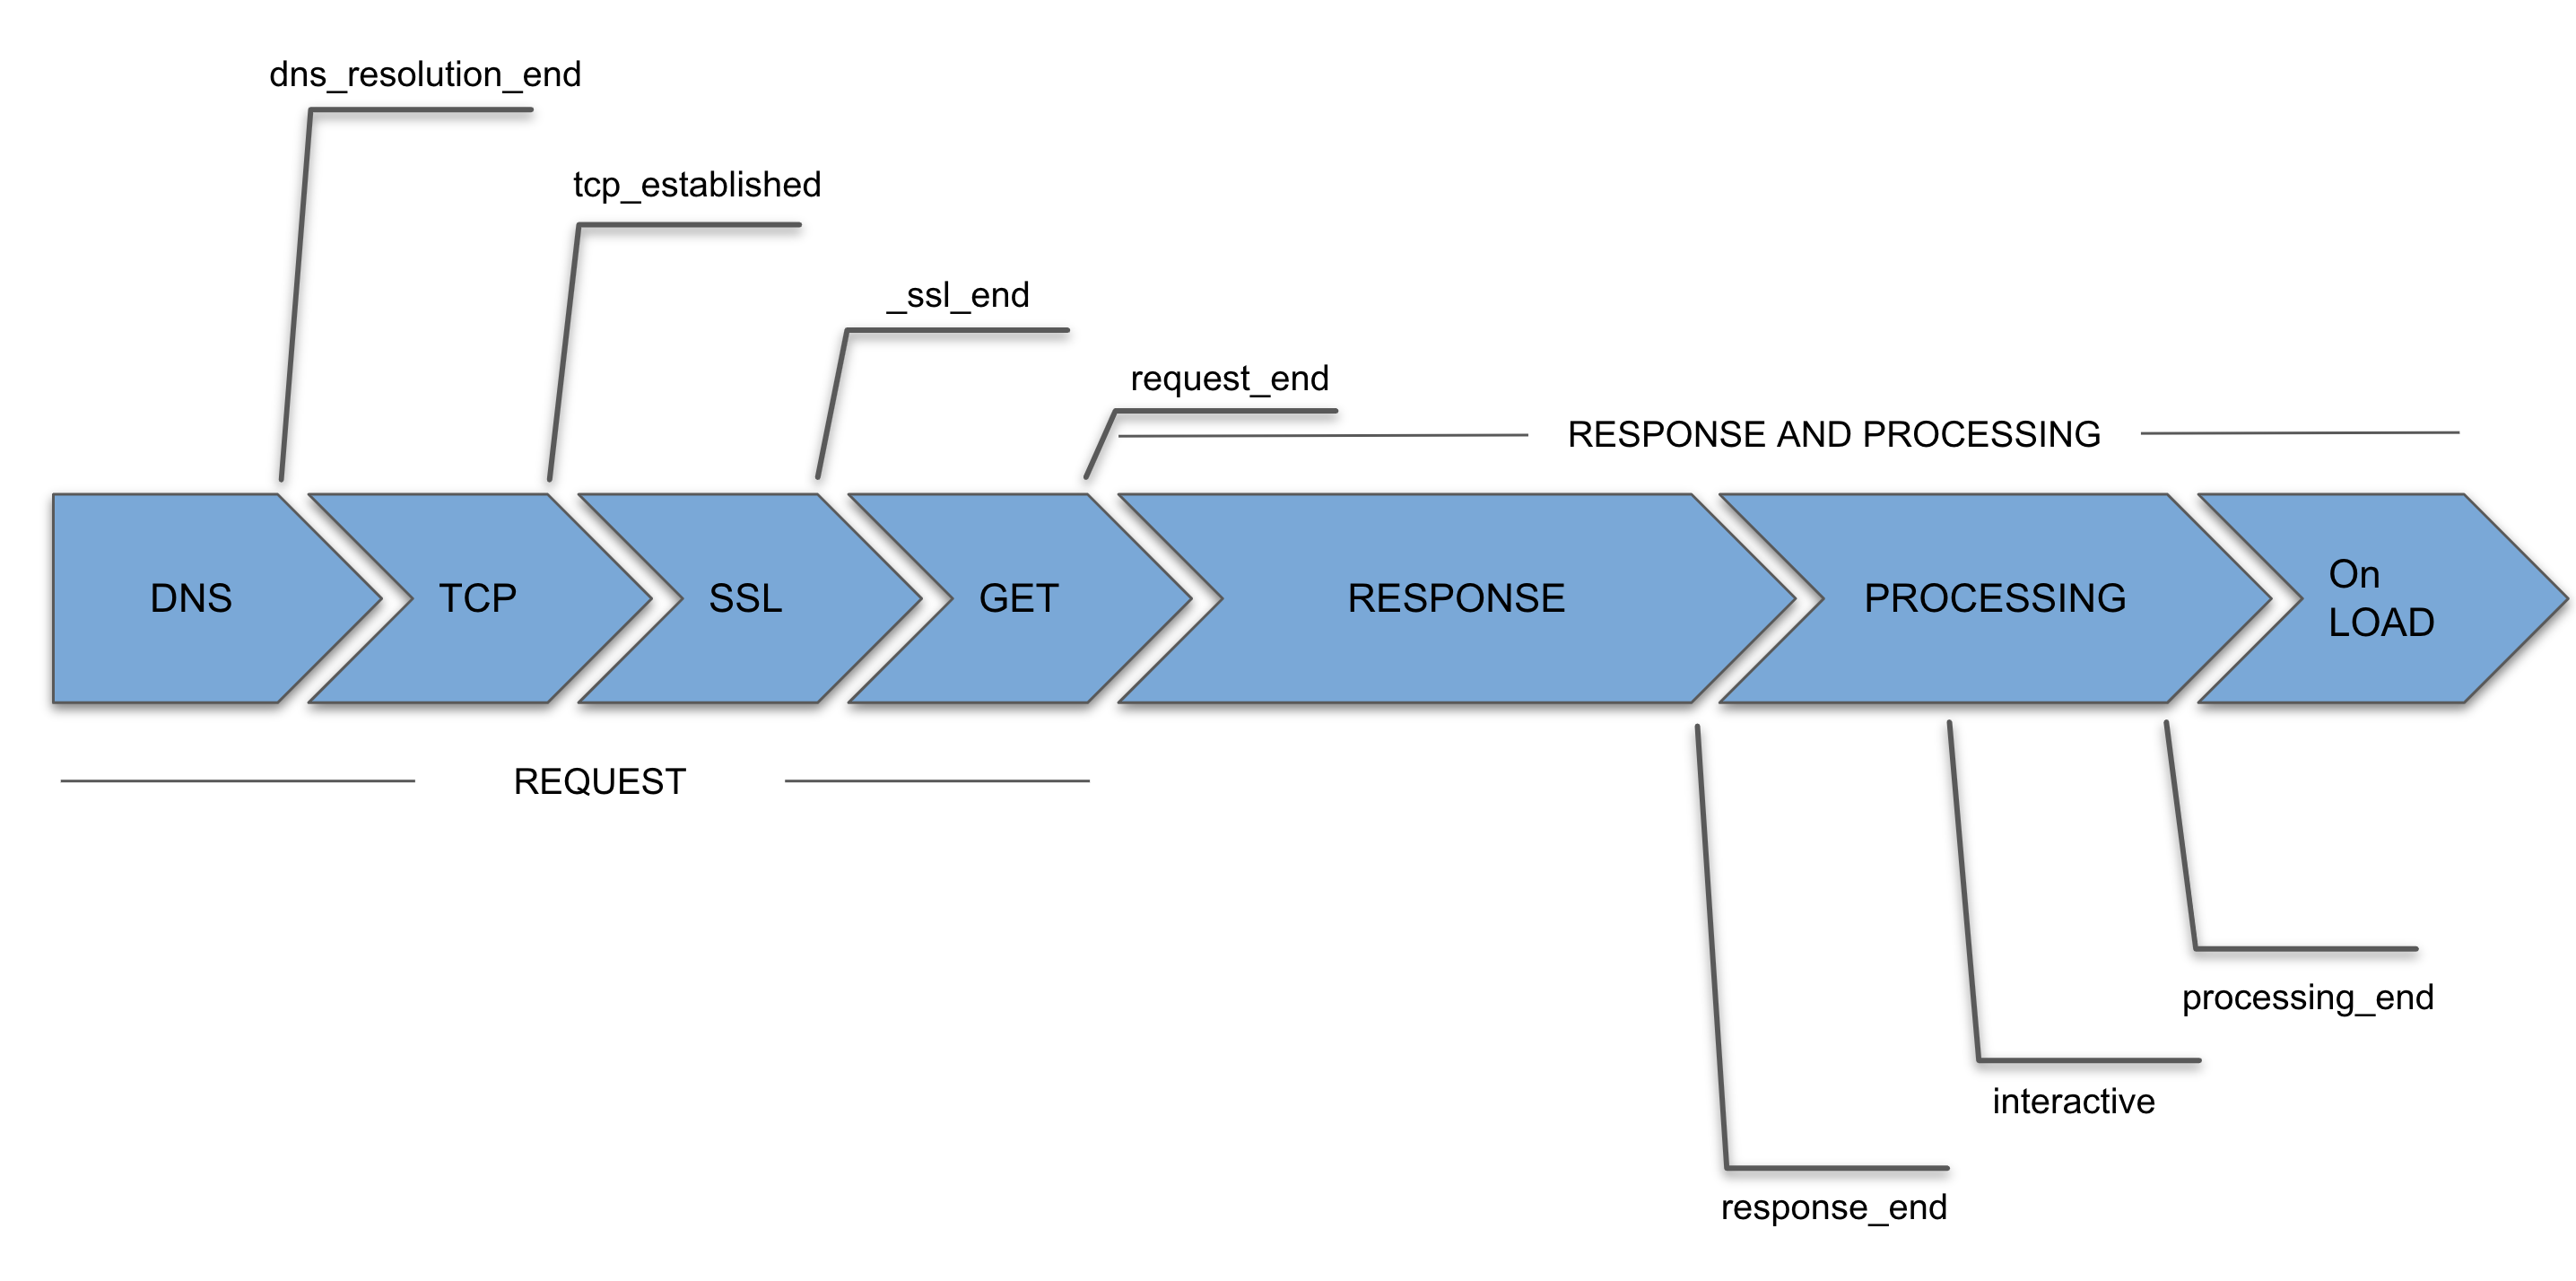
browser_time_to_fb): measures the delay between start of the page load and moment when the first byte of the response appears. It helps identify when a web server is too slow to respond to requests. You'll find this metric on the Navigation Timings chart.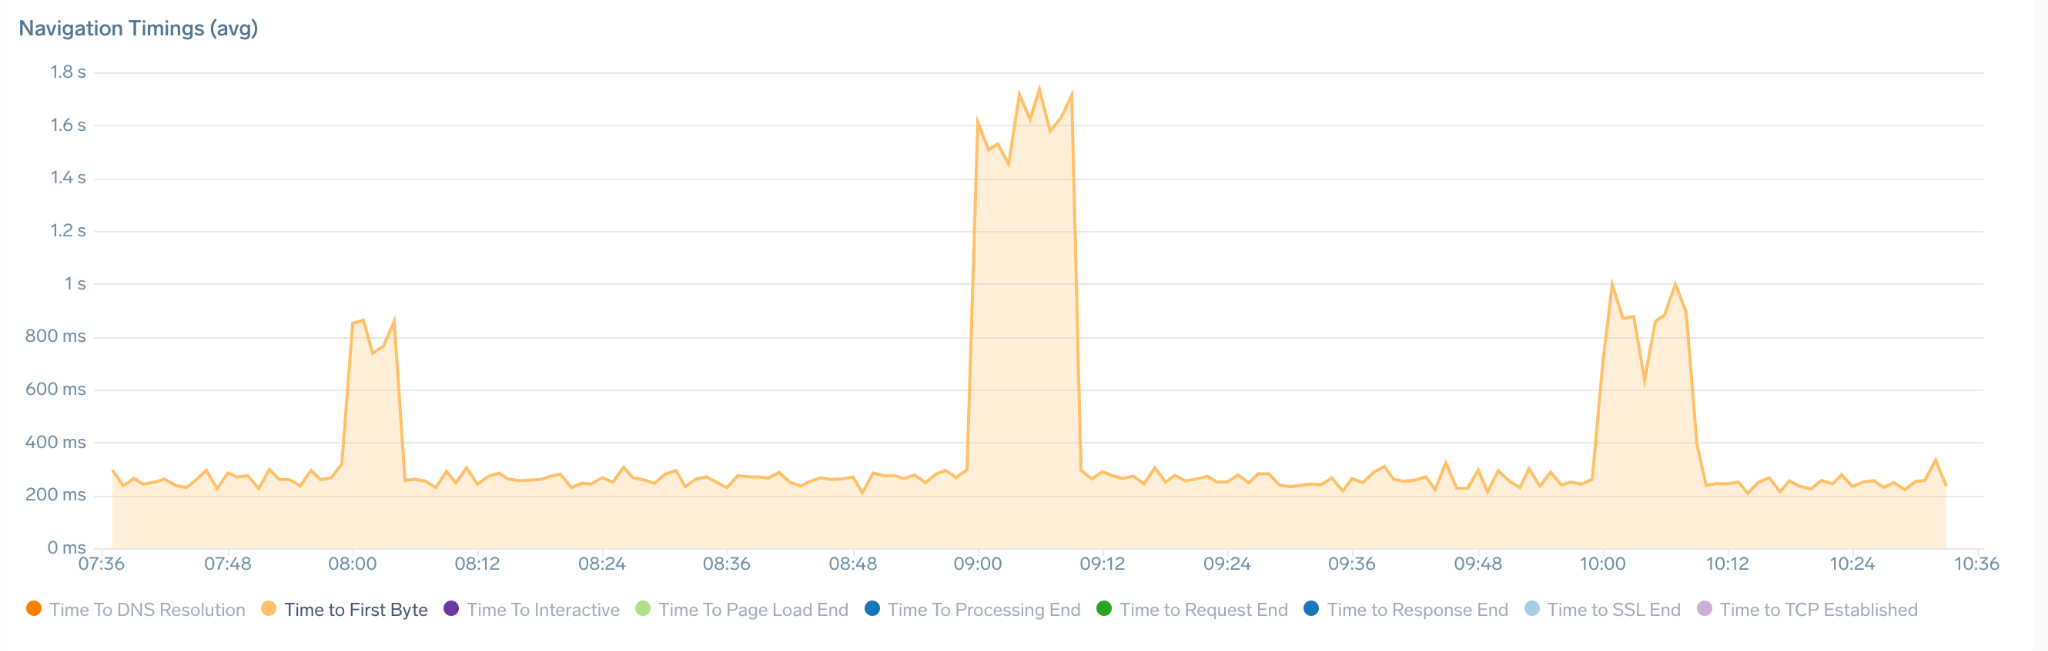
Timing metrics are not calculated if the visibility state of the document was "hidden" at any point during the load.
See W3C navigation timing for details on how an interface for web applications defines its access timing information concerning navigation and other elements.
Rendering Events Metrics
These metrics, which populate in the UI Paint Timings panel on RUM dashboards, explain rendering events inside the user's browser.
| Name | Calculation |
|---|---|
browser_time_to_fp | firstPaint - span start time (fetch start) |
browser_time_to_fcp | firstContentfulPaint - span start time (fetch start) |
browser_time_to_lcp | largestContentfulPaint - span start time (fetch start) |
- First Paint: measures the time from page fetch start (span start time) to the moment when the browser renders the first pixels to the screen, rendering anything that is visually different from what was on the screen prior to navigation. It answers the question, "Is it happening?"
- First Contentful Paint: measures the time from page fetch start (span start time) to the moment when any part of the page's content is rendered on the screen. For this metric, "content" refers to text, images (including background images),
<svg>elements, or non-white<canvas>elements. - Largest Contentful Paint: measures the time from page fetch start (span start time) to the moment when the largest image or text block visible within the viewport is rendered.
These are only loosely related to navigation timings and in many cases, some of them may appear long after the page is fully loaded in the browser, which indicates rendering slowdowns.
Core Web Vitals Metrics
Core Web Vitals (CWV) is an initiative by Google that defines web page KPIs. Each CWV represents a distinct facet of the user experience that's measurable in the field and reflects the real-world experience of a critical user-centric outcome.
| Name | Calculation |
|---|---|
browser_time_fid | From CVW First Input Delay API |
browser_time_to_lcp | largestContentfulPaint - span start time (fetch start) |
browser_cls | From CVW Cumulative Layout Shift API |
CWV focuses on three aspects of the user experience: document loading, interactivity, and visual stability. This includes the following metrics (and their respective thresholds):
- First Input Delay (FID): measures interactivity. To provide a good user experience, pages should have a FID of 100 milliseconds or less.
- Largest Contentful Paint (LCP): measures loading performance. To provide a good user experience, LCP should occur within 2.5 seconds of when the page first starts loading.
- Cumulative Layout Shift (CLS): measures visual stability. To provide a good user experience, pages should maintain a CLS of 0.1 or less.
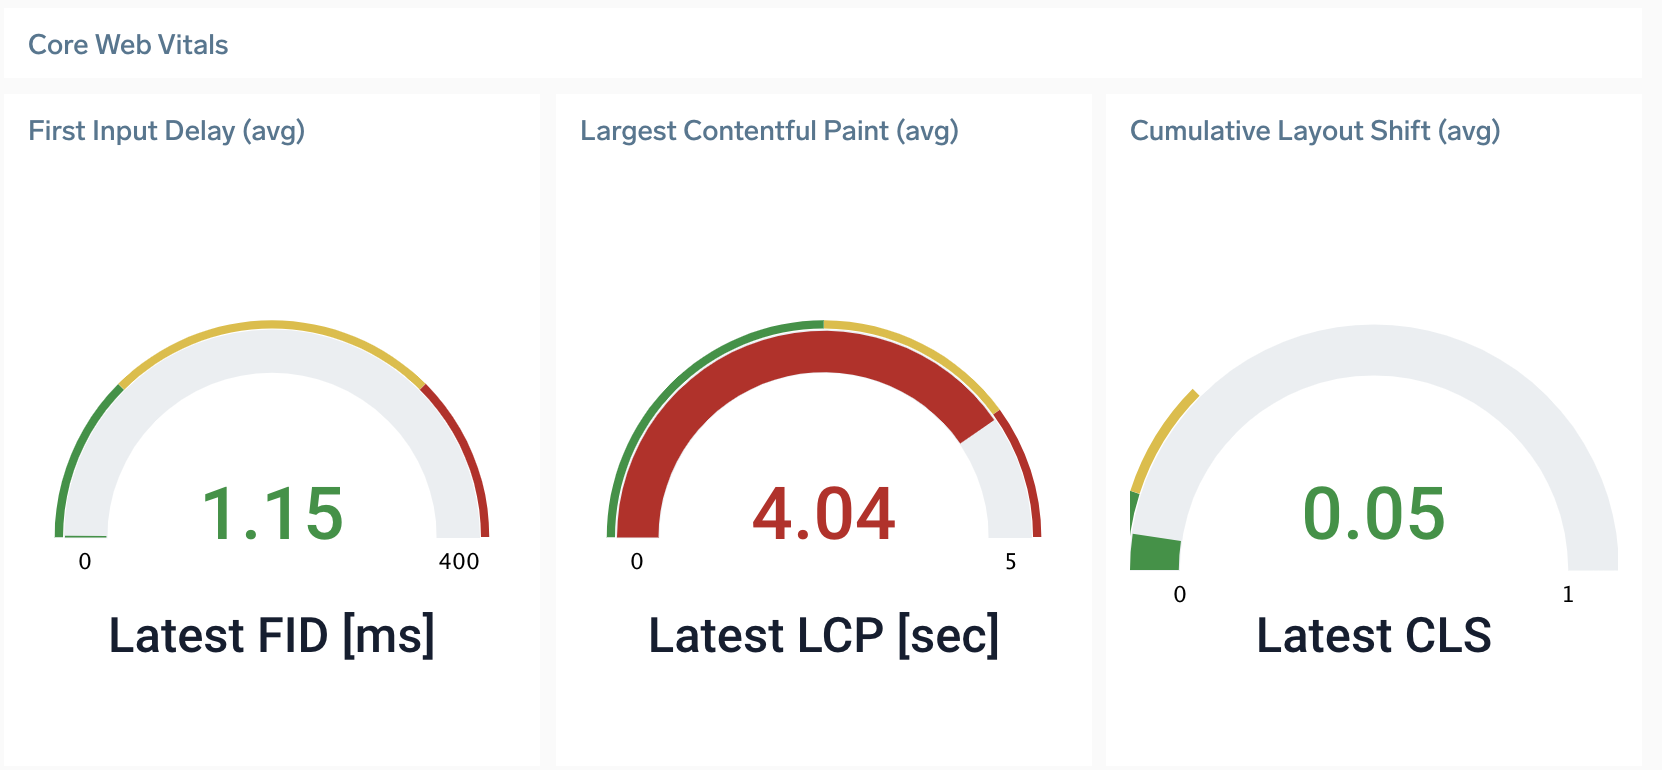
The above three CWV KPIs are captured and displayed on Overview dashboards for Document Load action types. Detailed metrics are available in span metadata for every transaction trace.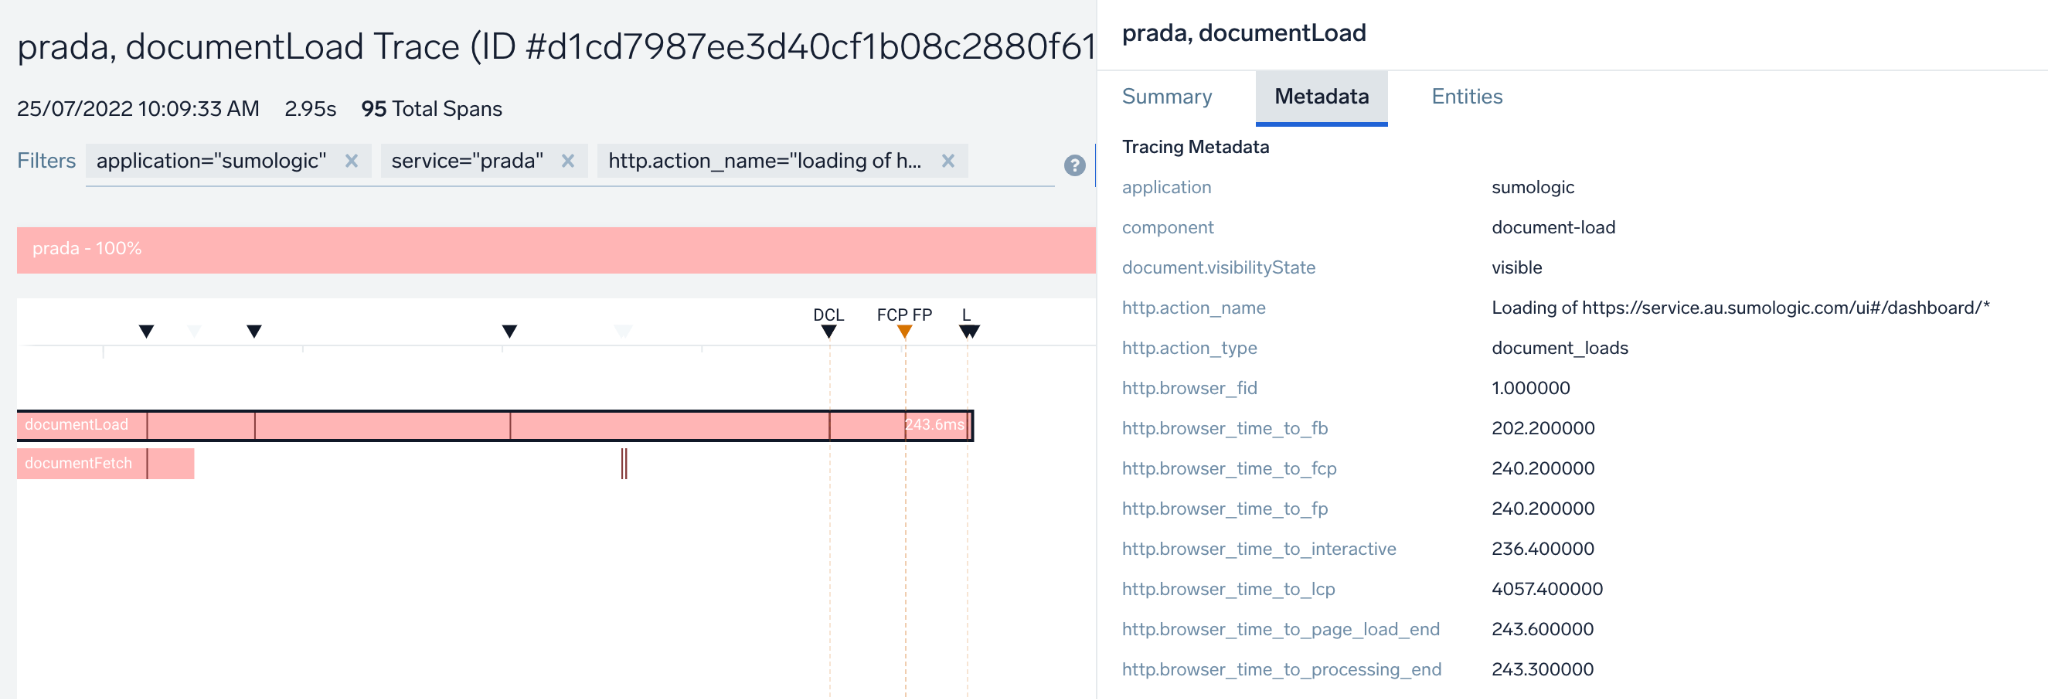
XHR Monitoring Metrics
An XML HTTP Request (XHR) is a form of communication between the browser and the application backend without (re)loading of the page. A typical example is where a page needs to update a ticker of a price automatically or after pressing the “update price” button next to it.
XHR technique is quite often used in single-page apps — apps that load the page once and then provide all interaction and navigation without loading more documents. Pages can generate one or more XHR requests, typically in the form of HTTP POSTs/GETs, related to various user actions on a page. Sumo Logic provides following monitoring coverage for XHR interactions:
Pages can generate one or more XHR requests, typically in the form of HTTP Posts, related to various user actions on a page. What we do with this, is:
Measure the following performance timings:
Name Calculation browser_time_to_first_xhrtime from UI interaction until first HTTP POSTappearsbrowser_time_to_last_xhrtime from UI interaction until last HTTP POSTends)browser_time_to_xhr_processing_endtime from UI interaction until all browser-side processing of all XHR requests is done browser_time_in_xhr_callstotal time when the transaction was “busy” with executing XHR communication Measure how many XHR requests have been generated
Identify the user action that triggered the XHRs by blending UI interaction (e.g.,
“click on Pay”) with the page name (e.g.,http://www.acme.com/checkout) results in following action name"Click on Pay on http://www.acme.com/checkout"Measure any erroneous HTTP response to XHR POST calls and count them as XHR errors
Allow to drill-down via EI to specific traces that explain full process of loading and execution of each such transaction
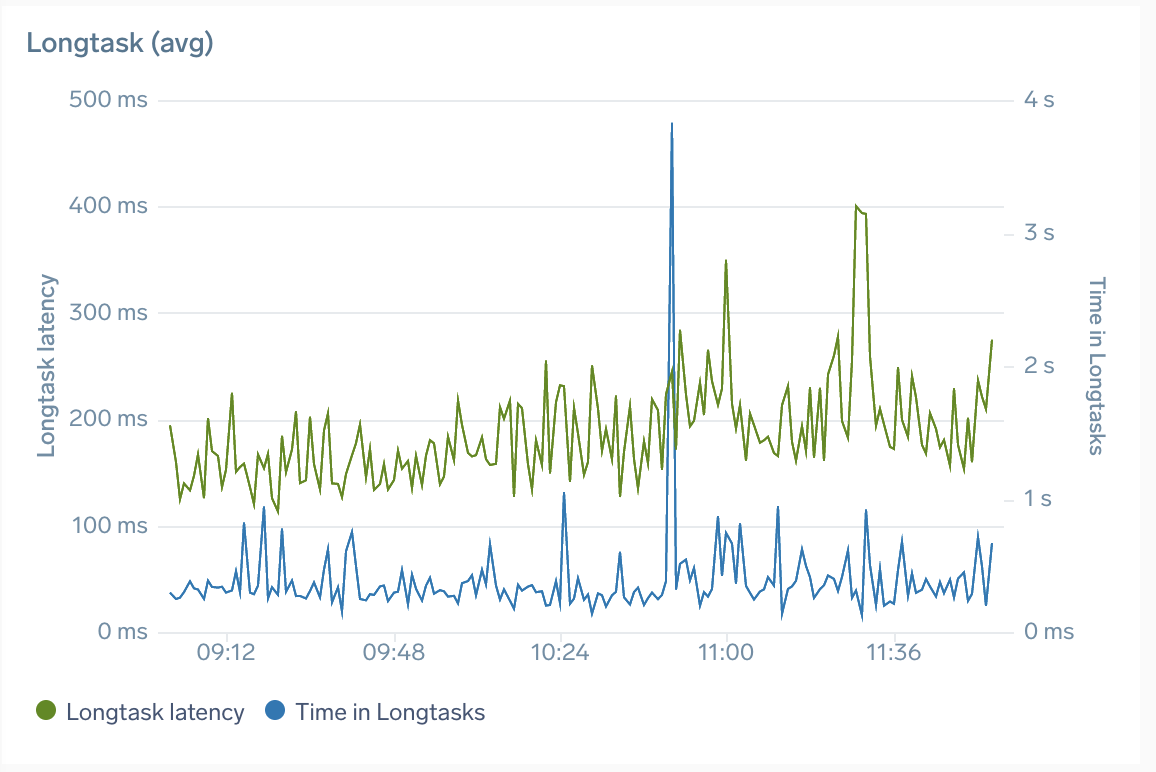
Longtask Delay Metrics
This section describes how to trace and measure Longtask delays, which is when the main browser UI thread becomes locked for extended periods (greater than 50 milliseconds) and blocks other critical tasks (including user input) from being executed.
This impacts the user's experience. They can perceive this as a "frozen browser”, even if the communication with the backend has long been completed. RUM automatically captures such events and:
- Displays them as individual spans marking how long the browser was frozen
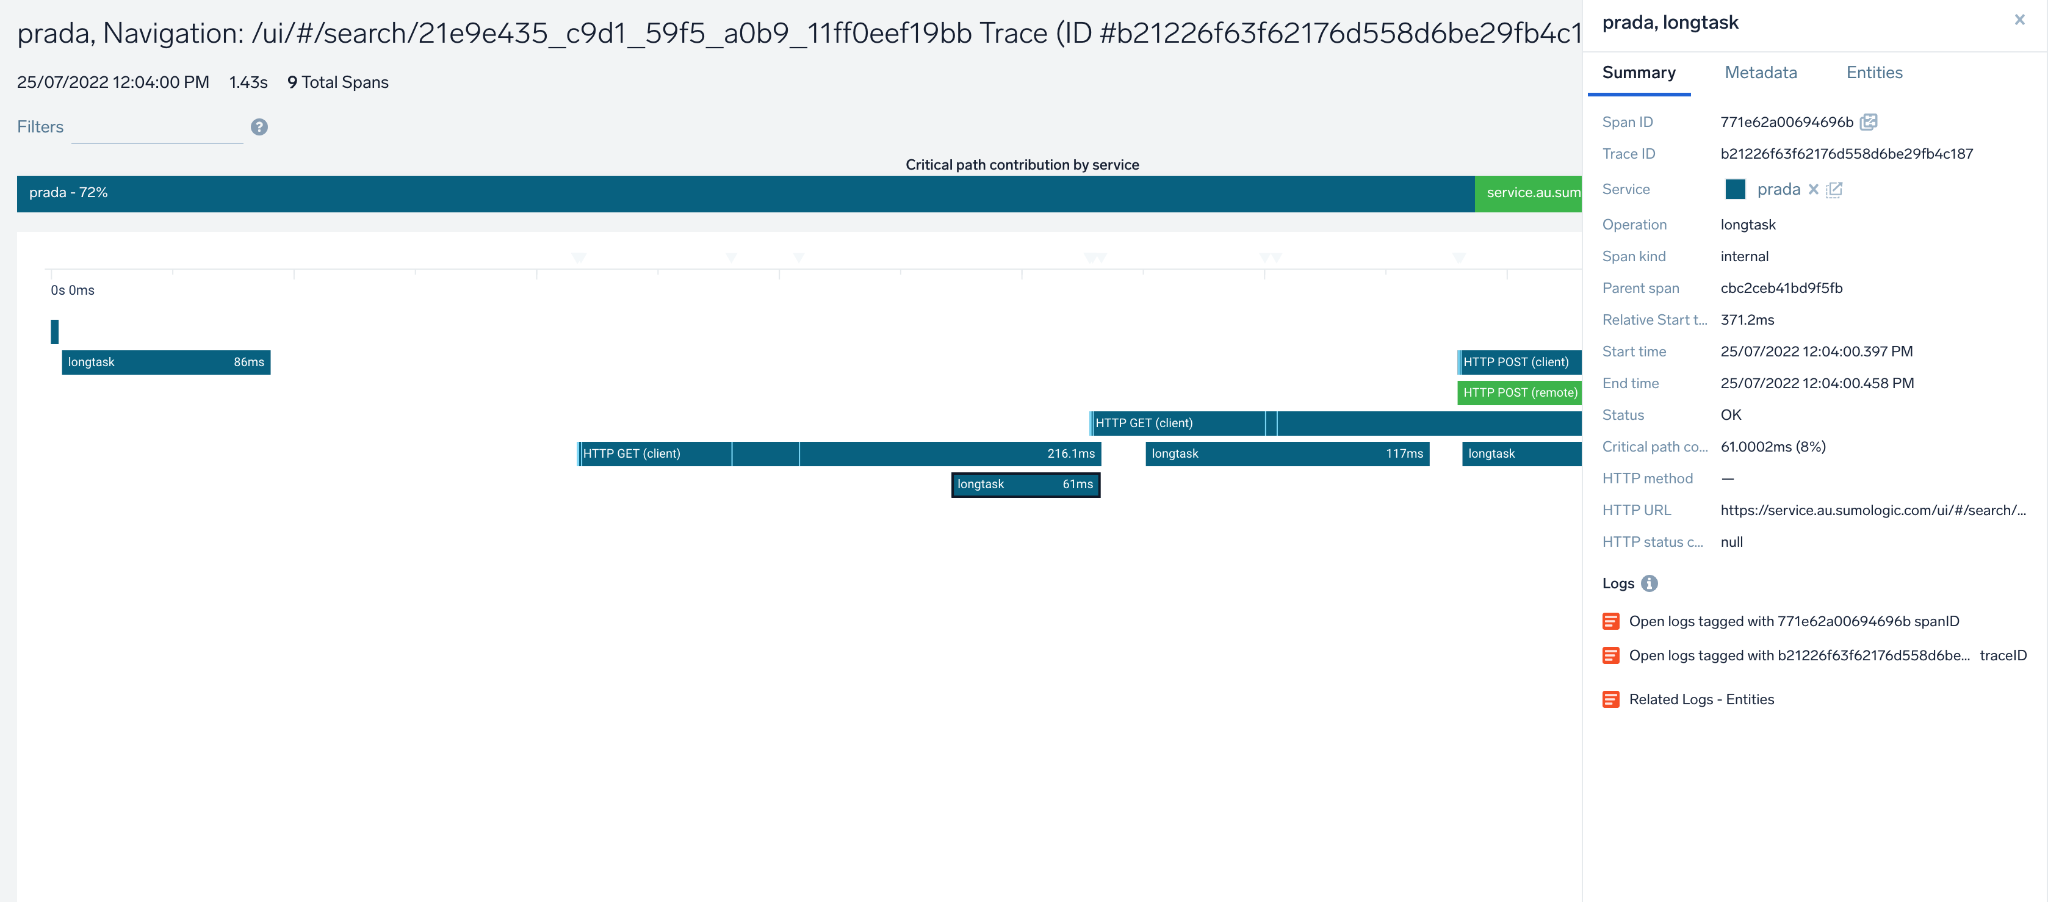
- Aggregates the above data into two metrics:
- Longtask delay: average duration of longtask span
- Time in longtasks: total time spent in longtasks per user action/trace
Installing the RUM App
No action is required. The RUM app is installed automatically for all users of your organization once Sumo Logic detects data coming from user browsers.
The content then populates in Sumo Logic RUM - default dashboards (inside the Admin Recommended folder), where it's available for all users in your organization. Do not modify or delete content in this folder, as it's automatically maintained and updated.
If for any reason the app gets removed, you can install it manually (click to expand).
- Go to the App Catalog, then search for and select the Real User Monitoring app.
- Click Add to Library.
- Provide an App Name. You can retain the existing name or enter a name of your choice for the app.
- Advanced. Select the Location in Library (the default is the Personal folder in the library), or click New Folder to add a new folder.
- Click Add to Library.
- Once the app is installed, it will appear in your Personal folder or the folder you specified. From here, you can share it with your organization.
Using Explore View
Once you've installed the RUM app, use our Explore view to gain visibility into your web app's performance and end-user activity such as geographic location, browser type, operating systems used. These dashboards visualize RUM metrics gathered from browser tracing instrumentation.
Explore organizes RUM data on four levels:
- Application: corresponds to the value of the application tag set in your RUM JavaScript script above. This should correspond to your whole website defined by its business function, such as "Coffee shop".
- Service: corresponds to the name of the service in your RUM JavaScript script above. This should correspond to a JS code executed in the browser, such as "coffee-shop-web". You can have multiple services for each application.
- Action Type: can be one of:
- document loads: representing loading of actual documents and their resources into the browser
- XHR actions: representing any interaction with a page like click or submit that executes AJAX requests in the background to communicate with the backend, or
- route changes: single-page-app specific way to navigate to a new page/view without having to load a new document.
- Action Name: automatically generated from URLs. No configuration is required. The specifics of it will depend on action type.
Action names can contain asterisks (*) to replace automatically-detected dynamic parts of the URL. If you have action names that overlap, the action name with an asterisk contains data for page loads NOT contained in more specific action names:
For example, http://www.site.com/path/page.htm does not contain actions from http://www.site.com/path/*.
There are three dashboard types on the Application and Service level and a single one on the Action type and Action level. You can select the appropriate dashboard from drop-down menu in the header: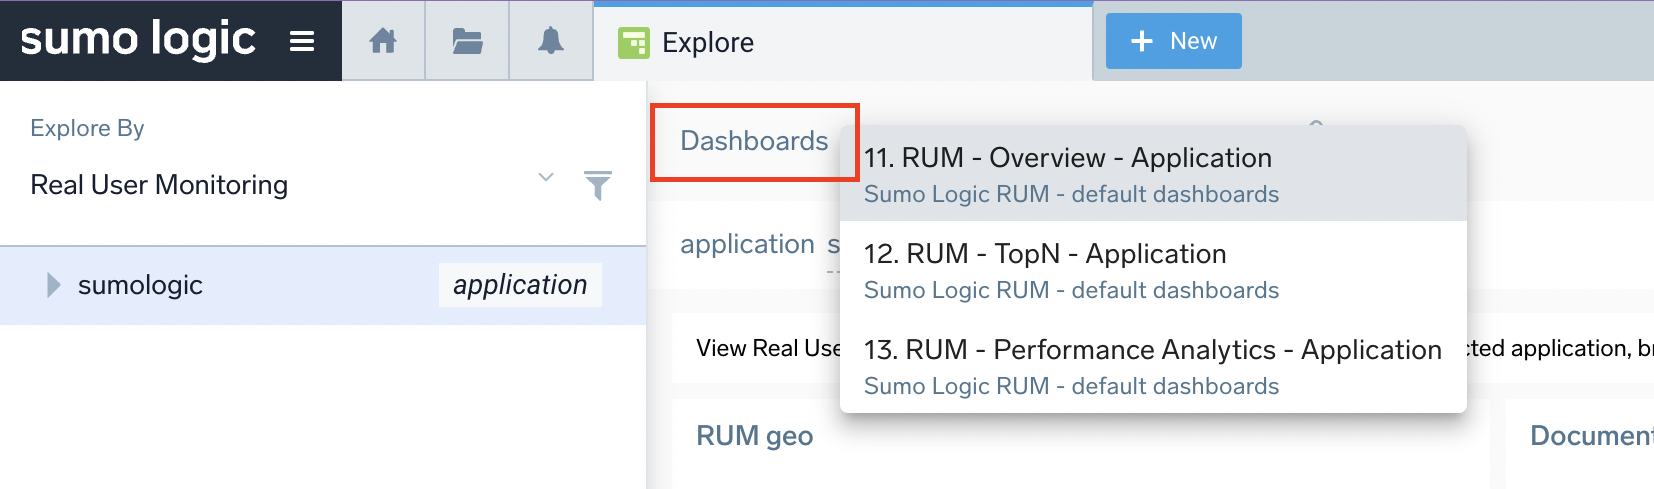
Viewing RUM Dashboards
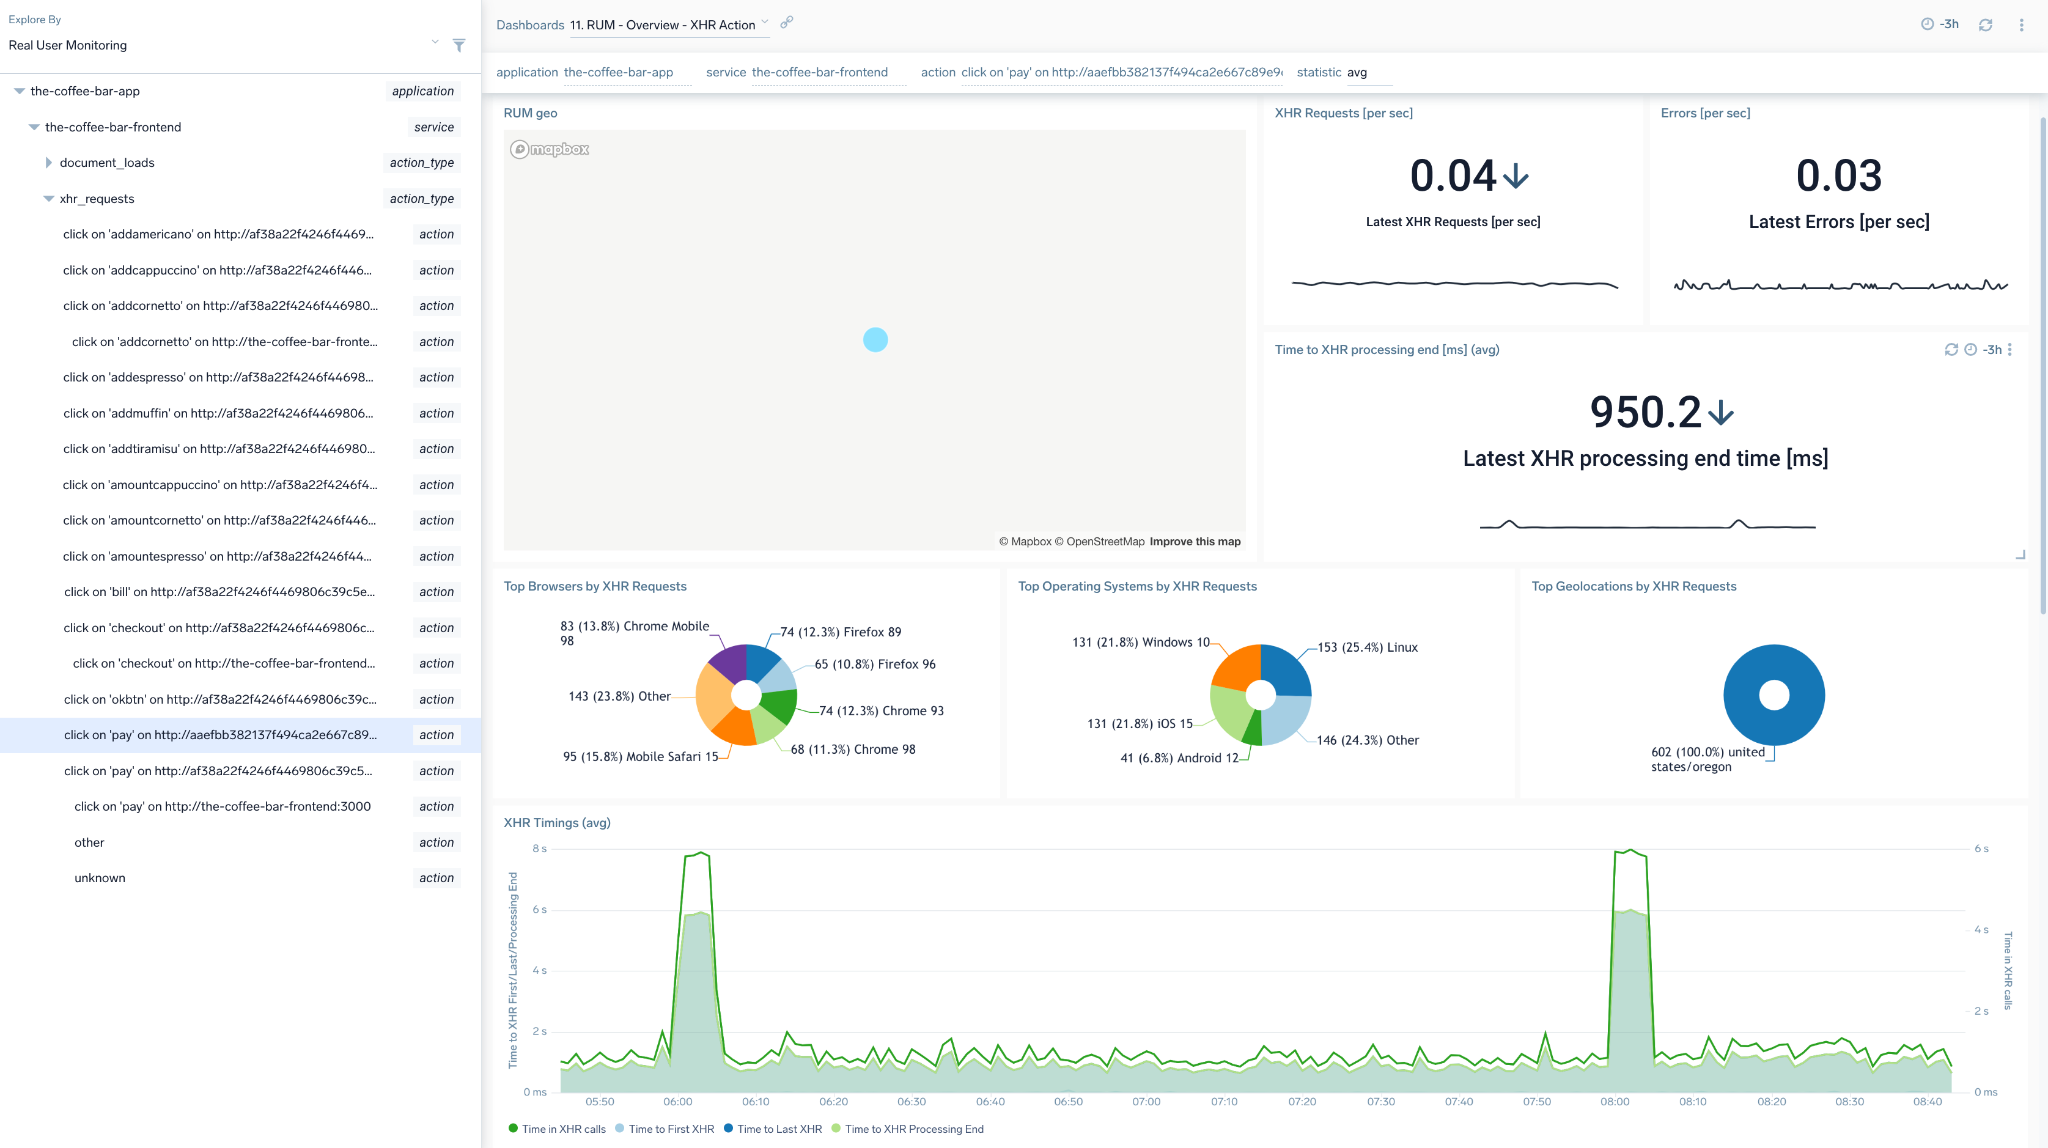
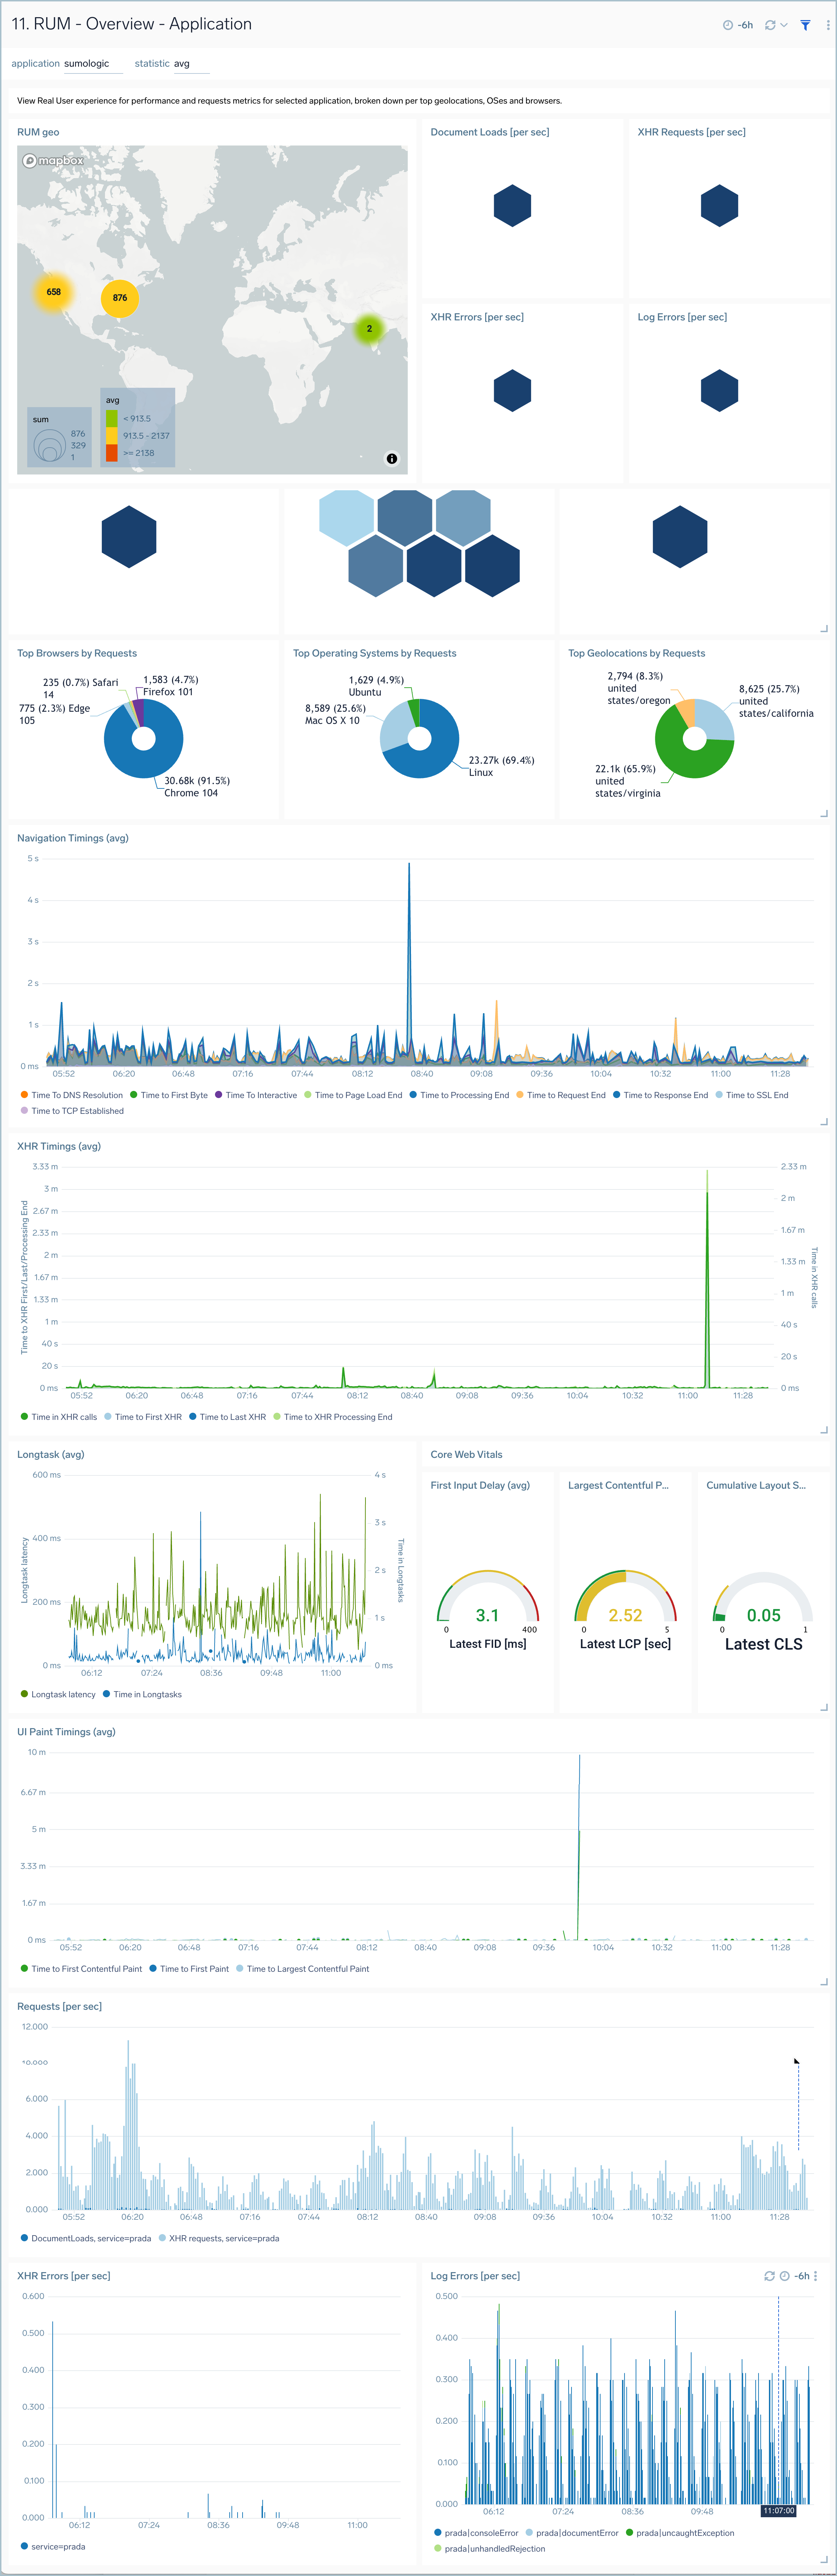
RUM Overview Application/Service/Action Type/Action
The RUM Overview Application, Service, Action Type, and Action dashboards dashboards show the user experience for performance and requests metrics for selected application, service, or action, broken down per top geo-locations, operating systems, and browsers.
Use these dashboards to:
- Analyze load and paint timings for page document loads by application, service, or action.
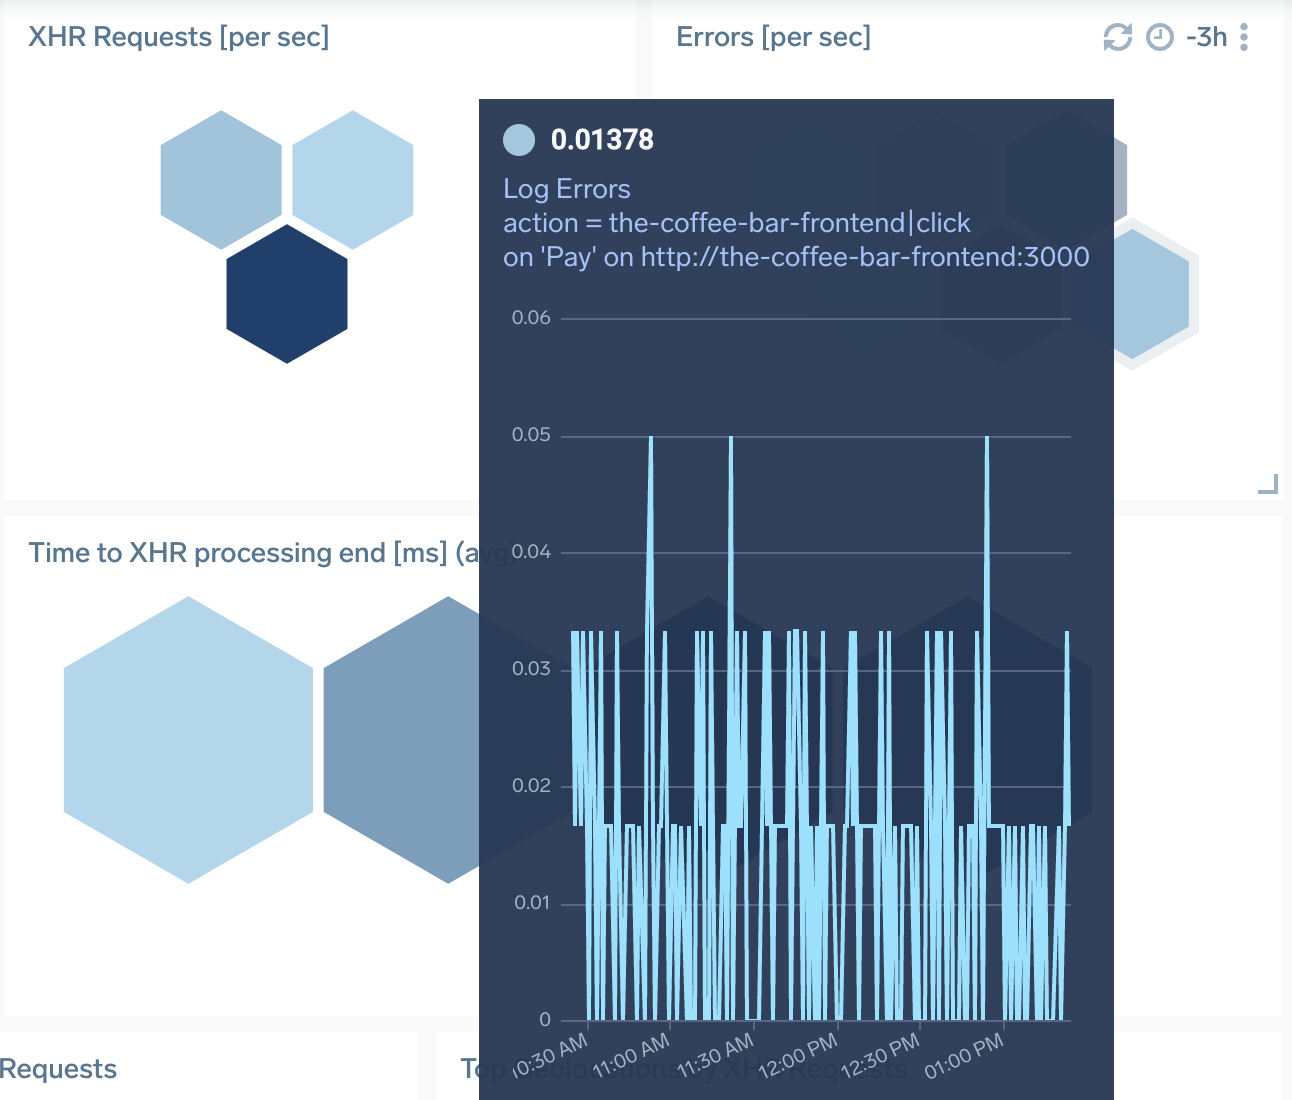
- View information about core web vitals, XHR processing times/errors, and log errors.
- Understand what top browsers, operating systems, and geolocations are active with your website.
You can select the timing metric type in the statistic dropdown on the dashboard header. This will change the browser time metrics types on charts.
You can also click on any data-point on the charts to open a details panel and view the Infrastructure tab to drill down to traces representing user transactions from the selected time point.
Overview dashboards on all Explore levels have a panel showing geographical user activity for the selected entity. Geographic dashboards do not measure performance.
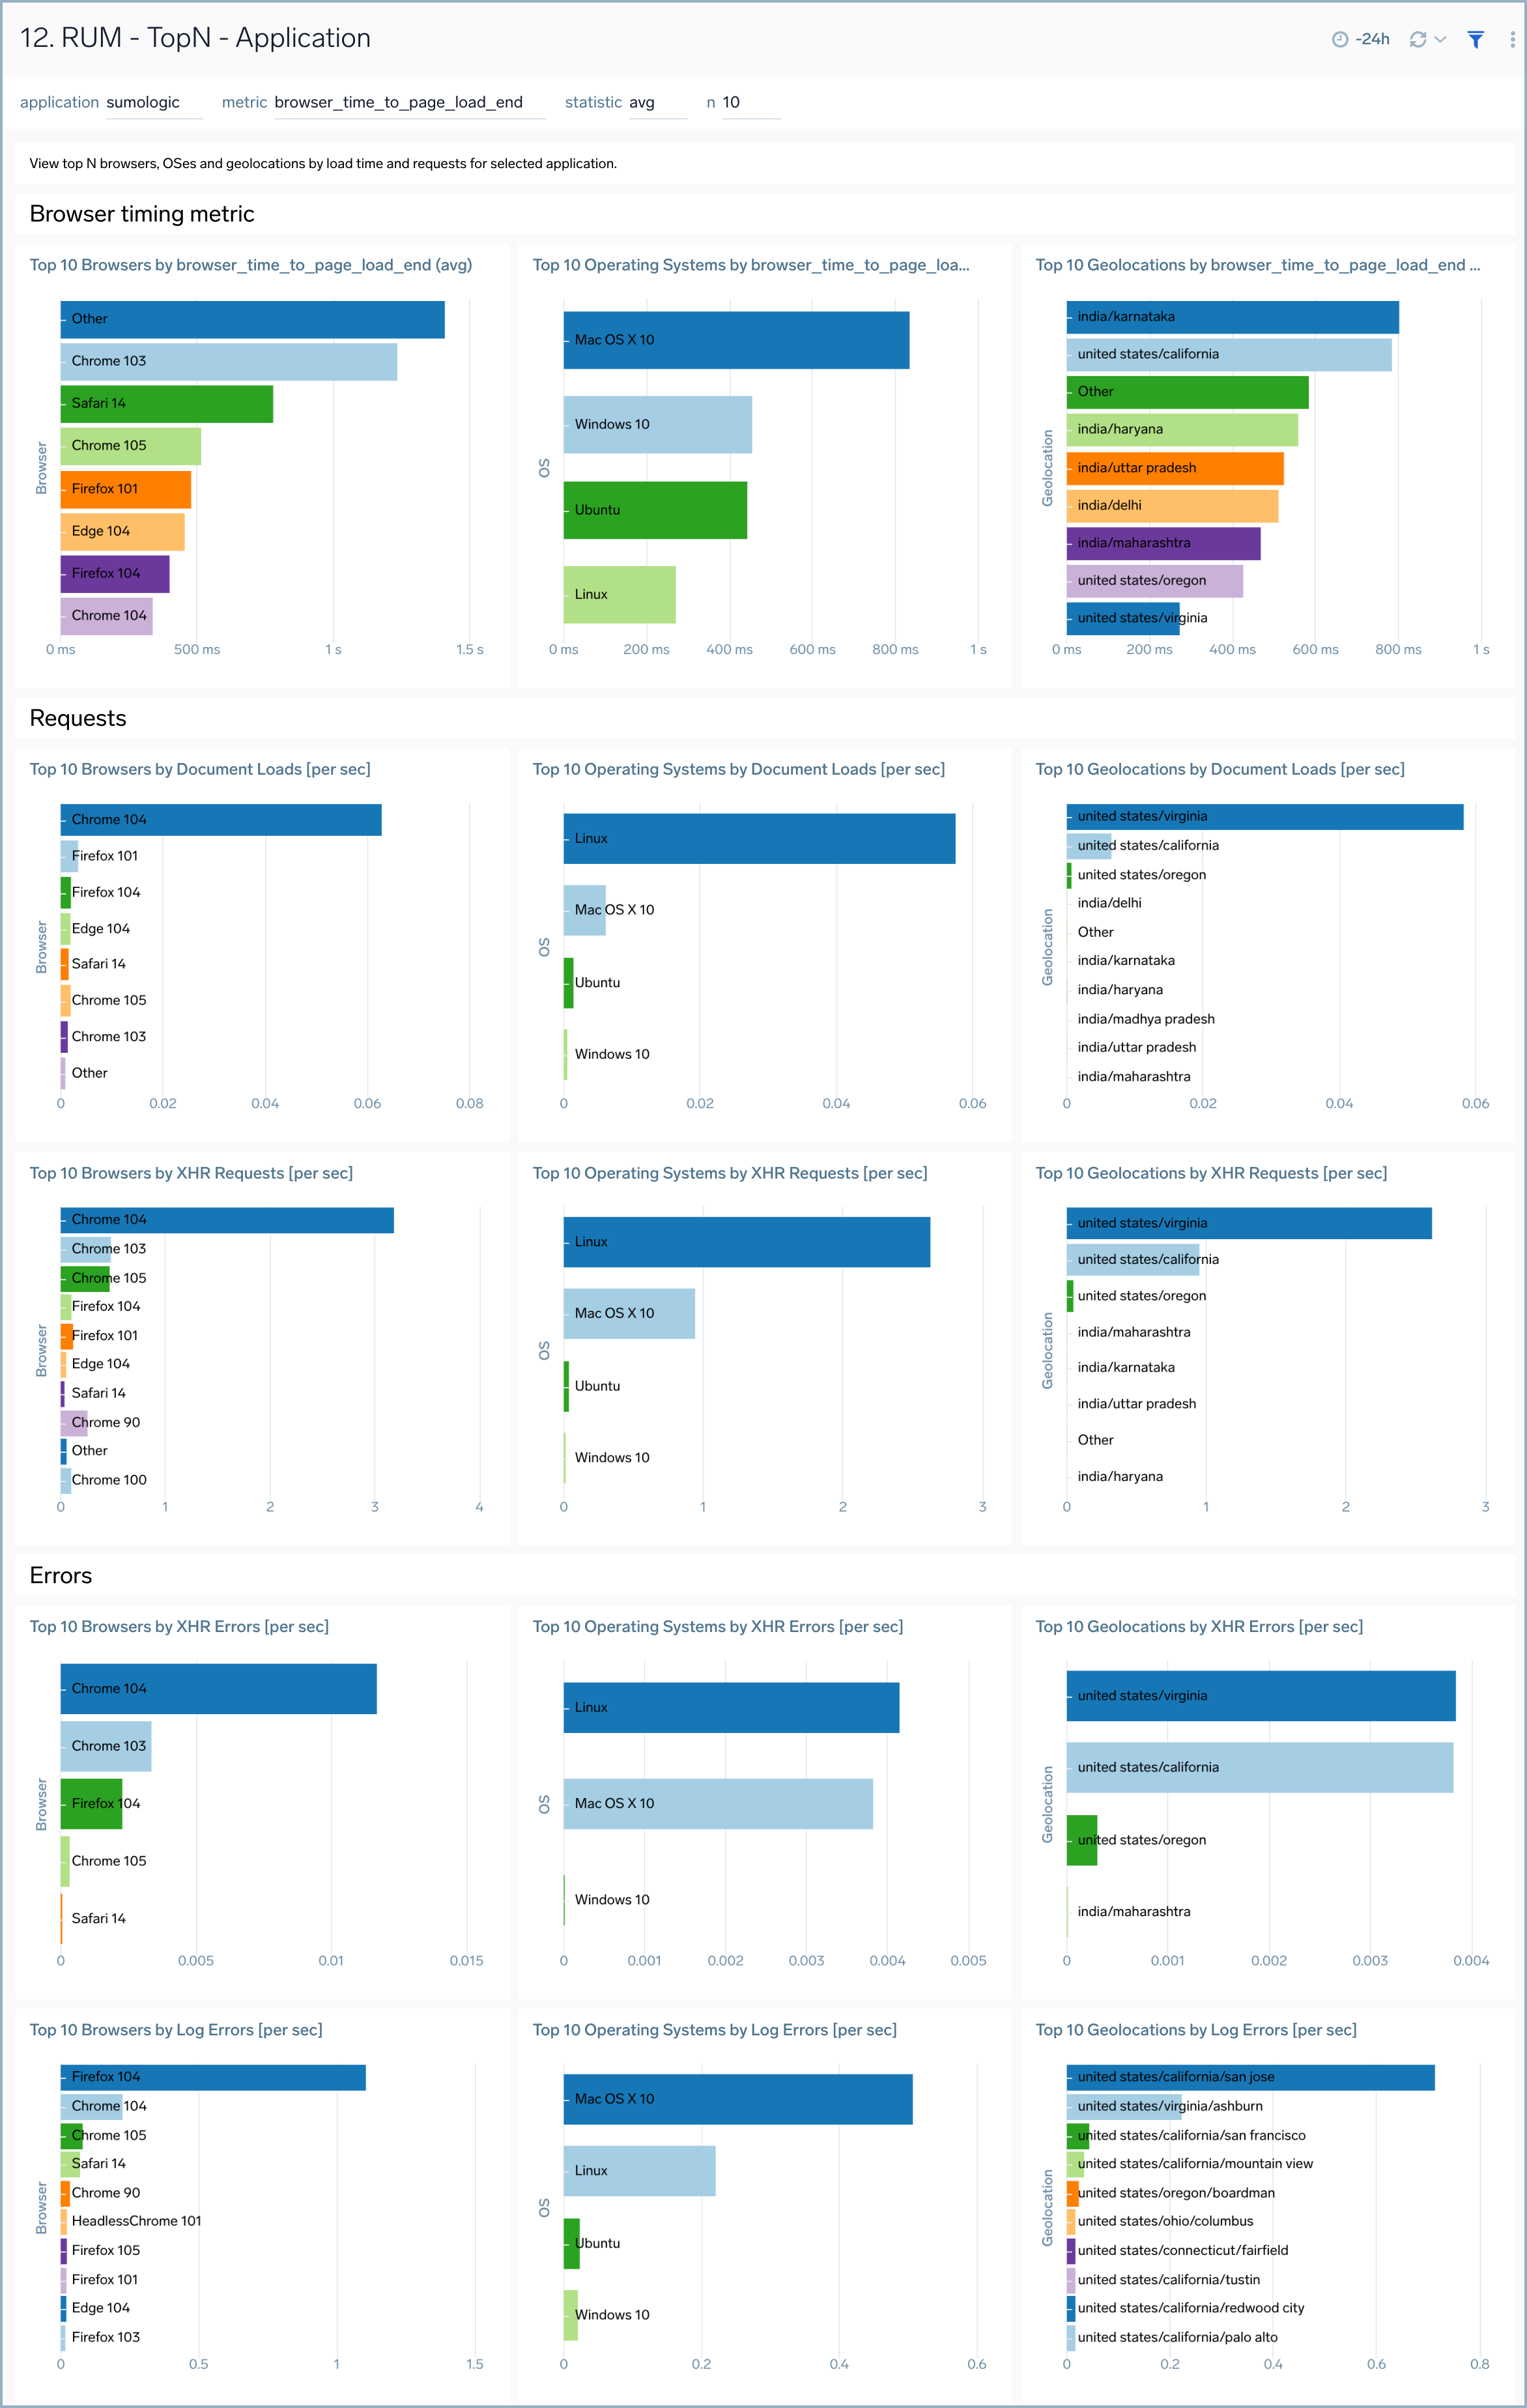
RUM TopN Application/Service
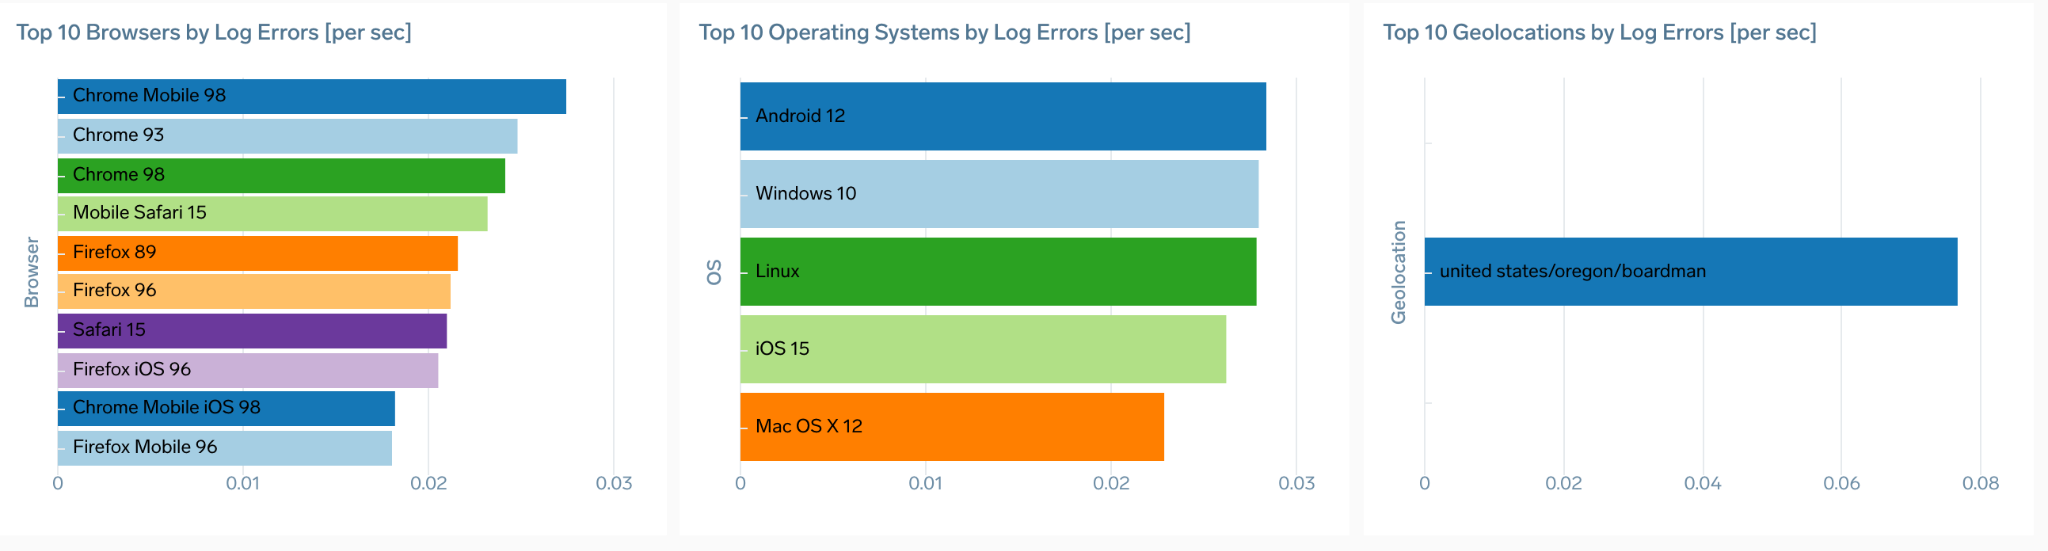
The RUM - TopN - Application and RUM - TopN - Application Service dashboards show top N browsers, operating systems, and geographical locations by load time and requests for the selected application or service.
Use this dashboard to:
- Find out top N browsers, operating systems, and geolocations by load or requests.
- Understand the slowest and fastest browsers from a rendering perspective or geographical locations from a network perspective.
- Understand XHR and log errors your users are experiencing.
- Find out which browsers, operating systems are in use by your users and where are they are geographically located.
You can select the timing metric type in the statistic dropdown on the dashboard header. This will change the browser time metrics types on charts. You can also define the top N number for all charts.
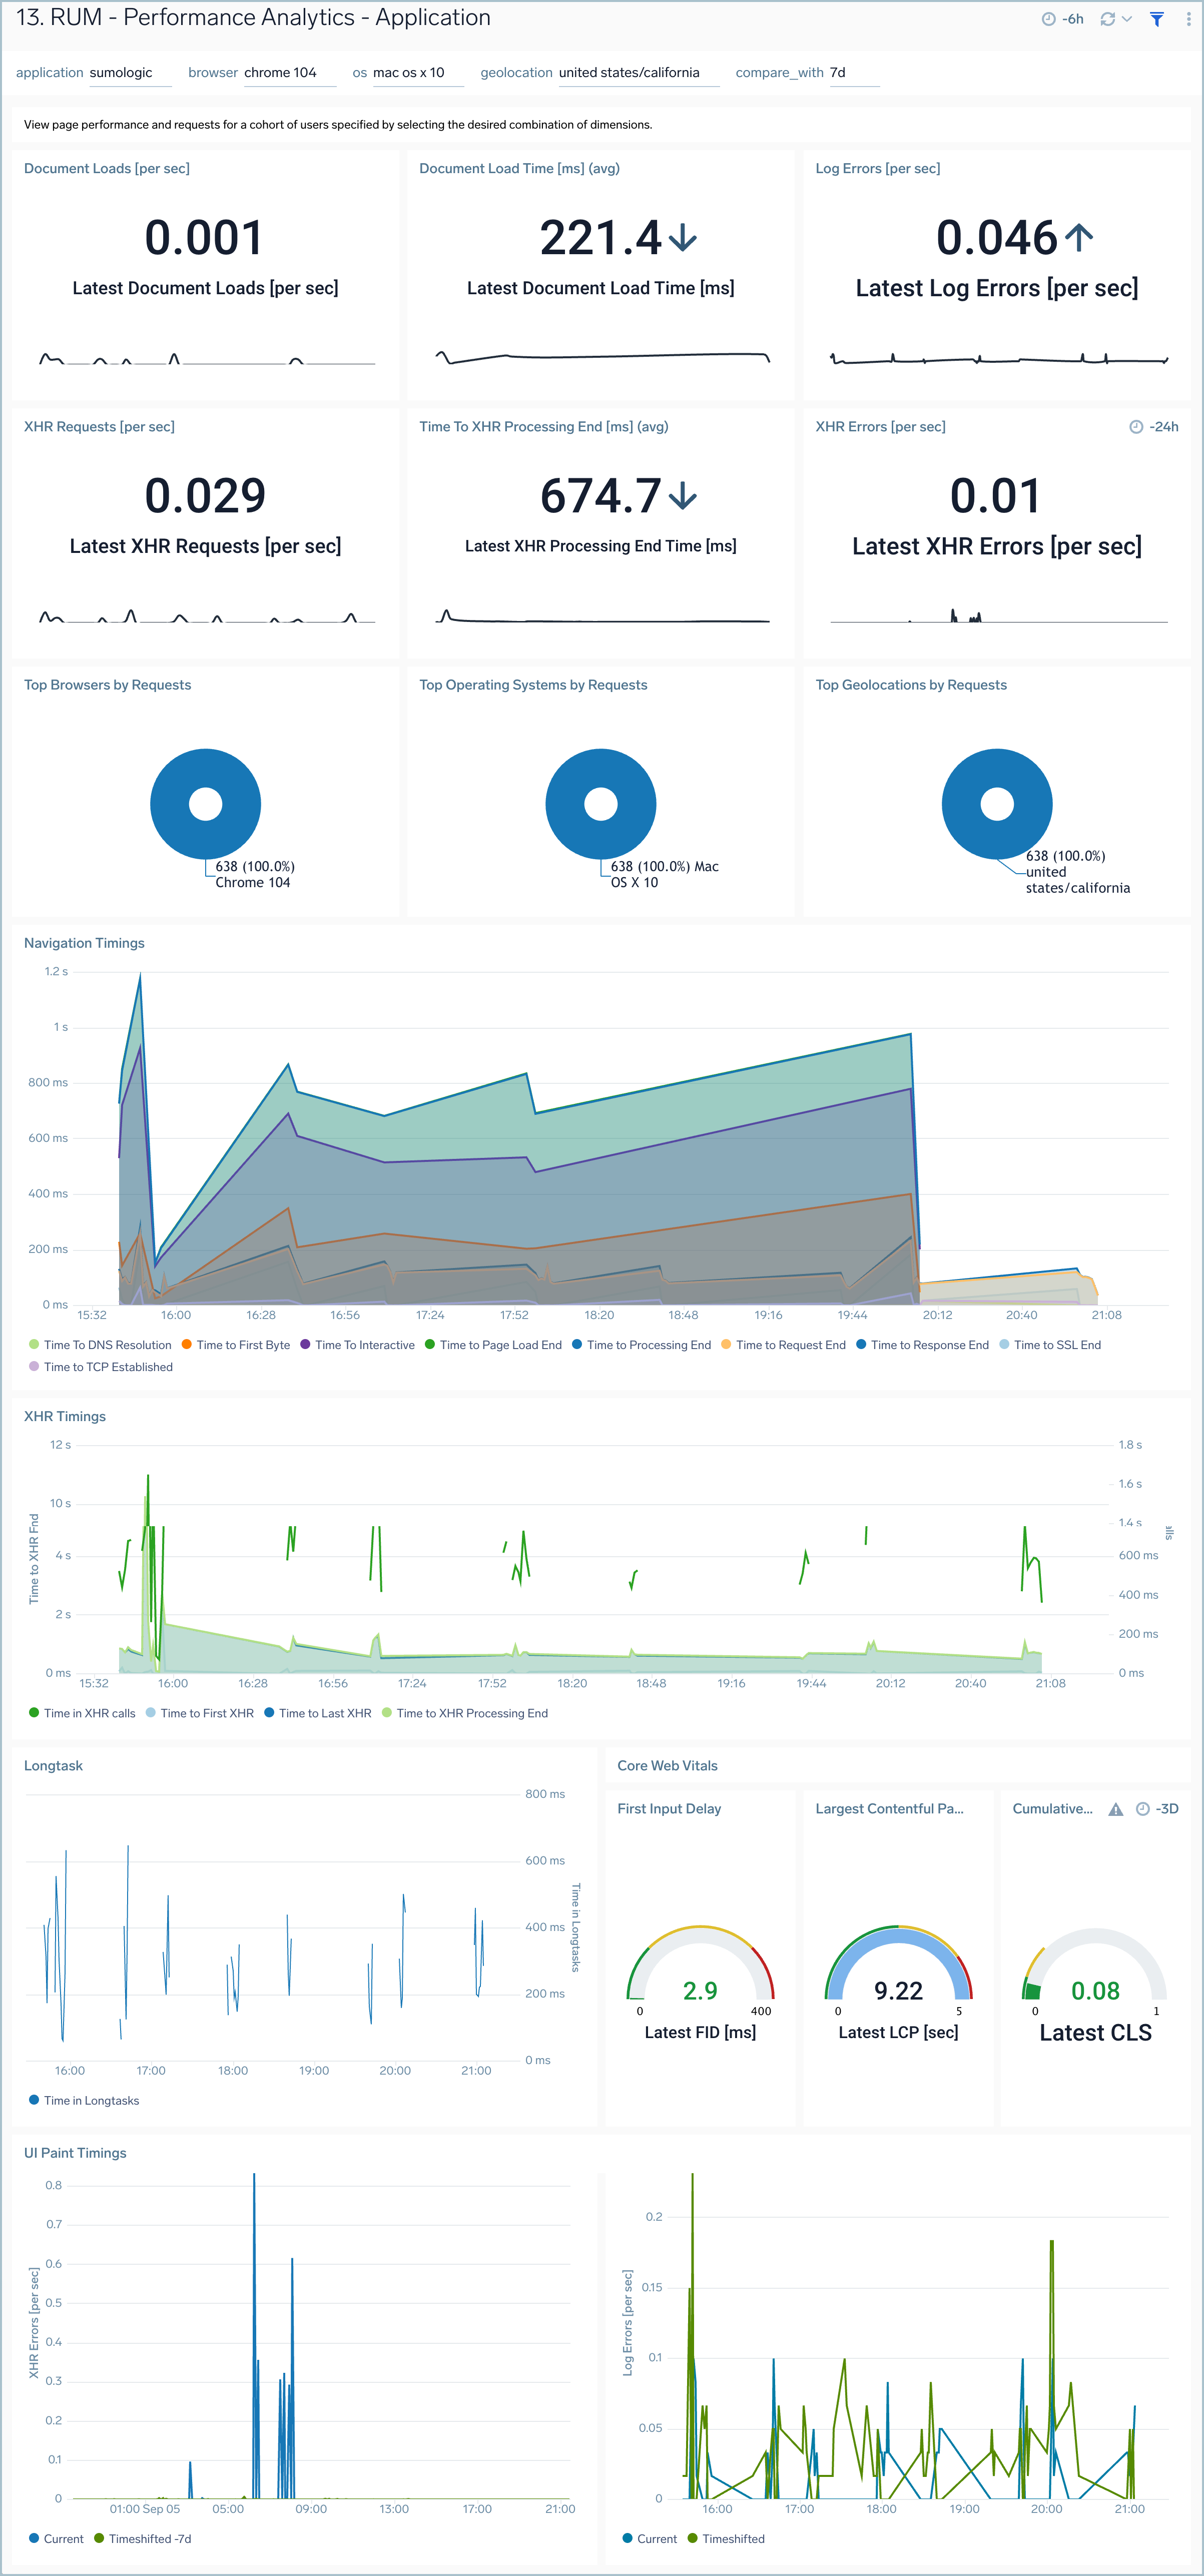
RUM Performance Analytics Application/Service
The RUM Performance Analytics Application and Service dashboards show the page performance and requests for a cohort of users specified by selecting the desired combination of dimensions.
Use this dashboard to:
- Filter data for specific combinations of application, browser, operating system, and/or geolocation.
- Understand XHR, load, timing metrics for the selected user cohort.
- Compare your selected timings against data for a different time period by selecting the appropriate option in the compare_with drop-down.
You can click on any data point on the charts to open a details panel and view the Infrastructure tab to drill-down to traces representing user transactions from the selected time point. For cross-dimensional metrics, only the average statistic type is available.
Collecting Browser Errors
Sometimes browser UI breaks in an unhandled way, failing to deliver the transaction and degrading user experience. That can happen in situations of unhandled errors or rejections, or failed resources. Also, developers can design the page to write erroneous messages to the console.
All of these situations are captured by Sumo Logic RUM browser instrumentation and forwarded to the same RUM source that is configured for traces data, that then forwards log data to sumologic_rum_errors log view. Aggregates from this view are also available on RUM dashboards in "Log errors" panels.
This way, you can have full visibility into the flow and categories of errors generated by various parts of your browser applications with contextual drill-down, free-form search and ability to build custom dashboards, which gives you the ability to shorten the troubleshooting time and pro-activeness in error tracing.
Browser error logs, although collected via RUM script, contribute to your log Continuous Tier quota and credit consumption.
Working with Browser Errors data
Data in the index is query-able using normal log search query. Here’s a sample query and results:
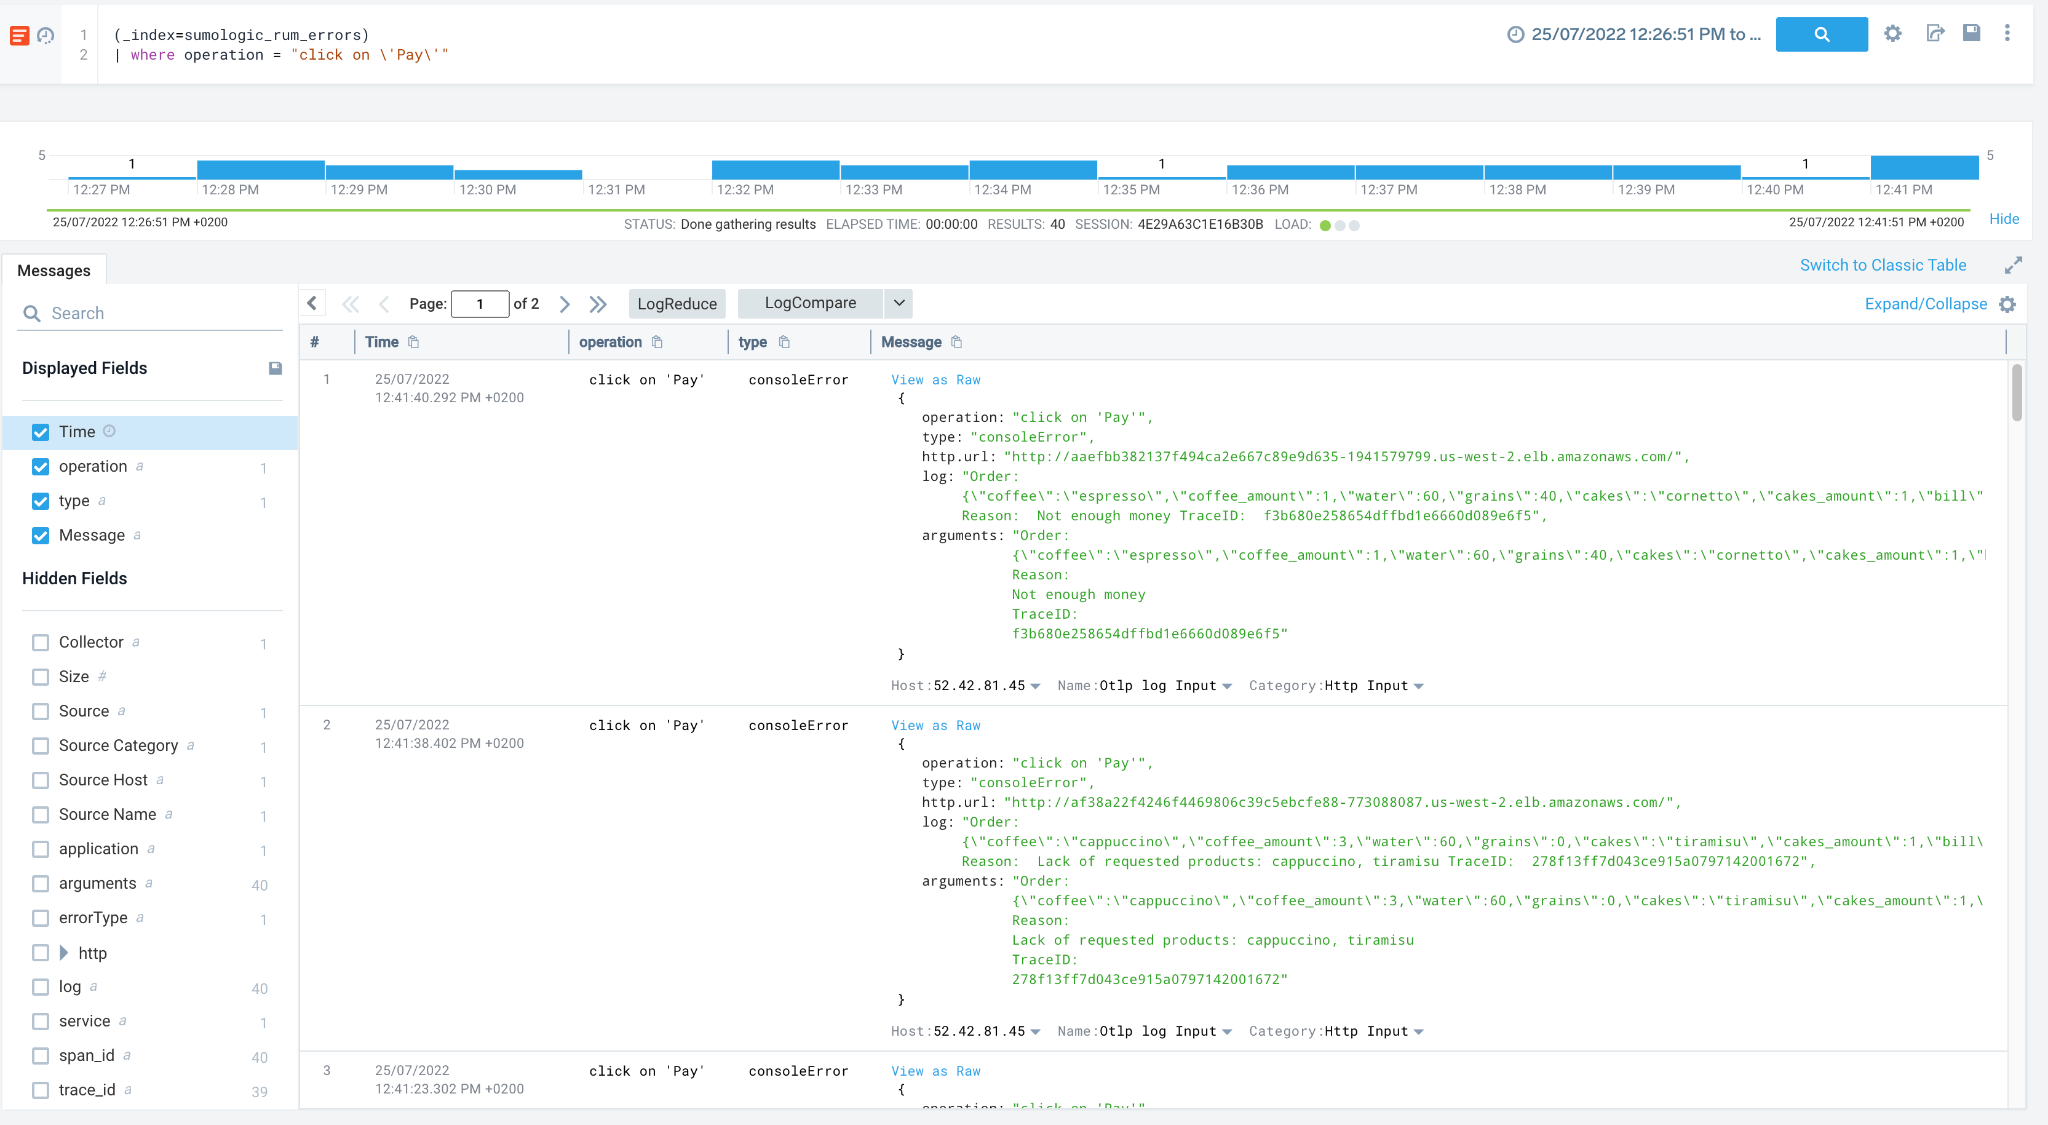
The following fields are available to better aggregate and filter your results:
- Application
- Service
- Operation
- Action name and type
- Url
- ErrorType
- Geolocation data
- User agent
- Span and Trace ids
Because errors don't always have to be connected with user actions, it is ok to leave some of these fields empty.
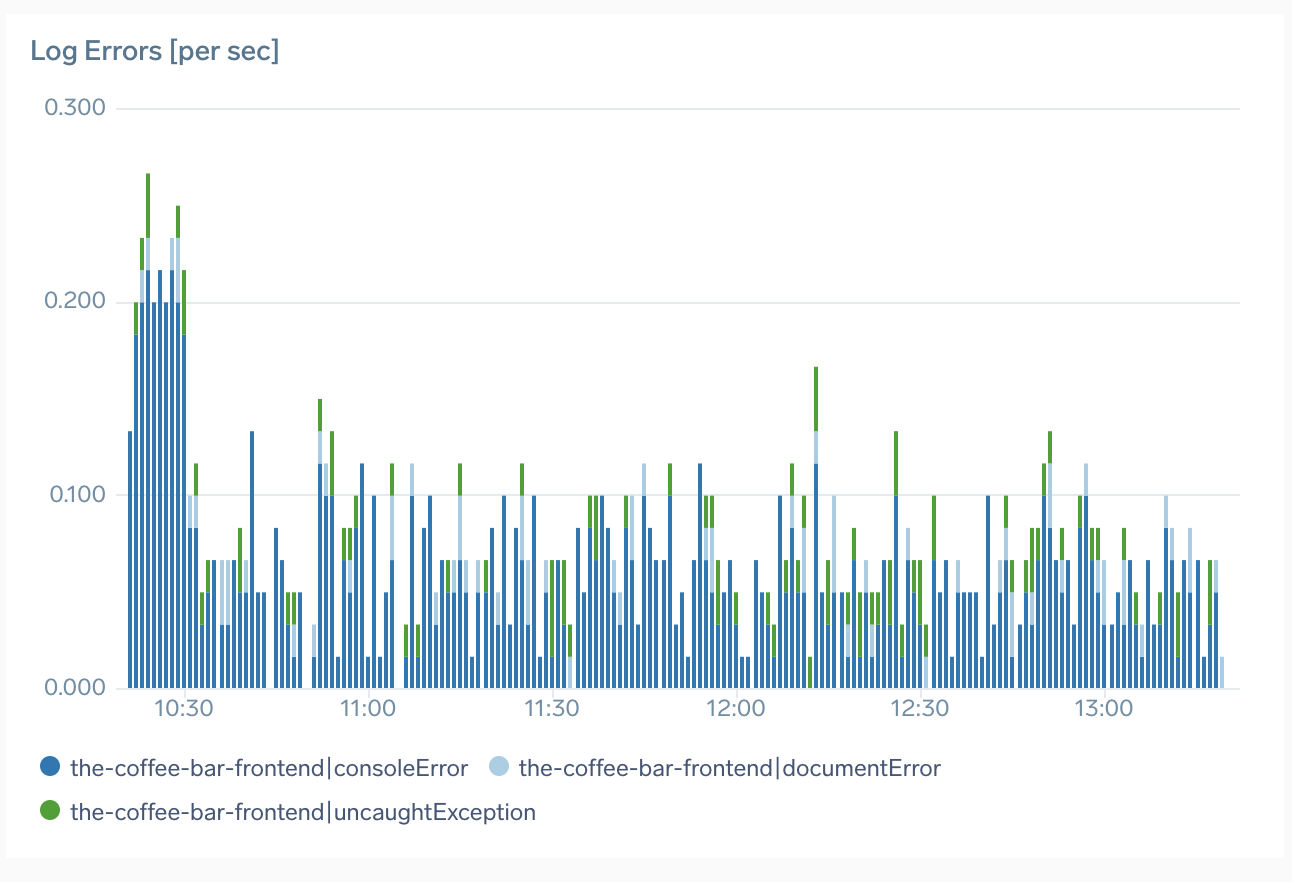
In addition to that, we also aggregate that information in form of log-query based panels and display on various dashboards:
Logs collection is enabled by default. You can disable by setting collectErrors=false in your RUM script options.