Set up Traces Collection for AWS Environments
To collect traces in non-Kubernetes AWS environments like EC2 or ECS (including Fargate), you can install an OpenTelemetry Collector from the AWS Distro for OpenTelemetry. This specific AWS OpenTelemetry Collector distribution is secure and officially supported by AWS. Collecting telemetry data and sending it to Sumo Logic, the official partner and contributor to the project, has never been easier.
Prerequisites
- An endpoint URL from an existing or new HTTP Traces Source.
- An installed and configured AWS Command Line Interface tool.
| Account Type | Account Level |
| Credits | Enterprise Operations and Enterprise Suite |
| Essentials get up to 5 GB a day |
Telemetry data collection
AWS provides a few alternative scenarios for setting up the Collector. Documentation related to the configuration and installation of the AWS OpenTelemetry Collector for specific AWS Services can be found below.
AWS OpenTelemetry Collector configuration scenarios
Amazon Elastic Container Service (ECS)
In the case of ECS, there are two possible deployment configurations. An AWS OpenTelemetry Collector can be installed on the cluster of EC2 instances (Scenario 1 below) or ran on AWS Fargate (Scenario 2 below).
AWS OpenTelemetry Collector in both scenarios is installed as a sidecar. The installation and configuration are just a few steps, described below.
Prerequisites
- ECS Cluster where the AWS OpenTelemetry Collector will be deployed. The guide can be found here.
Scenario 1: AWS OpenTelemetry Collector installation on ECS EC2
Download the CloudFormation template file which will be used later to install the Collector:
curl -O https://raw.githubusercontent.com/SumoLogic/opentelemetry-collector-contrib/main/examples/non-kubernetes/aws-otel-ecs-ec2-deployment.yamlDownload the AWS OpenTelemetry Collector configuration file:
curl -O https://raw.githubusercontent.com/SumoLogic/opentelemetry-collector-contrib/main/examples/non-kubernetes/aws-otel-config-file.yamlSet up the following environment variables that are needed to perform the AWS OpenTelemetry Collector deployment.
CLUSTER_NAME- your ECS Cluster name previously set up.AWS_REGION- your ECS Cluster deployment region.TEMPLATE_PATH- path to the template file from the first step.CONFIG_FILE_PATH- path to the config file from the second step.- SUMO_HTTP_TRACES_URL - mandatory Sumo HTTP Traces URL from prerequisites section.
It is necessary to provide the configuration to the AWS OpenTelemetry Collector. This can be done by creating the parameter in the AWS Parameter Store by running the following command:
aws ssm put-parameter --name "sumologic-otel-col-config" --type "String" --data-type "text" --value "$(cat ${CONFIG_FILE_PATH} | awk -v url=$SUMO_HTTP_TRACES_URL '{gsub(/SUMO_HTTP_TRACES_URL/,url)}1')"Execute the command below to create an AWS CloudFormation stack that deploys the AWS OpenTelemetry Collector on your cluster:
aws cloudformation create-stack --stack-name sumologic-aws-otel-col-ecs-ec2 --template-body file://${TEMPLATE_PATH} --parameters ParameterKey=ClusterName,ParameterValue=${CLUSTER_NAME} --capabilities=CAPABILITY_NAMED_IAM --region=${AWS_REGION}To check if everything was deployed go to the CloudFormation Stacks console and check if the sumologic-aws-otel-col-ecs-ec2 stack status is CREATE_COMPLETE.

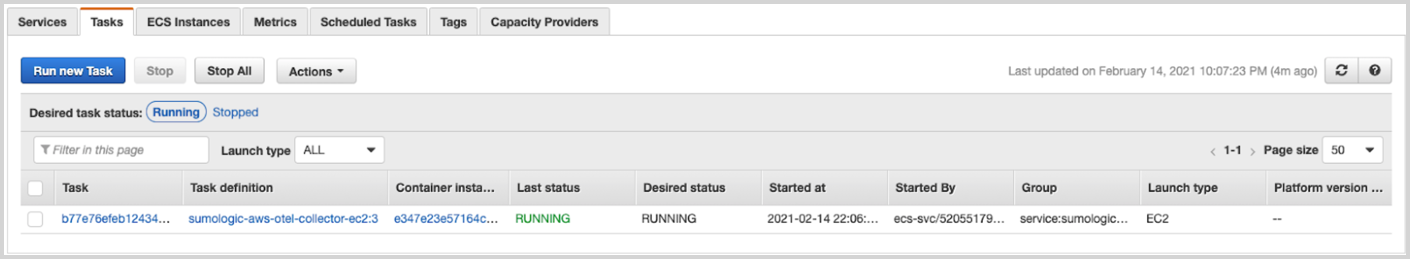
The next step is to check if your deployment is properly running. Go to the ECS Console, select the proper region, and select the cluster you used to deploy the AWS OpenTelemetry Collector. Navigate to the Tasks tab and check if the task is running.
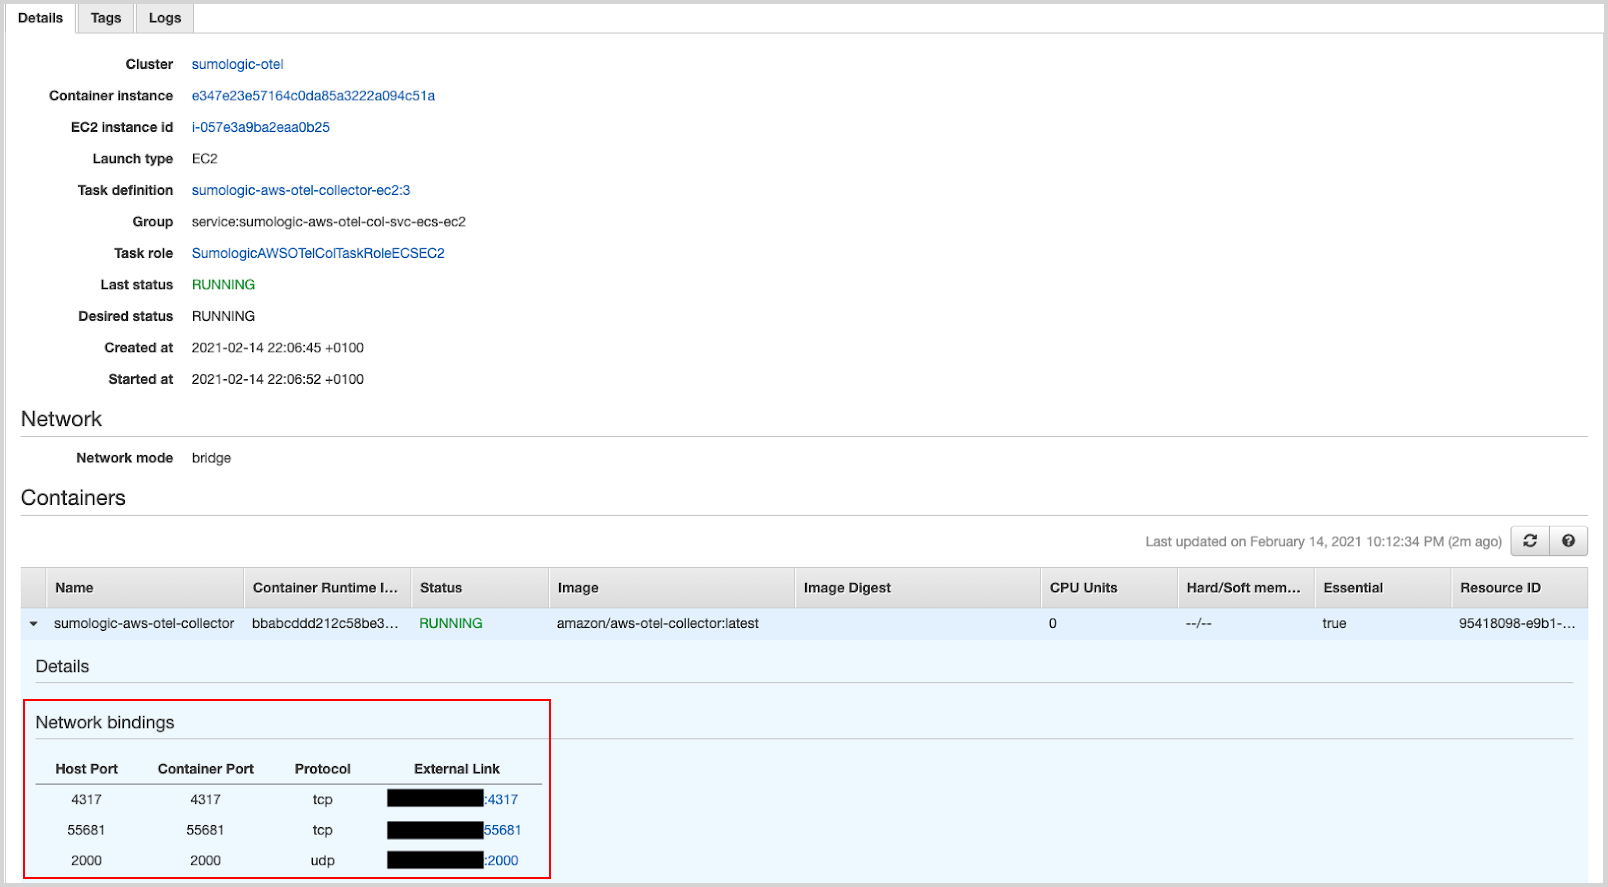
Finally, click on the task and expand the Containers list. In he Network Bindings > External Link section, you will find the information on where to send telemetry data.
Scenario 2: AWS OpenTelemetry Collector installation on ECS Fargate
Download the CloudFormation template file which will be used later to install the Collector:
curl -O https://raw.githubusercontent.com/SumoLogic/opentelemetry-collector-contrib/main/examples/non-kubernetes/aws-otel-ecs-fargate-deployment.yamlDownload the AWS OpenTelemetry Collector configuration file.
curl -O https://raw.githubusercontent.com/SumoLogic/opentelemetry-collector-contrib/main/examples/non-kubernetes/aws-otel-config-file.yamlSet up the following environment variables that are needed to perform the AWS OpenTelemetry Collector deployment:
CLUSTER_NAME- your ECS Cluster name setup from prerequisiteAWS_REGION- your ECS Cluster deployment regionTEMPLATE_PATH- path to the template file from the first stepCONFIG_FILE_PATH- path to the config file from the second stepSUMO_HTTP_TRACES_URL- mandatory Sumo HTTP Traces URLSECURITY_GROUPS- it is mandatory for AWS Fargate deployment to provide a Security Group ID. They can be found in the AWS Console. Find the one configured for the cluster. In the case of multiple Security Groups use comma as separator, such as,sg-xyz,sg-xyz.:::note The AWS OpenTelemetry Collector receives data from various receivers - these ports should be configured in the Security Group:
- AWSXRAY - port: 2000/udp
- OTLP - ports: 4317/tcp, 55681/tcp
- JAEGER - ports: 6831/udp, 6832/udp, 14250/tcp, 14268/tcp
- ZIPKIN - port: 9411/tcp :::
SUBNETS - same as Security Groups, Subnets have to be configured for AWS Fargate. To find Subnets used on the cluster, use the VPC ID from Security Group and search for it on the list here. In the case of multiple Subnets use a comma as a separator, such as,
subnet-xyz,subnet-xyz.
It is necessary to provide the configuration to the AWS OpenTelemetry Collector. This can be done by creating the parameter in the AWS Parameter Store by running the following command:
aws ssm put-parameter --name "sumologic-otel-col-config" --type "String" --data-type "text" --value "$(cat ${CONFIG_FILE_PATH} | awk -v url=$SUMO_HTTP_TRACES_URL '{gsub(/SUMO_HTTP_TRACES_URL/,url)}1')"Execute the command below to create an AWS CloudFormation stack that deploys the AWS OpenTelemetry Collector on your cluster:
aws cloudformation create-stack --stack-name sumologic-aws-otel-col-ecs-fargate --template-body file://${TEMPLATE_PATH} --parameters ParameterKey=ClusterName,ParameterValue=${CLUSTER_NAME} ParameterKey=SecurityGroups,ParameterValue=\"${SECURITY_GROUPS}\" ParameterKey=Subnets,ParameterValue=\"${SUBNETS}\" --capabilities=CAPABILITY_NAMED_IAM --region=${AWS_REGION}To check if everything was deployed go to the CloudFormation Stacks console and check if the sumologic-aws-otel-col-ecs-fargate stack status is CREATE_COMPLETE.

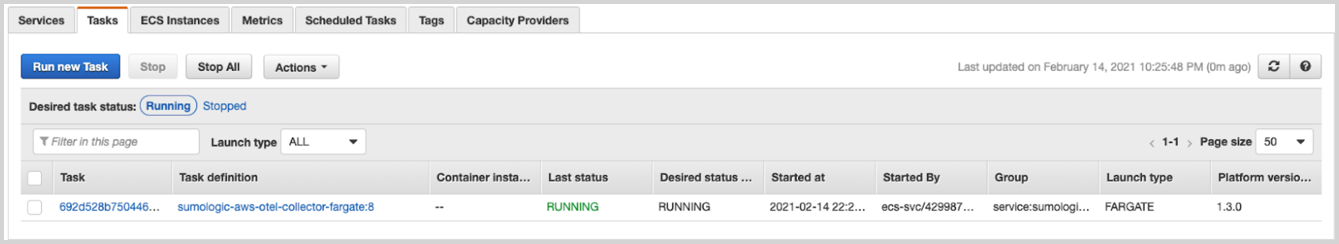
The next step is to check if your deployment is properly running. Go to the ECS Console, select the proper region, and select the cluster you used to deploy the AWS OpenTelemetry Collector. Navigate to the Tasks tab and check if the task is running.
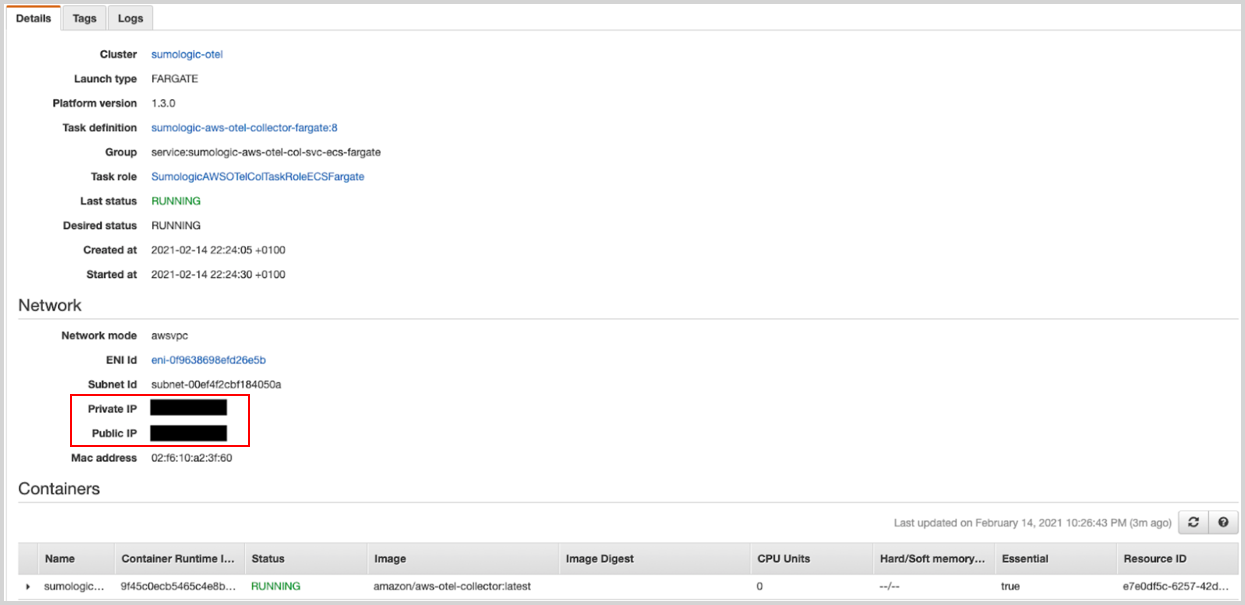
Finally, click on the task and expand the Containers list. In the Network > Private IP or Public IP sections, you will find the information on where to send telemetry data.
Amazon Elastic Computing (EC2)
Download the CloudFormation template file which will be used later to install the Collector on your EC2 instance.
curl -O https://raw.githubusercontent.com/SumoLogic/opentelemetry-collector-contrib/main/examples/non-kubernetes/aws-otel-ec2-deployment.yamlDownload the AWS OpenTelemetry Collector configuration file:
curl -O https://raw.githubusercontent.com/SumoLogic/opentelemetry-collector-contrib/main/examples/non-kubernetes/aws-otel-config-file.yaml
Set up the following environment variables that are needed to perform the AWS OpenTelemetry Collector deployment.
AWS_REGION- your ECS Cluster deployment regionTEMPLATE_PATH- path to the template file from the first stepSUMO_HTTP_TRACES_URL- mandatory Sumo Logic HTTP Traces URLSSH_KEY_NAME- Amazon EC2 key pair needed to ssh to the EC2 instanceAMI_ID- an Amazon image ID, depends on the region. To obtain it go to EC2 Launch Instances and get AMI ID for Amazon Linux 2 AMI image, such as,ami-0a6dc7529cd559185. Note that the AMI ID depends on the region.
Execute the command below to create the AWS CloudFormation stack that will create an EC2 instance and install it on the AWS OpenTelemetry Collector:
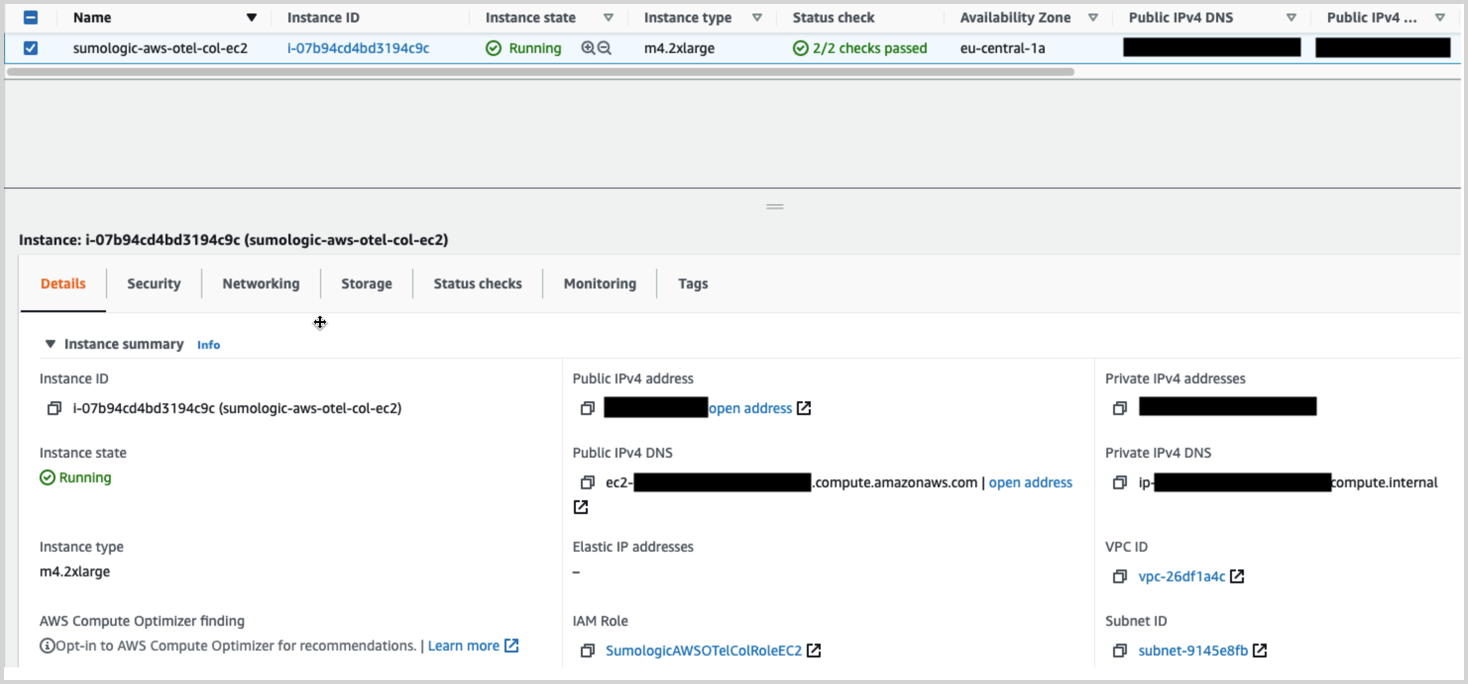
aws cloudformation create-stack --stack-name sumologic-aws-otel-col-ec2 --template-body file://${TEMPLATE_PATH} --parameters ParameterKey=SumoHttpTracesURL,ParameterValue=${SUMO_HTTP_TRACES_URL} ParameterKey=SSHKeyName,ParameterValue=${SSH_KEY_NAME} ParameterKey=InstanceAMI,ParameterValue=${AMI_ID} --capabilities=CAPABILITY_NAMED_IAM --region=${AWS_REGION}To check if everything was deployed go to CloudFormation Stacks console and check if sumologic-aws-otel-ec2 stack status is CREATE_COMPLETE. Deploying and configuring an EC2 instance can take even a few minutes.

Go to EC2 Instances, select the proper region and check if the EC2 instance is running. Use public or private IP addresses as exporters endpoints.
AWS OpenTelemetry Collector installation on EKS
In the case of the Amazon EKS service Sumo Logic highly recommends using our native Sumo Logic Kubernetes Collection solution, as it provides unique, comprehensive metadata tagging for all data streams.
AWS OpenTelemetry Collector default configuration
For each deployment scenario, the AWS OpenTelemetry Collector uses the same default configuration. In this configuration, the Collector is receiving telemetry data for:
- OTLP gRPC protocol - port 4317
- OTLP HTTP protocol - port 55681
- AWS X-RAY - 2000
By default telemetry data is exported by OTLP HTTP directly to a Sumo Logic HTTP Traces Source. You can adjust the configuration below to your needs.
extensions:
  health_check:
receivers:
  otlp:
    protocols:
      grpc:
        endpoint: 0.0.0.0:4317
      http:
        endpoint: 0.0.0.0:55681
  awsxray:
    endpoint: 0.0.0.0:2000
    transport: udp
processors:
  batch/traces:
    timeout: 1s
    send_batch_size: 50
  batch/metrics:
    timeout: 60s
exporters:
  otlphttp:
    endpoint: SUMO_HTTP_TRACES_URL
service:
  extensions: [health_check]
  pipelines:
    traces:
      receivers: [otlp,awsxray]
      processors: [batch/traces]
      exporters: [otlphttp]
    metrics:
      receivers: [otlp]
      processors: [batch/metrics]
      exporters: [otlphttp]