G Suite Alert Center
Step 1: Configure collection
In this step, you configure an HTTP Source to collect G Suite Alert Center log messages. You can configure the source on an existing Hosted Collector or create a new collector. If you’re going to use an existing collector, jump to Configure an HTTP Source below. Otherwise, create a new collector as described in Configure a hosted collector below, and then create the HTTP Source on the collector.
Configure a Hosted Collector
- In the Sumo Logic platform, select Manage Data > Collection > Collection.
- Click Add Collector.
- Click Hosted Collector.
- The Add Hosted Collector popup appears.
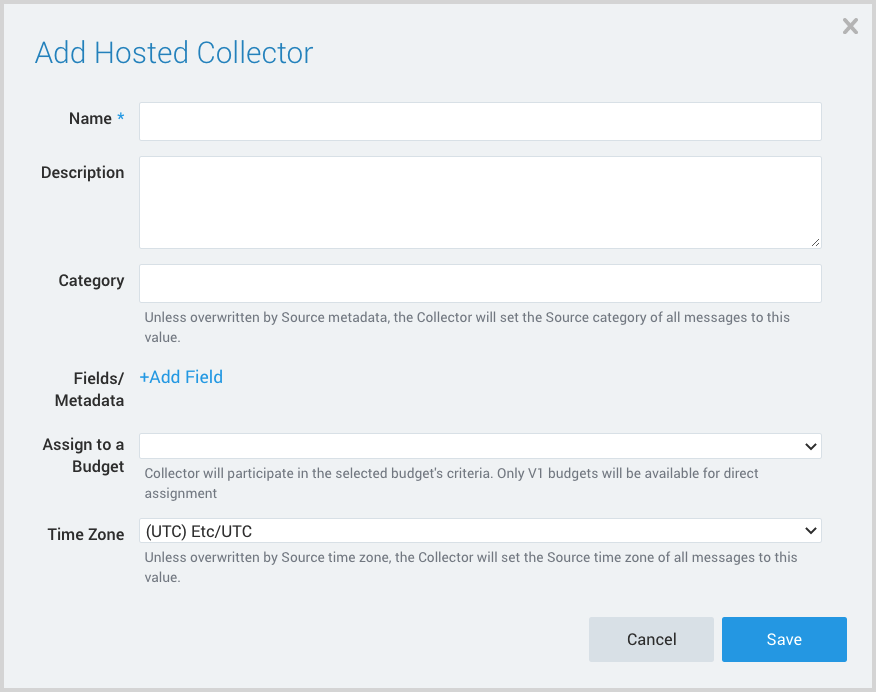
- Name. Provide a Name for the Collector.
- Description. (Optional)
- Category. Enter a string to tag the output collected from the source. The string that you supply will be saved in a metadata field called
_sourceCategory. - Fields.
- If you are planning that all the sources you add to this collector will forward log messages to CSE, click the +Add Field link, and add a field whose name is
_siemForwardand value is true. This will cause the collector to forward all of the logs collected by all of the sources on the collector to CSE. - If all sources in this collector will be G Suite Alert Center, add an additional field with key
_parserand value /Parsers/System/Google/G Suite Alert Center.
- If you are planning that all the sources you add to this collector will forward log messages to CSE, click the +Add Field link, and add a field whose name is
note
It’s also possible to configure individual sources to forward to CSE, as described in the following section.
Configure an HTTP Source
- In Sumo Logic, select Manage Data > Collection > Collection.
- Navigate to the Hosted Collector where you want to create the source.
- On the Collectors page, click Add Source next to a Hosted Collector.
- Select HTTP Logs & Metrics.
- The page refreshes.
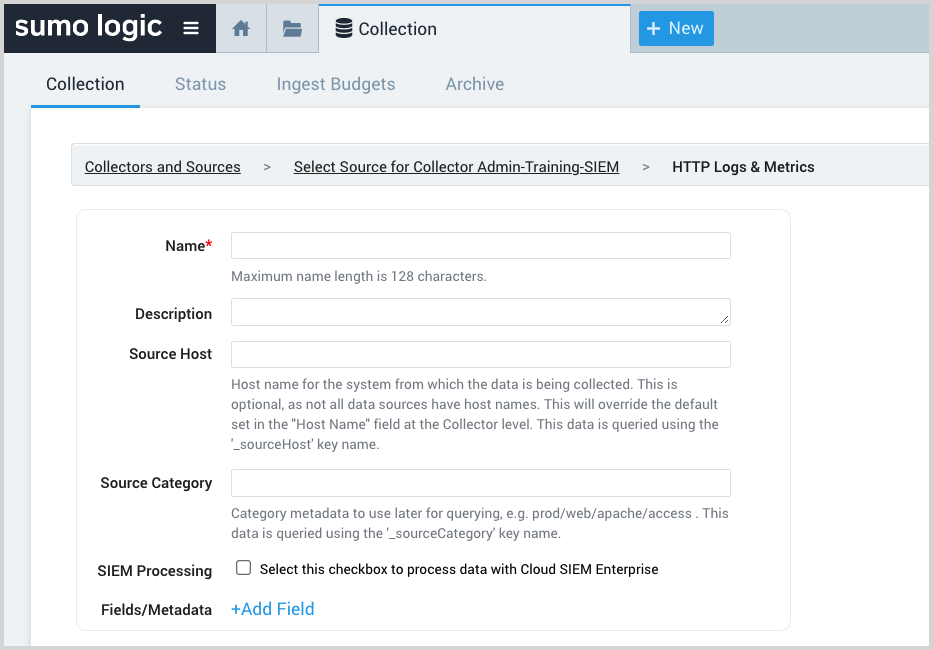
- Name. Enter a name for the source.
- Description. (Optional)
- Source Host. (Optional) Enter a string to tag the messages collected from the source. The string that you supply will be saved in a metadata field called
_sourceHost. - Source Category. Enter a string to tag the output collected from the source. The string that you supply will be saved in a metadata field called
_sourceCategory. - Fields. If you are not parsing all sources in the hosted collector with the same parser, click the +Add Field link, and add a field whose name is
_parserwith value /Parsers/System/Google/G Suite Alert Center. - Advanced Options for Logs. Under Timestamp Format, select Specify a format.
- Format. Enter
yyyy-MM-dd'T'HH:mm:ss.SSS'Z' - Timestamp locator. Enter
\"createTime\":(.*), - Click Add.
- Format. Enter
- Click Save.
- Make a note of the HTTP Source URL that is displayed. You’ll supply it in Step 2 below.
Step 2: Configure G Suite Alert Center
In this step you configure G Suite Alert Center to send logs to Sumo Logic. You can configure a G Suite Alert Center collector in Google Cloud Platform (GCP), or via a script on a Linux machine. Choose the method that is best suited for you:
- Google Cloud Platform (GCP) collection
- Script-based collection
Step 3: Verify ingestion
- In this step, you verify that your logs are successfully making it into CSE.
- Click the gear icon, and select Log Mappings under Incoming Data.
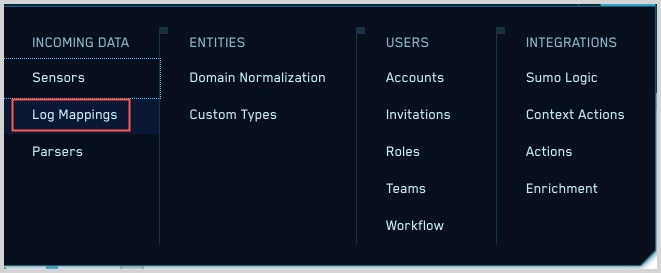
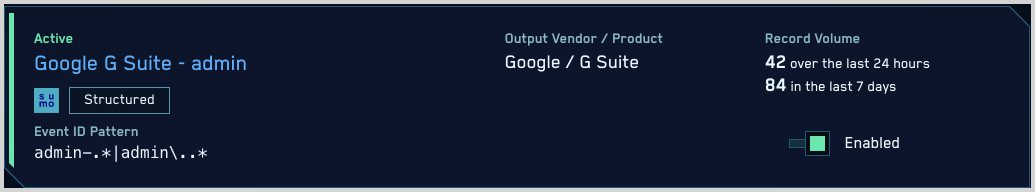
- On the Log Mappings page search for "G Suite Alert Center" and check under Record Volume.
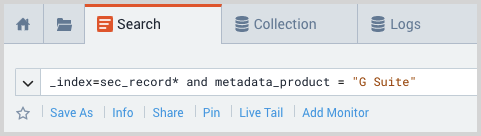
- For a more granular look at the incoming records, you can also search the Sumo Logic platform for G Suite Alert Center security records.