About the CSE Insight UI
This topic describes the CSE UI for working with Insights.
Insights list page
To open the Insights page, click the icon to the right of the search bar at the top of the CSE UI.
By default, the Insights page presents all Insights whose Status is not “Closed”, in descending order by Event Time in a list view. If you’d like to see Insights organized by their status, click the Show Board icon near the top right corner of the page. For information about the Board view, see Board view.
CSE displays Insights and the Signals attached to them in the CSE UI through the end of the data retention period defined in your account agreement.
List view
This screenshot shows the Insights page in List view.
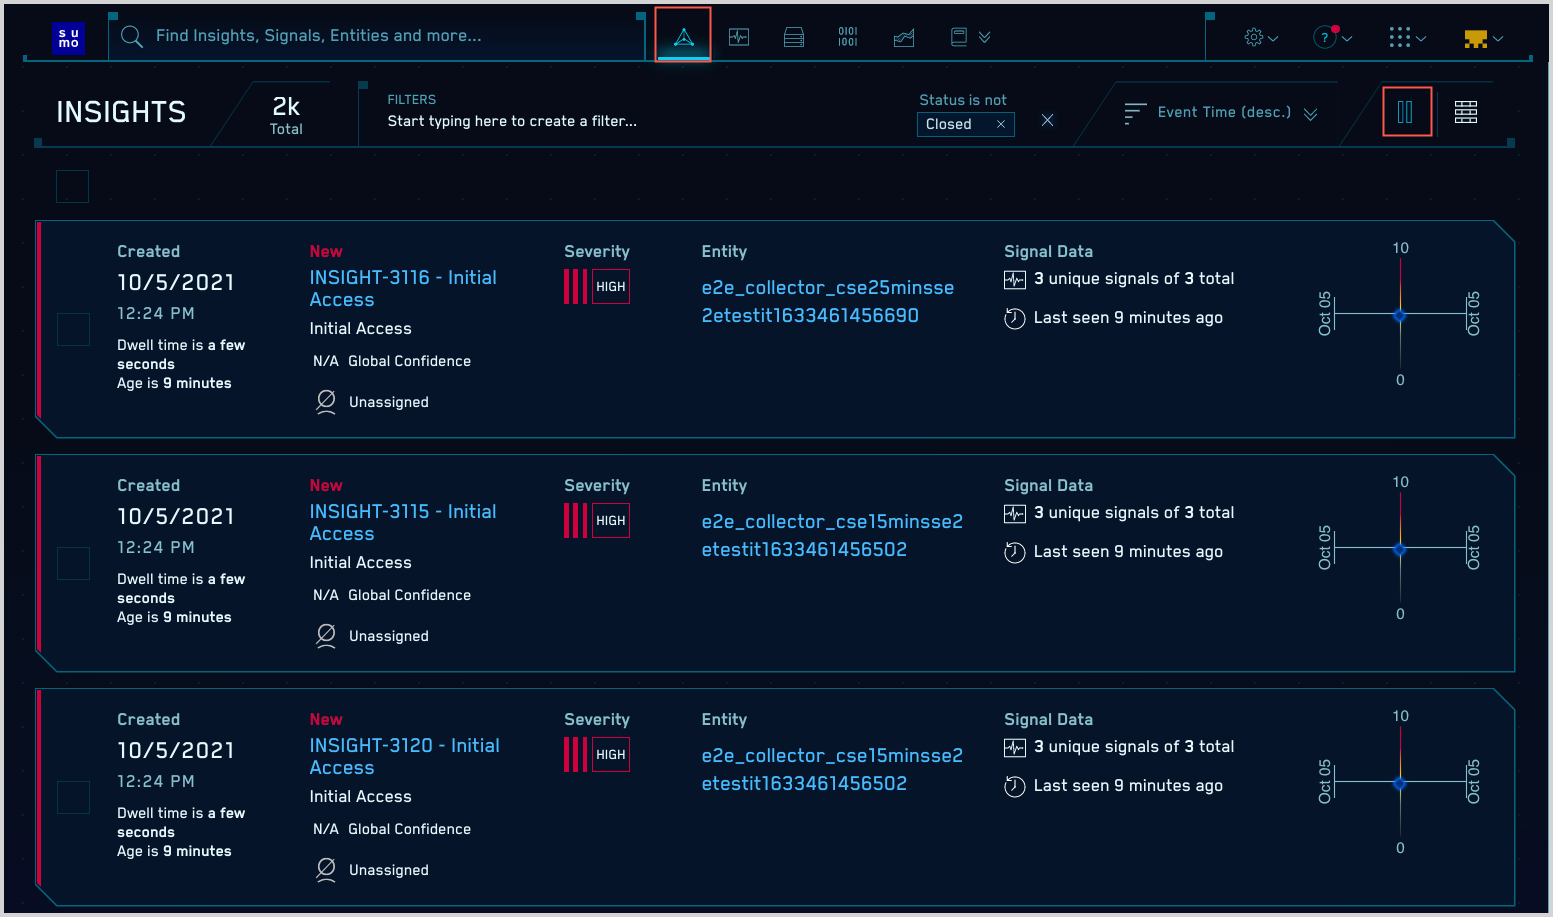
Here’s one row from the List view. The numbered definitions below correspond to the labels in the screenshot.
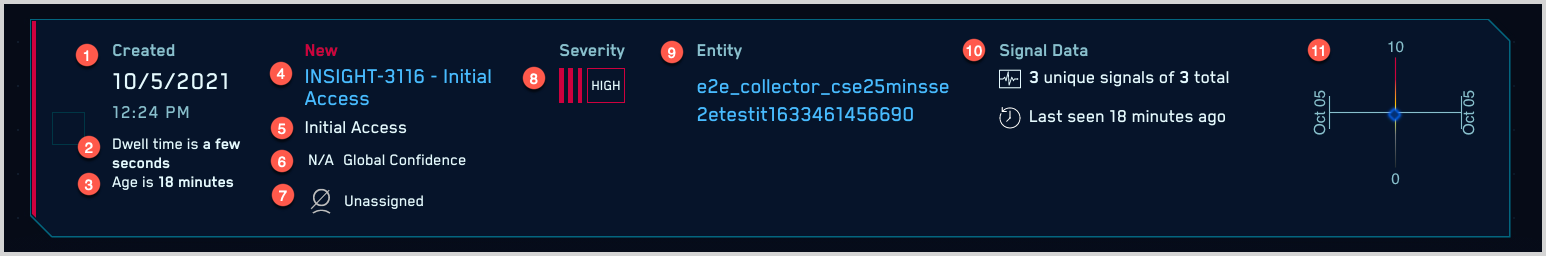
- Creation date and time. When the Insight was created.
- Dwell time. The period of time between when the first and last Records in the Insight were observed.
- Age. The elapsed time since the Insight was created in minutes, hours, and so on.
- Insight name. The Insight name, made up of the Insight ID, and the MITRE stage or stages associated with the Signals in the Insight.
- Global Confidence. If sufficient data is available, a Global Confidence score for the Insight is shown.
- Assignee. The analyst assigned to the Incident.
- Severity. The severity of the Insight. The value is a function of the configured Entity Activity Score threshold for Insight generation. For more information, see Insight Severity.
- Entity. The Entity associated with the Insight.
- Signal data. This area has three bits of information:
- The count of Signals that caused the Insight to be created.
- The total count of Signals on the Insight Entity during the detection window.
- How long it's been since the last Signal fired associated with the Insight fired.
- The visualization plots the Insight's Signals over time (x-axis) by severity (y-axis).
Board view
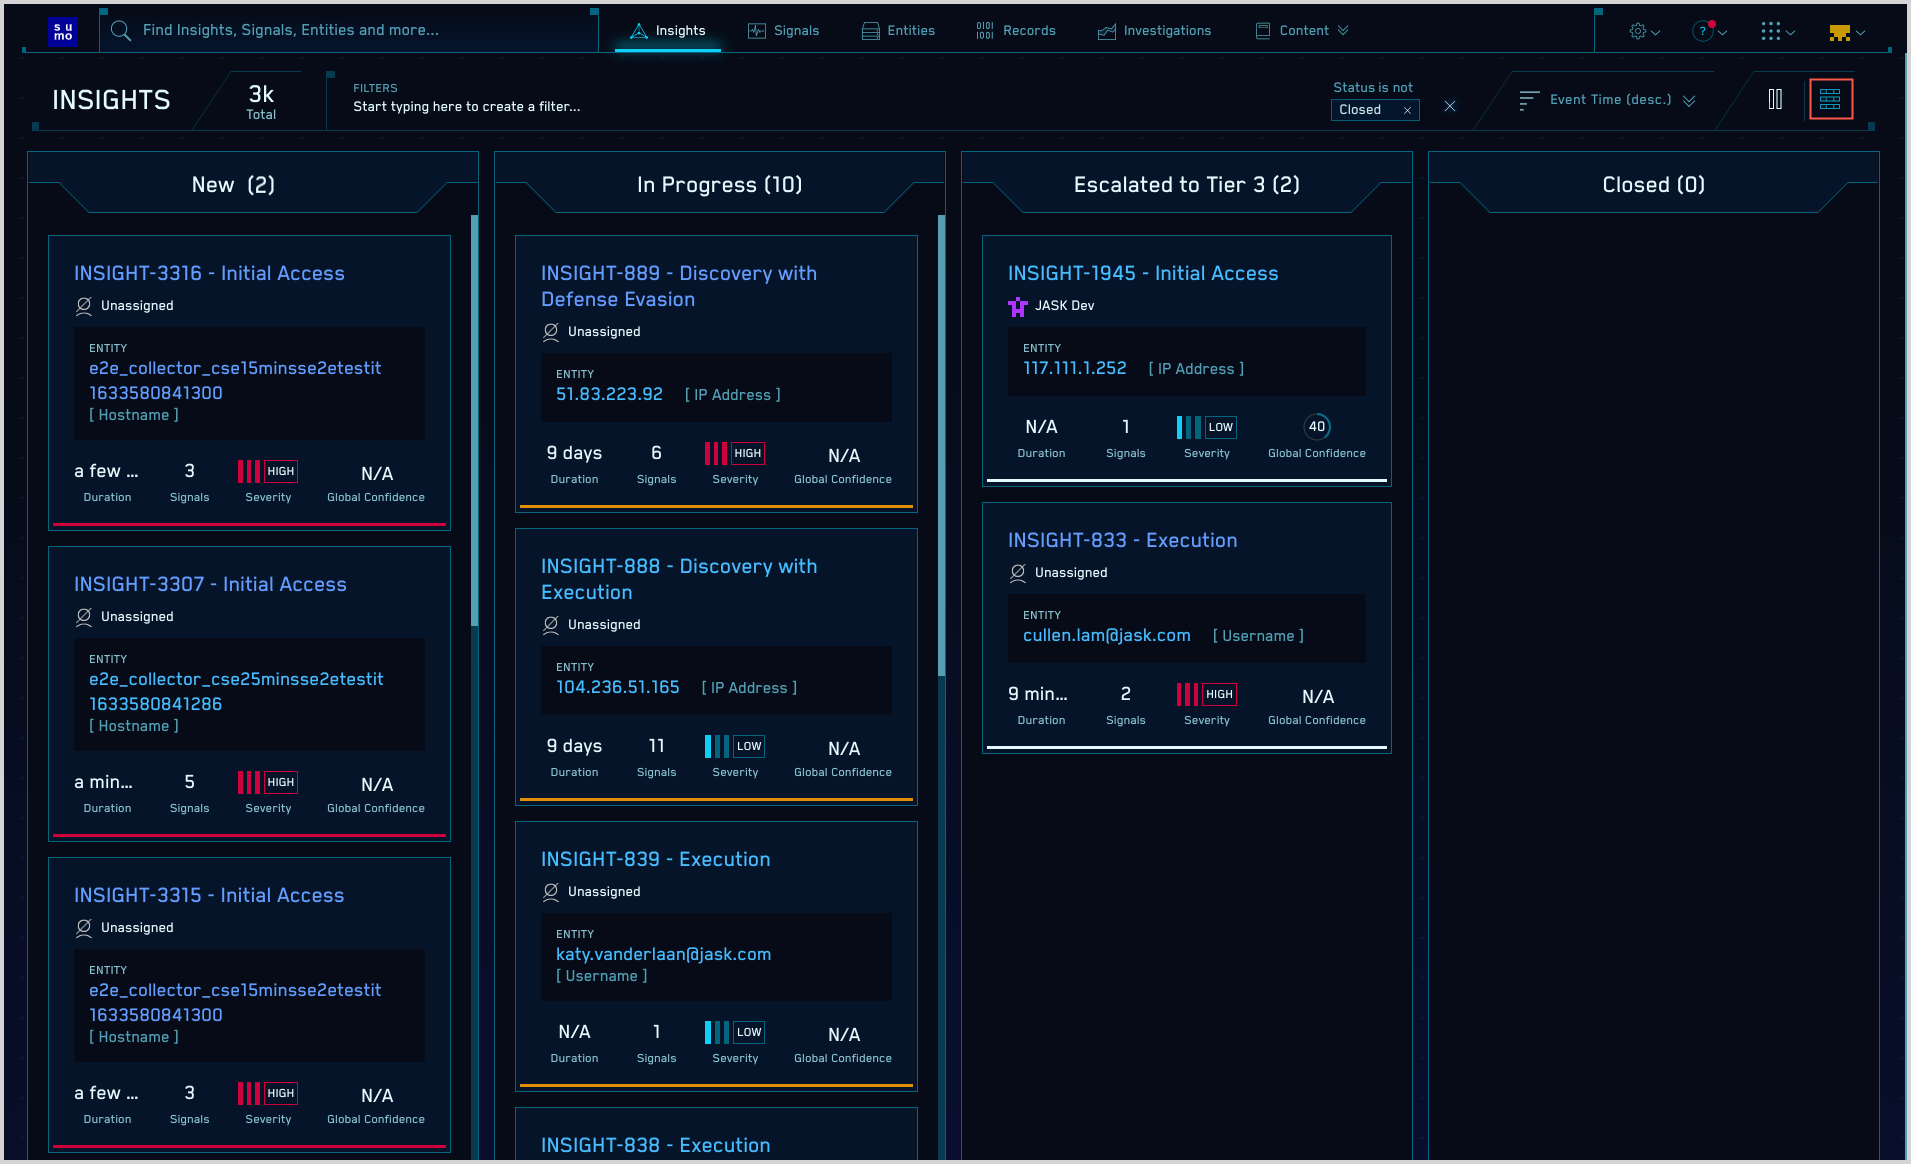
This screenshot shows the Insights page with the Signals organized as a Board. Each of the columns corresponds to an Insight Status value. (One of the Status values shown is a custom Insight Status).
The information displayed in the Board view is similar to the information in the List view.
You can switch back the List view by clicking the Show List icon, near the top right corner of the CSE UI.
Filtering Insights
You can use the Filters area near the top of the page to narrow down the Insights that appear on the Insights page. You can filter by:
- Status
- Assignee
- Severity
- Created
- Event Time
- Severity
- Resolution
- Custom Resolution
- Name
- Tags
- Rule ID
- Entity
Insight Details page
This section describes the Insight > Details page.
Insight details pane
The left pane of the Insight > Details page displays detailed information about the selected Insight. Some of the information that appears is the same as what’s in the row for an Insight on the Insights page, and is described in List view, above. The additional information that appears in the Details pane is defined below.
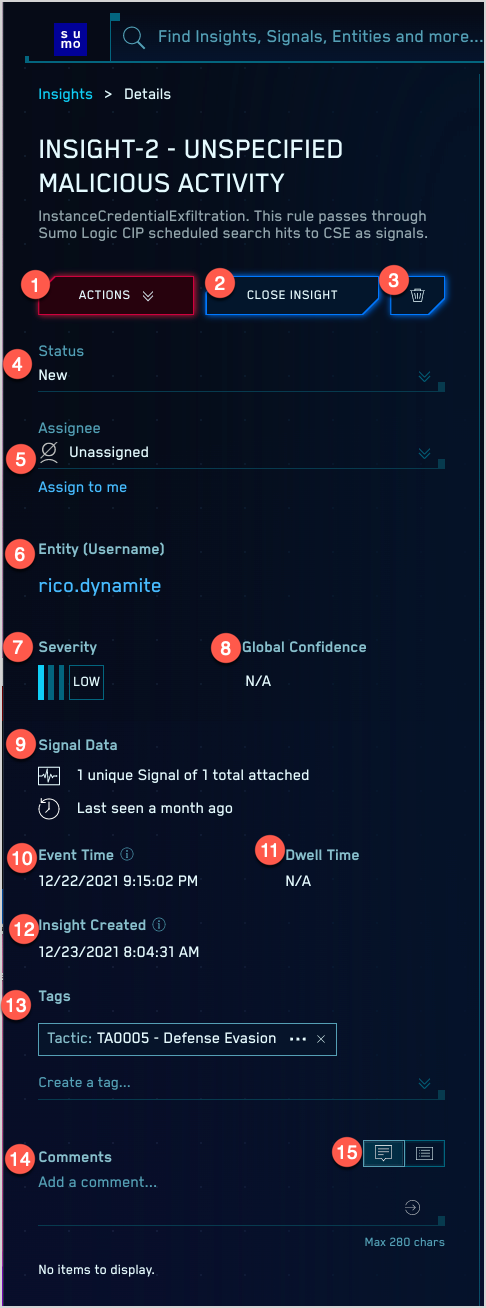
- Actions. The dropdown lists Insight Actions defined in your environment.
- Close Insight. Use this option to close an Insight. When you click this option, you’re prompted to select an Insight resolution.
- Delete Icon. Use this option to delete an Insight. You’ll be prompted to confirm your choice.
- Status. Current status of the Insight.
- Assignee and Assign to me. Shows the current assignee, and allows you to assign yourself the Insight.
- Entity. The Entity the Insight fired on.
- Severity. Severity of the Insight. Mouse over it to see an icon you can click to change the Insight severity.
- Global Confidence. The Global Confidence score for the Insight, if available.
- Signal Data. The number of Signals in the Insight.
- Event Time. The event time for the of the last Signal in the Insight.
- Dwell Time. The period of time between when the first and last Records in an Insight were observed.
- Insight Created. When the Insight was created.
- Tags and Create a Tag. Displays any Tags that have already been assigned to the Insight, and a field for adding a tag.
- Comments. Displays any comments that have been made on the Insight, and a field for adding a comment.
- Show Comments/History. The controls allow you to switch between viewing comments, and viewing the Insight history, for example, when a tag was assigned to the Insight.
Signal visualization area
At the top of the Insight > Details page, you’ll see a Signal timeline that visualizes the Insight’s attached Signals, which are the Signals that caused the Insight to be created, and any Signals that have been manually added to the Insight.
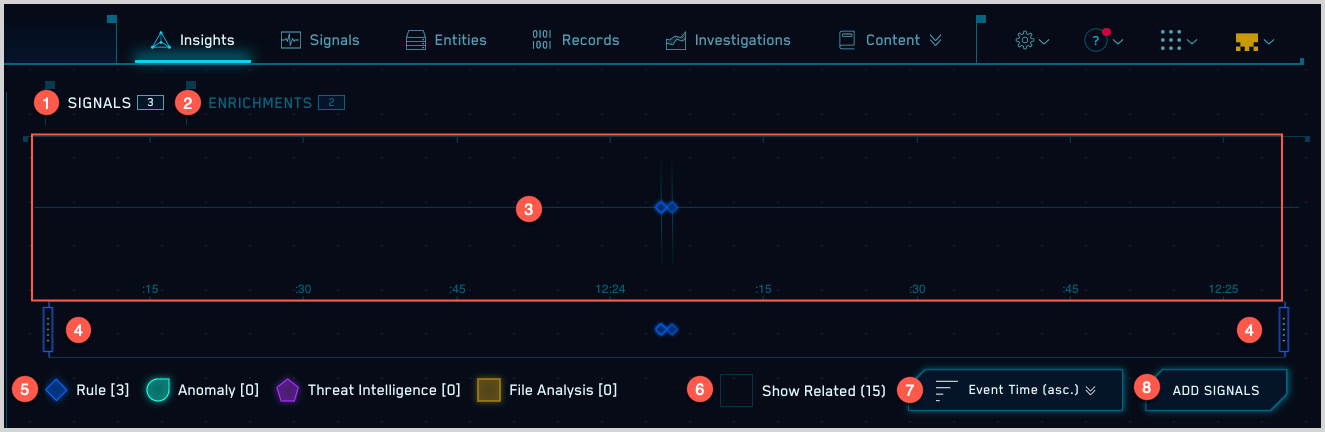
- Signals.The Signals link allows you to switch back to the Signals view from the Enrichments view, described below.
- Enrichments. Click this tab to view any any enrichments that have been added to the Insight, includin the output of Insight Enrichment Server.
- Signal timeline. The timeline shows how spread apart each Signal in the Insight is. You can use the timeline to visualize how long these events are spread over and how frequently the Signals fire.
- Timeline controls. The arrows on the far left and right sides allow you to toggle between each Signal to show the details on each. You can also click a specific Signal on the timeline to jump to those details.
- Legend. Key to the symbols used to represent the Signals:
- Anomalies—Signals that were triggered by User and Entity Behavior Analytics (UEBA) rules.
- Threat intelligence—Signals that were fired by Threat Intel rules.
- File Analysis—Signals that were triggered by Yara file analysis rules.
- Rules—Signals that were triggered by other rules.
- Show Related Signals. Click this link to show Related Signals in addition to Attached Signals.
- Sort options. You can sort the Signals list by Content Type, Event Time, Created Time, Name, or Severity. Note that you can further sort by ascending or descending value.
- Add Signals. Click this option if you want to add a Signal to the Insight. You’ll be prompted with a list of Signals that have the same Entity as the current Insight (if there are any), and are not already attached to another Insight. A Signal that you add to an Insight manually is considered an Attached Signal.
Entities tab
The Entities tab displays a list of one or more Related Entities, which help a security analyst more quickly investigate the Insight and to better understand the scope of a security issue that the Insight reveals.
Related Entities extend the information available to the analyst beyond the data captured in an Insight. An Insight focuses on a primary Entity: the username, hostname, IP address, or MAC address that’s found in each of the Insight’s Signals. Related Entities expand the analyst’s view to include other Entities listed in the Records that belong to Signals in an Insight as well as Entities that aren’t in those Records but have a relationship to Entities that are.
The screenshot below shows the Entities tab for an Insight.
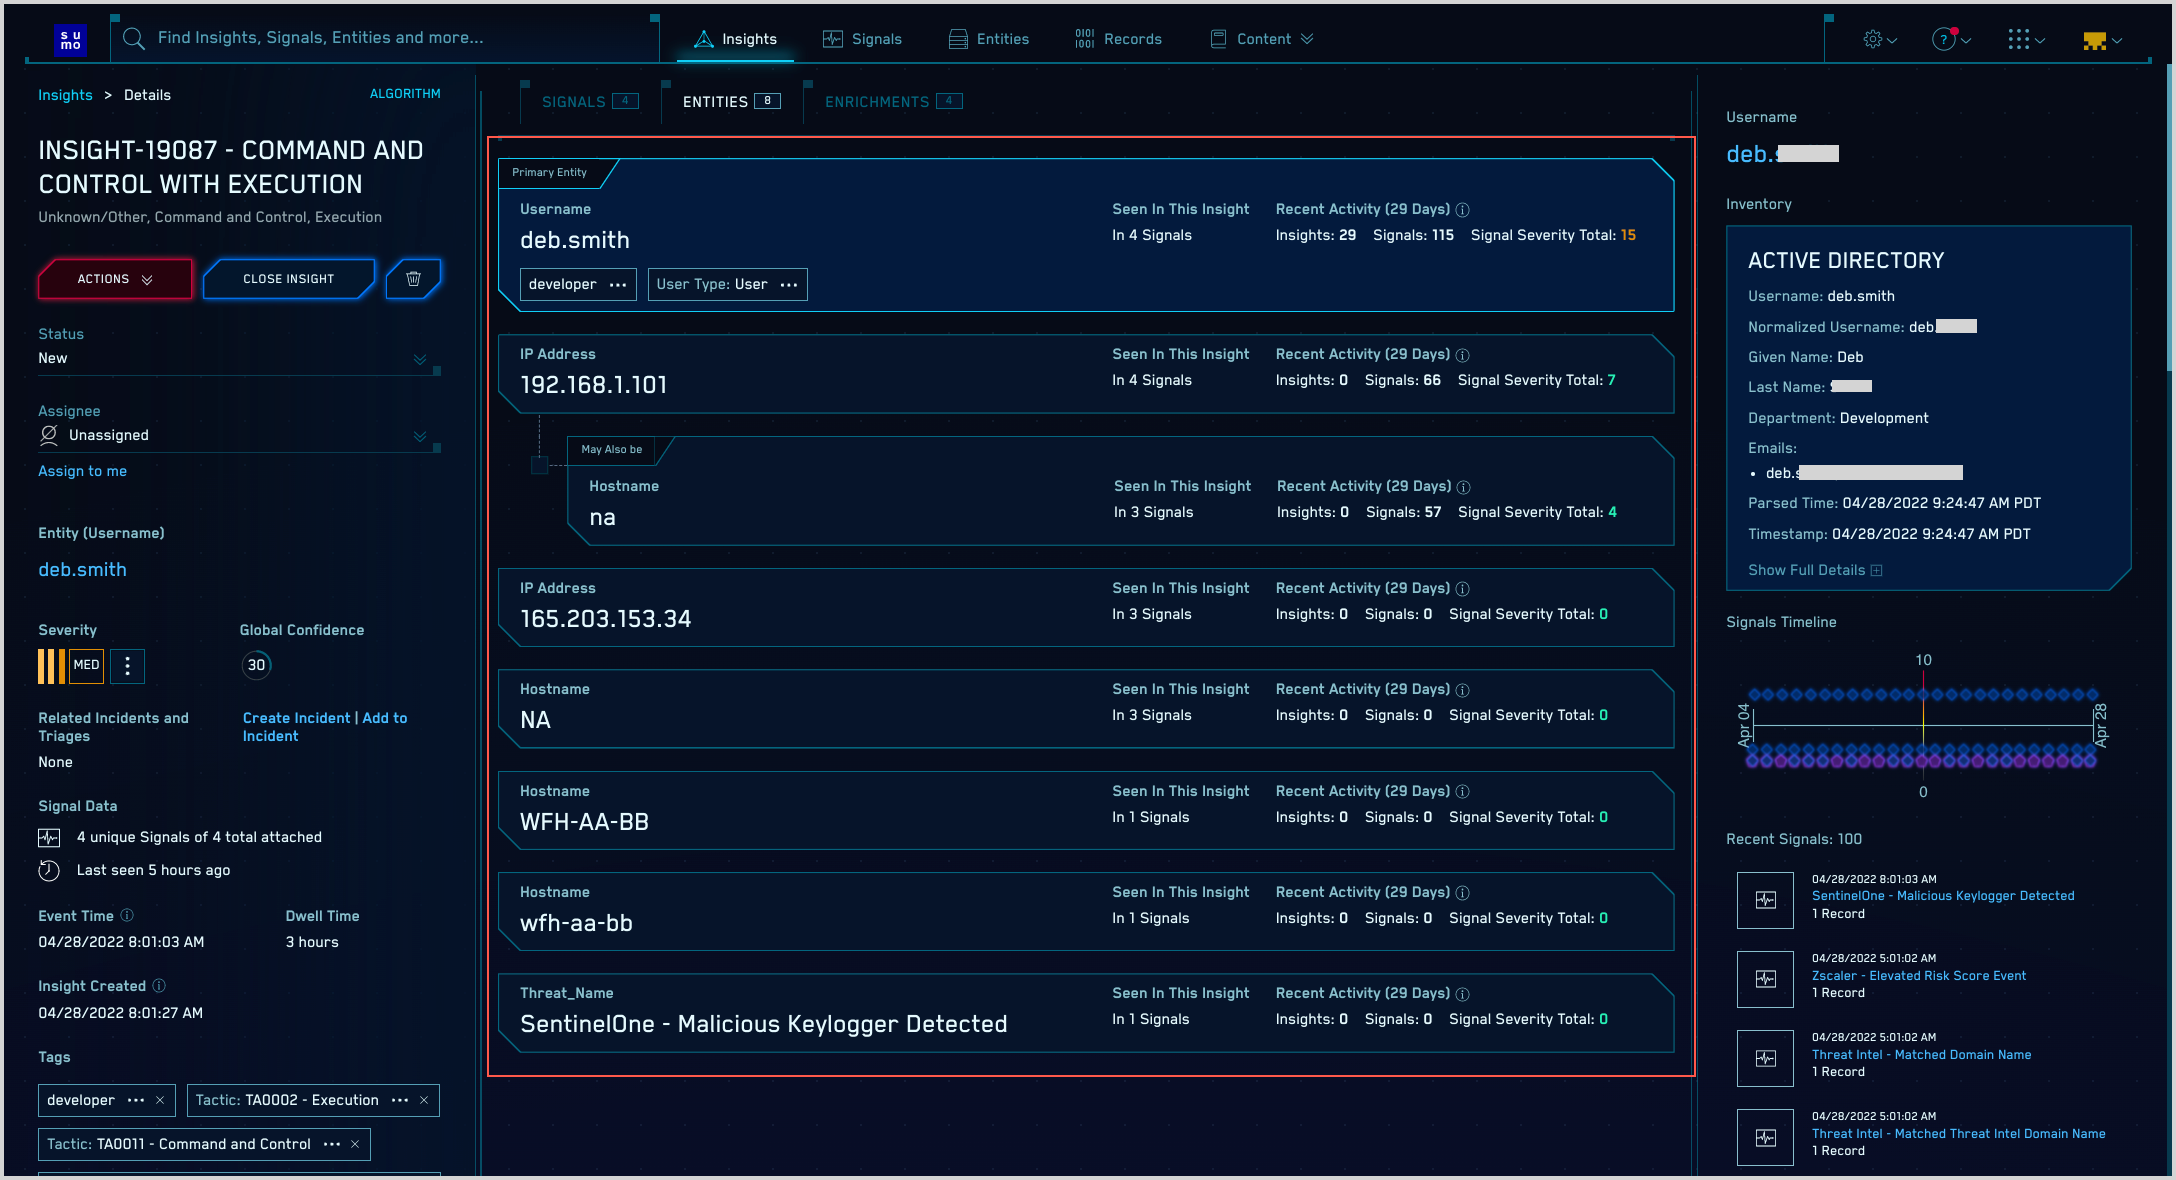
About the Entities tab
The Entities tab for an Insight lists all Entities involved in an Insight, and other Entities that CSE has determined are related to them.
Note that in the list of Entities, some are not indented, and others are indented below another Entity. The first unindented Entity listed is the primary Entity for the Insight–the Entity which is common to all of the Signals in the Insight. The other unindented Entities in the list are Entities contained in one or more Records that belong to Signals in the Insight.
The indented Entities in the list are referred to as related Entities. How does that work? For each Entity in the Insight—including the primary Entity and other Entities in the Insights’s Signals—CSE searches for Entities that, although not found within the Insight’s Signals, seem to be related to an Entity in the Insight. This search is run across a time range that corresponds to the span of time during which there was activity on the Insight. For example, if the first Record in an Insight was created at 8 am on Wednesday and the last Record at 10pm on Friday, CSE searches for related Entities during that time range. A related Entity that CSE finds is shown below the Entity to which it’s related with a dotted line, and labeled May also be.
If an Entity is in the Record and is also a related Entity (is labeled May also be) it could be either indented or not indented, based on the number of Signals that mention the Entity (the higher the number, the more likely it is to be unindented.
How does CSE look for related Entities? Within the time range of the Insight, described above, CSE searches for related Entities in the following normalized Record fields:
- Hostname: *_hostname
- MAC address: *_mac
- User: *_username
- IP address: *_ip
Custom Entities that match will also be included in the results.
What’s in an Entity card
The card for an Entity displays any tags that have been assigned the Entity, along with the following information:
- The number of times that Entity was referenced in the Signals in the Insight.
- The number of Insights, created during the Insight generation detection window, in which the current Entity is the primary Entity. note
The detection window is 14 days by default, but can be configured to be a different duration.
- The number of Signals that fired during the Insight generation detection window, in which the current Entity is the primary Entity, and the sum of the severities for those Signals. note
The cumulative severity value is color coded: cyan for less than 12, orange for 12-23, and red for 24 and above, assuming your Insight generation threshold is 12. If the Insight threshold is set to a value other than the default of 12, the color coding will be adjusted to match
Entity details in the right pane
When you select an Entity in the center pane, the right pane displays details about that Entity. The information displayed depends on what type of Entity is selected (username, hostname, IP address, MAC address, or custom) and can include:
- A link to the Entity’s details page.
- Entity Criticality, if it is set to something other than the default.
- Metadata such as geographic location, Inventory information, the Network Blocks it falls within, as applicable, and so on.
- A Signal graph that shows when the Signals were created on the horizontal axis (which is at most 14 days—the detection window), the severity of each Signal on the vertical axis, and the Signal type based on the icon/color of each point.
- Lists of the recent Signals and Insights the Entity has been associated with, and links to each object’s details page.
Accessing related Entities using the API
You can access related Entity information using the CSE API. For more information, see CSE APIs.
Signal list area
Below the Signal timeline, you’ll see a list of Signals. By default, only attached Signals are displayed.
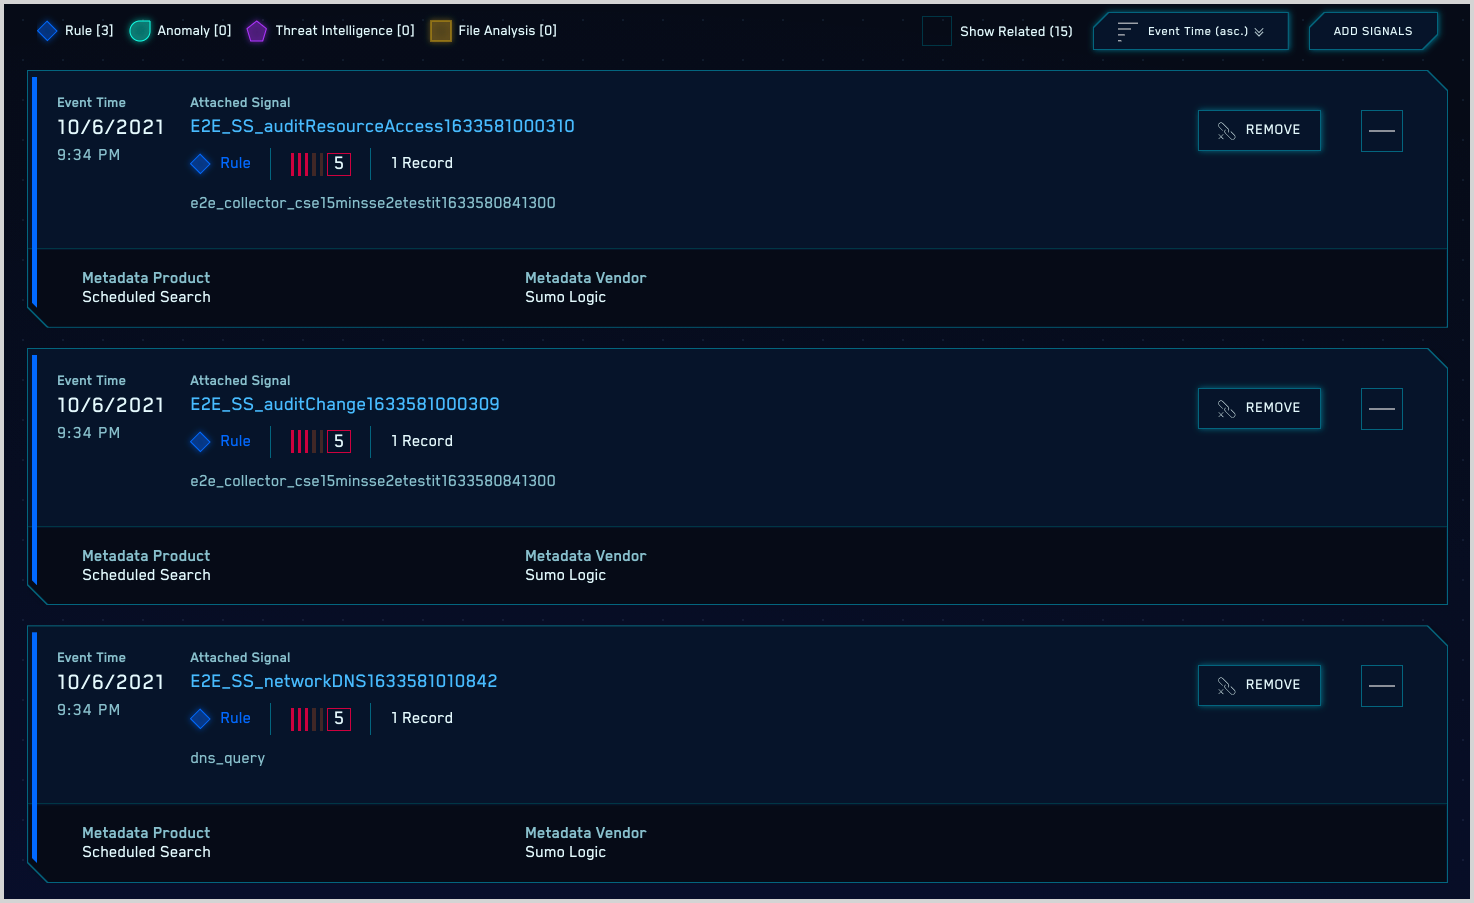
If you click the Show Related checkbox, the page updates and also displays any Related Signals or Related Insights
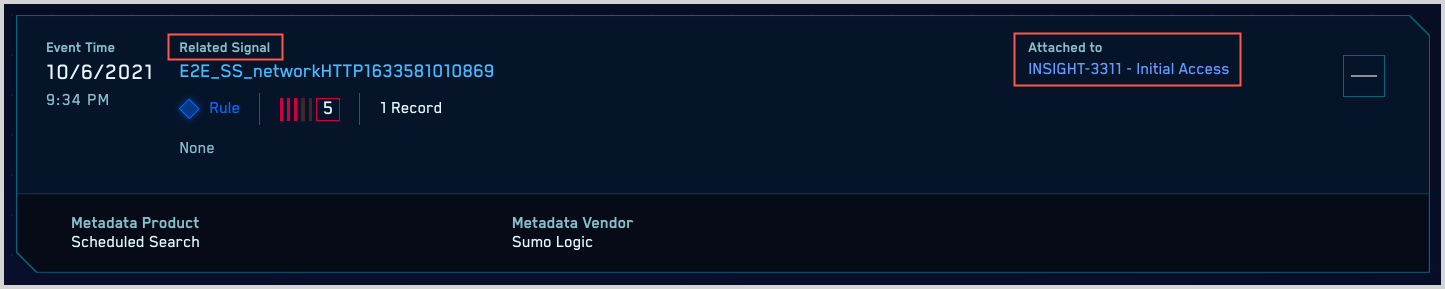
- A Related Signal is a Signal that isn’t part of the current Insight (it’s not attached), but fired on the same Entity as the current Insight’s attached Signals within 7 days of the current Insight’s attached Signals.
- A Related Insight is an Insight that a Related Signal is attached to.
Here is an example of what a Related Signal and Related Insight look like in the Signal list. Note that, to distinguish between Signals that are attached as opposed to related, an Attached Signal has a blue vertical “ornament” on the left side of the row. A Related Signal does not.