Manage Panels
See the following sections to view, edit, and manage dashboard panels.
Edit Data Panels on the Dashboards Page
To edit data panels on a dashboard:
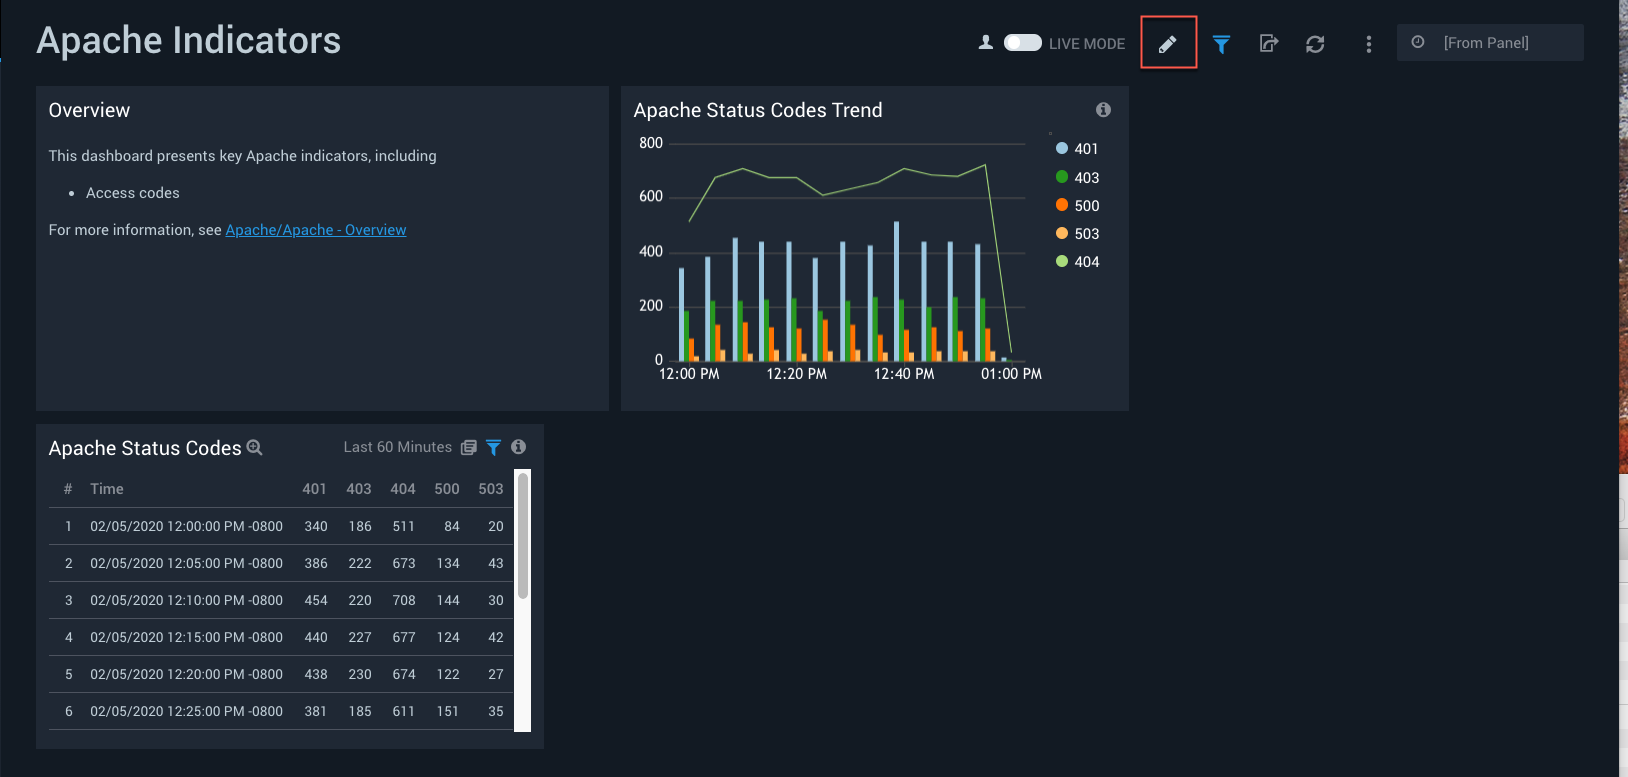
Click the Edit icon in the upper right of the dashboard.
Click the Settings icon in the panel you want to edit.
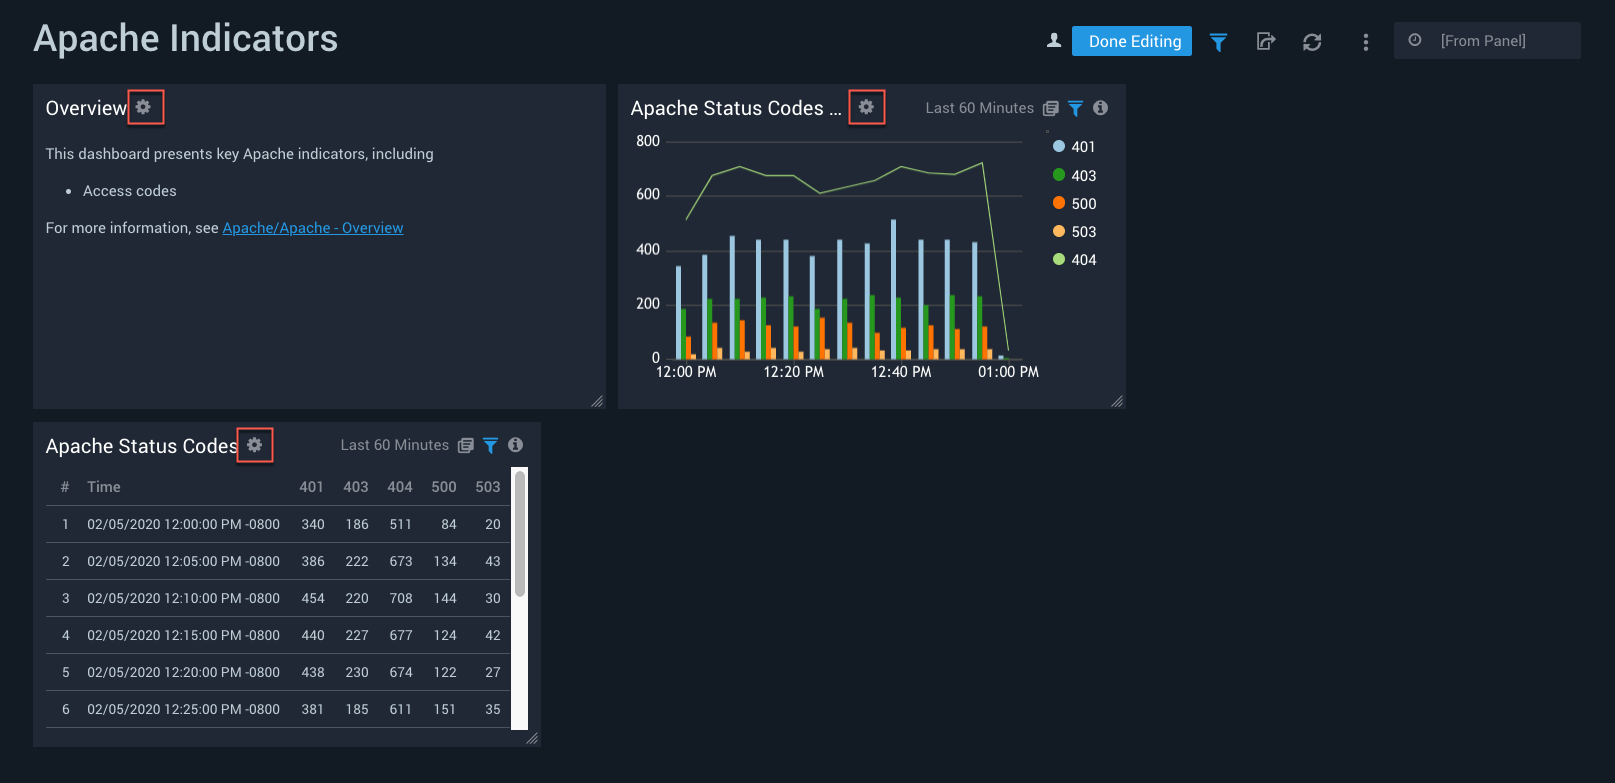
For details on the various options shown, see Edit Dashboards and Panels.
When you are done making edits, click Done Editing.
You can also edit a Data Panel on the Search page. But the Settings dialogs are different.
You can view the query in the Settings dialog, but you must edit it from the Search page. See Save edits to a Panel.
Save Edits to a Panel
After running a search from a panel, any edits made to the query can be saved back to the panel. These changes are immediately reflected in the panel. In addition to fine-tuning the query, you can also change the time range of the panel.
Only the owner of a shared dashboard can save changes back to a panel.
To save changes back to a panel:
- Click a panel to launch a search.
- Make any changes you'd like, either to the query or the time range of the panel.
- Run the search.
- Once the search has completed, click Update Dashboard.
- Confirm the changes you've made.
Changes are reflected immediately.
Editing Shared Dashboards
In Sumo, a dashboard's data access level determines what data appears in the dashboard when users with whom the dashboard was shared view it. In effect, the data access level of a dashboard controls what search role filter is applied to the dashboard: the viewer's filter, or the filter of the user that shared the dashboard. For more information about data access levels, see Set the Data Access Level for a Dashboard.
When you add or edit a panel in a shared dashboard, Sumo compares your role search filter to the search filter with which the dashboard was shared. If the search filters vary, Sumo displays a message like this:
Cannot Edit Dashboard Dashboard Name
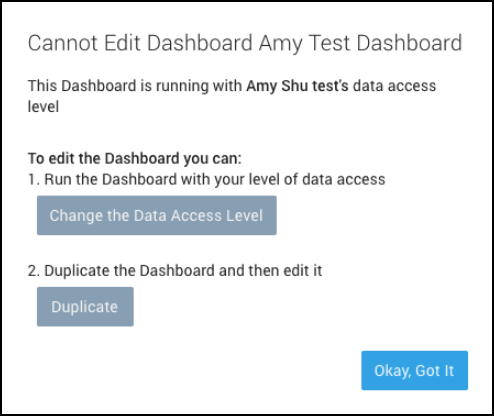
To be able to edit the dashboard, you can either:
Make a copy of of the dashboard.
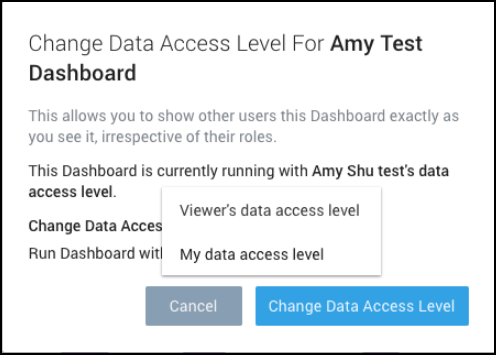
Change the data access level. You can either set the data access level to your own data access level, or to the viewer's.
If you set the data access level to your own, users with whom the dashboard is shared will see the same data that you can in the dashboard.
If you set the data access level to the viewer's, users with whom the dashboard is shared will only see data to which their role filter allows access.
View and Edit Queries
View the Query of a Data Panel
The query and its time range of a Data Panel is displayed in the Settings dialog of the Dashboards page.
If you’d like to edit the query itself, you can do that on the Search page. See Manage Charts.
On the Dashboards page, in the Panel, click the Show in Search icon. The Search query opens in a new tab loading the query.
![]()
Edit the Query of a Data Panel
You can view the query of a Data Panel in the Settings dialog of the Dashboards page, but you must edit it on the Search page. Here's a quick way to access that functionality.
To edit a query:
- Click a section of the Data Panel to open the query in the Search page.
- Edit the query as necessary.
- Click Update Dashboard save your changes and return to the dashboard.
Change the Panel Legend
For Bar, Column, Line, or Area charts, you can change the way legends in a chart are displayed, or hide them entirely.
You cannot change the labels on legends.
To change a panel legend, do the following:
On the Dashboards page, select the Edit button.
Click the panel Settings icon.
In the Settings dialog, select General.
Under Legend select from the display options:
- No Legend
- Right
- Bottom
Click Save.
Change the Panel Legend from the Search Page
You can change the way legends in a chart are displayed, or hide them entirely.
To change the legend of a Panel chart:
- On the Search page, in the Aggregation tab, click the Settings icon and select Change Legend.
- Deselect Show Legend to remove the Right or Bottom legend in the chart.
- Click Save.
Change the Panel Type of a Data Panel on the Search Page
If you'd like to change the way a data Panel is displayed in a Dashboard you can choose a different layout.
On the Search page, in the Aggregates tab, click the icon for the layout you would like to use.
Change the Time Range of a Panel
Once you've created a panel, you can change the time range whenever you'd like.
Change the time range of a panel temporarily
Click the panel's time range text to display a menu, and select an option to change the time range. Or enter a new time range manually.
noteDashboard panels are limited to a 32-day maximum time range.
The Panel updates to display the data for that time range.
Change the time range of a panel permanently
Click Show in Search.
The Panel query opens in the Search page.
Change the time range on the Search page, and rerun the search.
Click Update Dashboard.
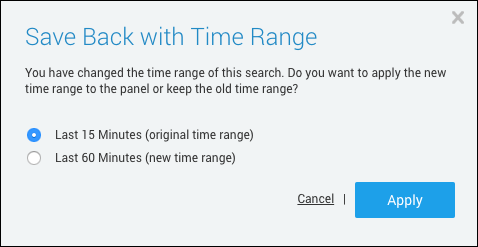
In the Save Back with Time Range dialog, select the original or new time range you want to use. Then click Apply.
 note
noteDashboard panels are limited to a 32-day maximum time range.
The panel's time range is reset in the Dashboard.
Edit Data Panels on the Search Page
Changes to a Data Panel can be made by editing the search query.
To change a Data Panel from the Dashboard:
On the Dashboards page, hover over a data panel.
Click on the Show In Search icon.

Edit the query to your specifications.
Click Update Dashboard to save your changes and update the dashboard with your changes.
