Install the Global Intelligence for Apache Tomcat App and View the Dashboards
This section has instructions for installing the Sumo Logic App for Global Intelligence for Apache Tomcat and descriptions of each of the app dashboards.
Dashboard Filters
Each dashboard has a set of filters that you can apply to the entire dashboard, as shown in the following example. Click the funnel icon in the top dashboard menu bar to display a scrollable list of filters that are applied across the entire dashboard.
You can use filters to drill down and examine the data on a granular level. One server must be selected for benchmark comparisons to be meaningful.

Concepts
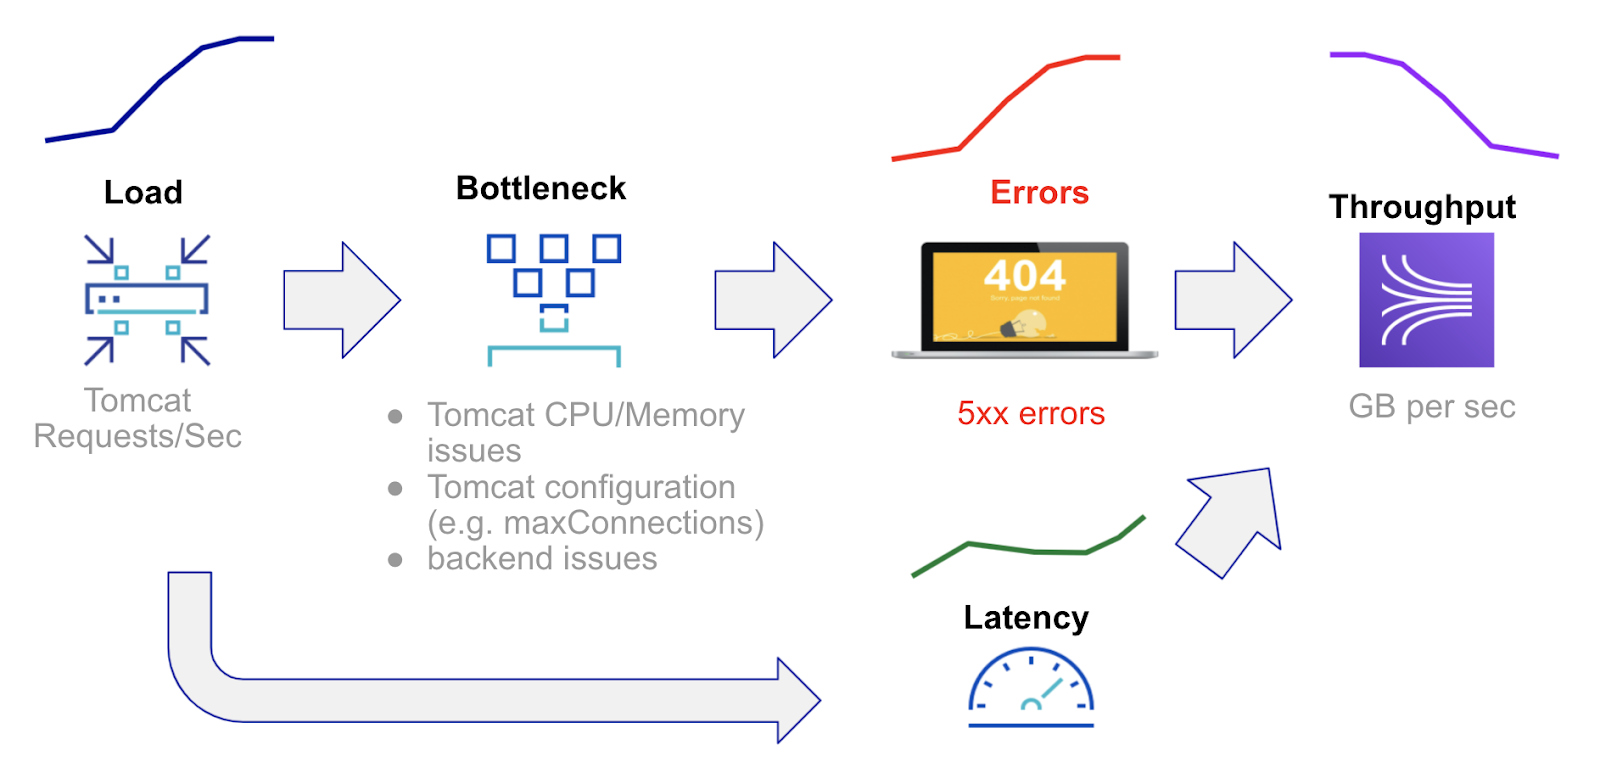
Golden Signals
Golden signals of load, bottleneck, latency, errors and throughput help identify flow of causation between benchmark signals. In a nutshell, load spikes lead to either latency or error spikes; latency and error spikes lead to drop in throughput as shown in the figure below. The signals and contributing factors are organized based on Golden Signal analysis
Distance: Quantifying Similarity of Server Time Series to Benchmark
Distance, between 0 and 1, is a statistical measure of how similar a given entity is to other entities based on a given time series signal. A distance of 0 signifies entities that are behaving identical to the population of entities, for the given signal. Sudden increases in distance coupled with sudden increases compared to benchmark values indicate entities that are either the cause of an incident or are affected by upstream issues.
For each Apache Tomcat server, hourly signals for the past 7 days are used to construct the benchmark distribution for a given signal such as requests per second. A given server’s hourly readings for each day are compared with the benchmark signals to determine the daily distance from the benchmark. If a server is consistently different from the benchmark, such a server is behaving differently from the population for a given signal. Changes, such as a sudden increase in distance between days are more significant than the absolute value of distance on any given day.
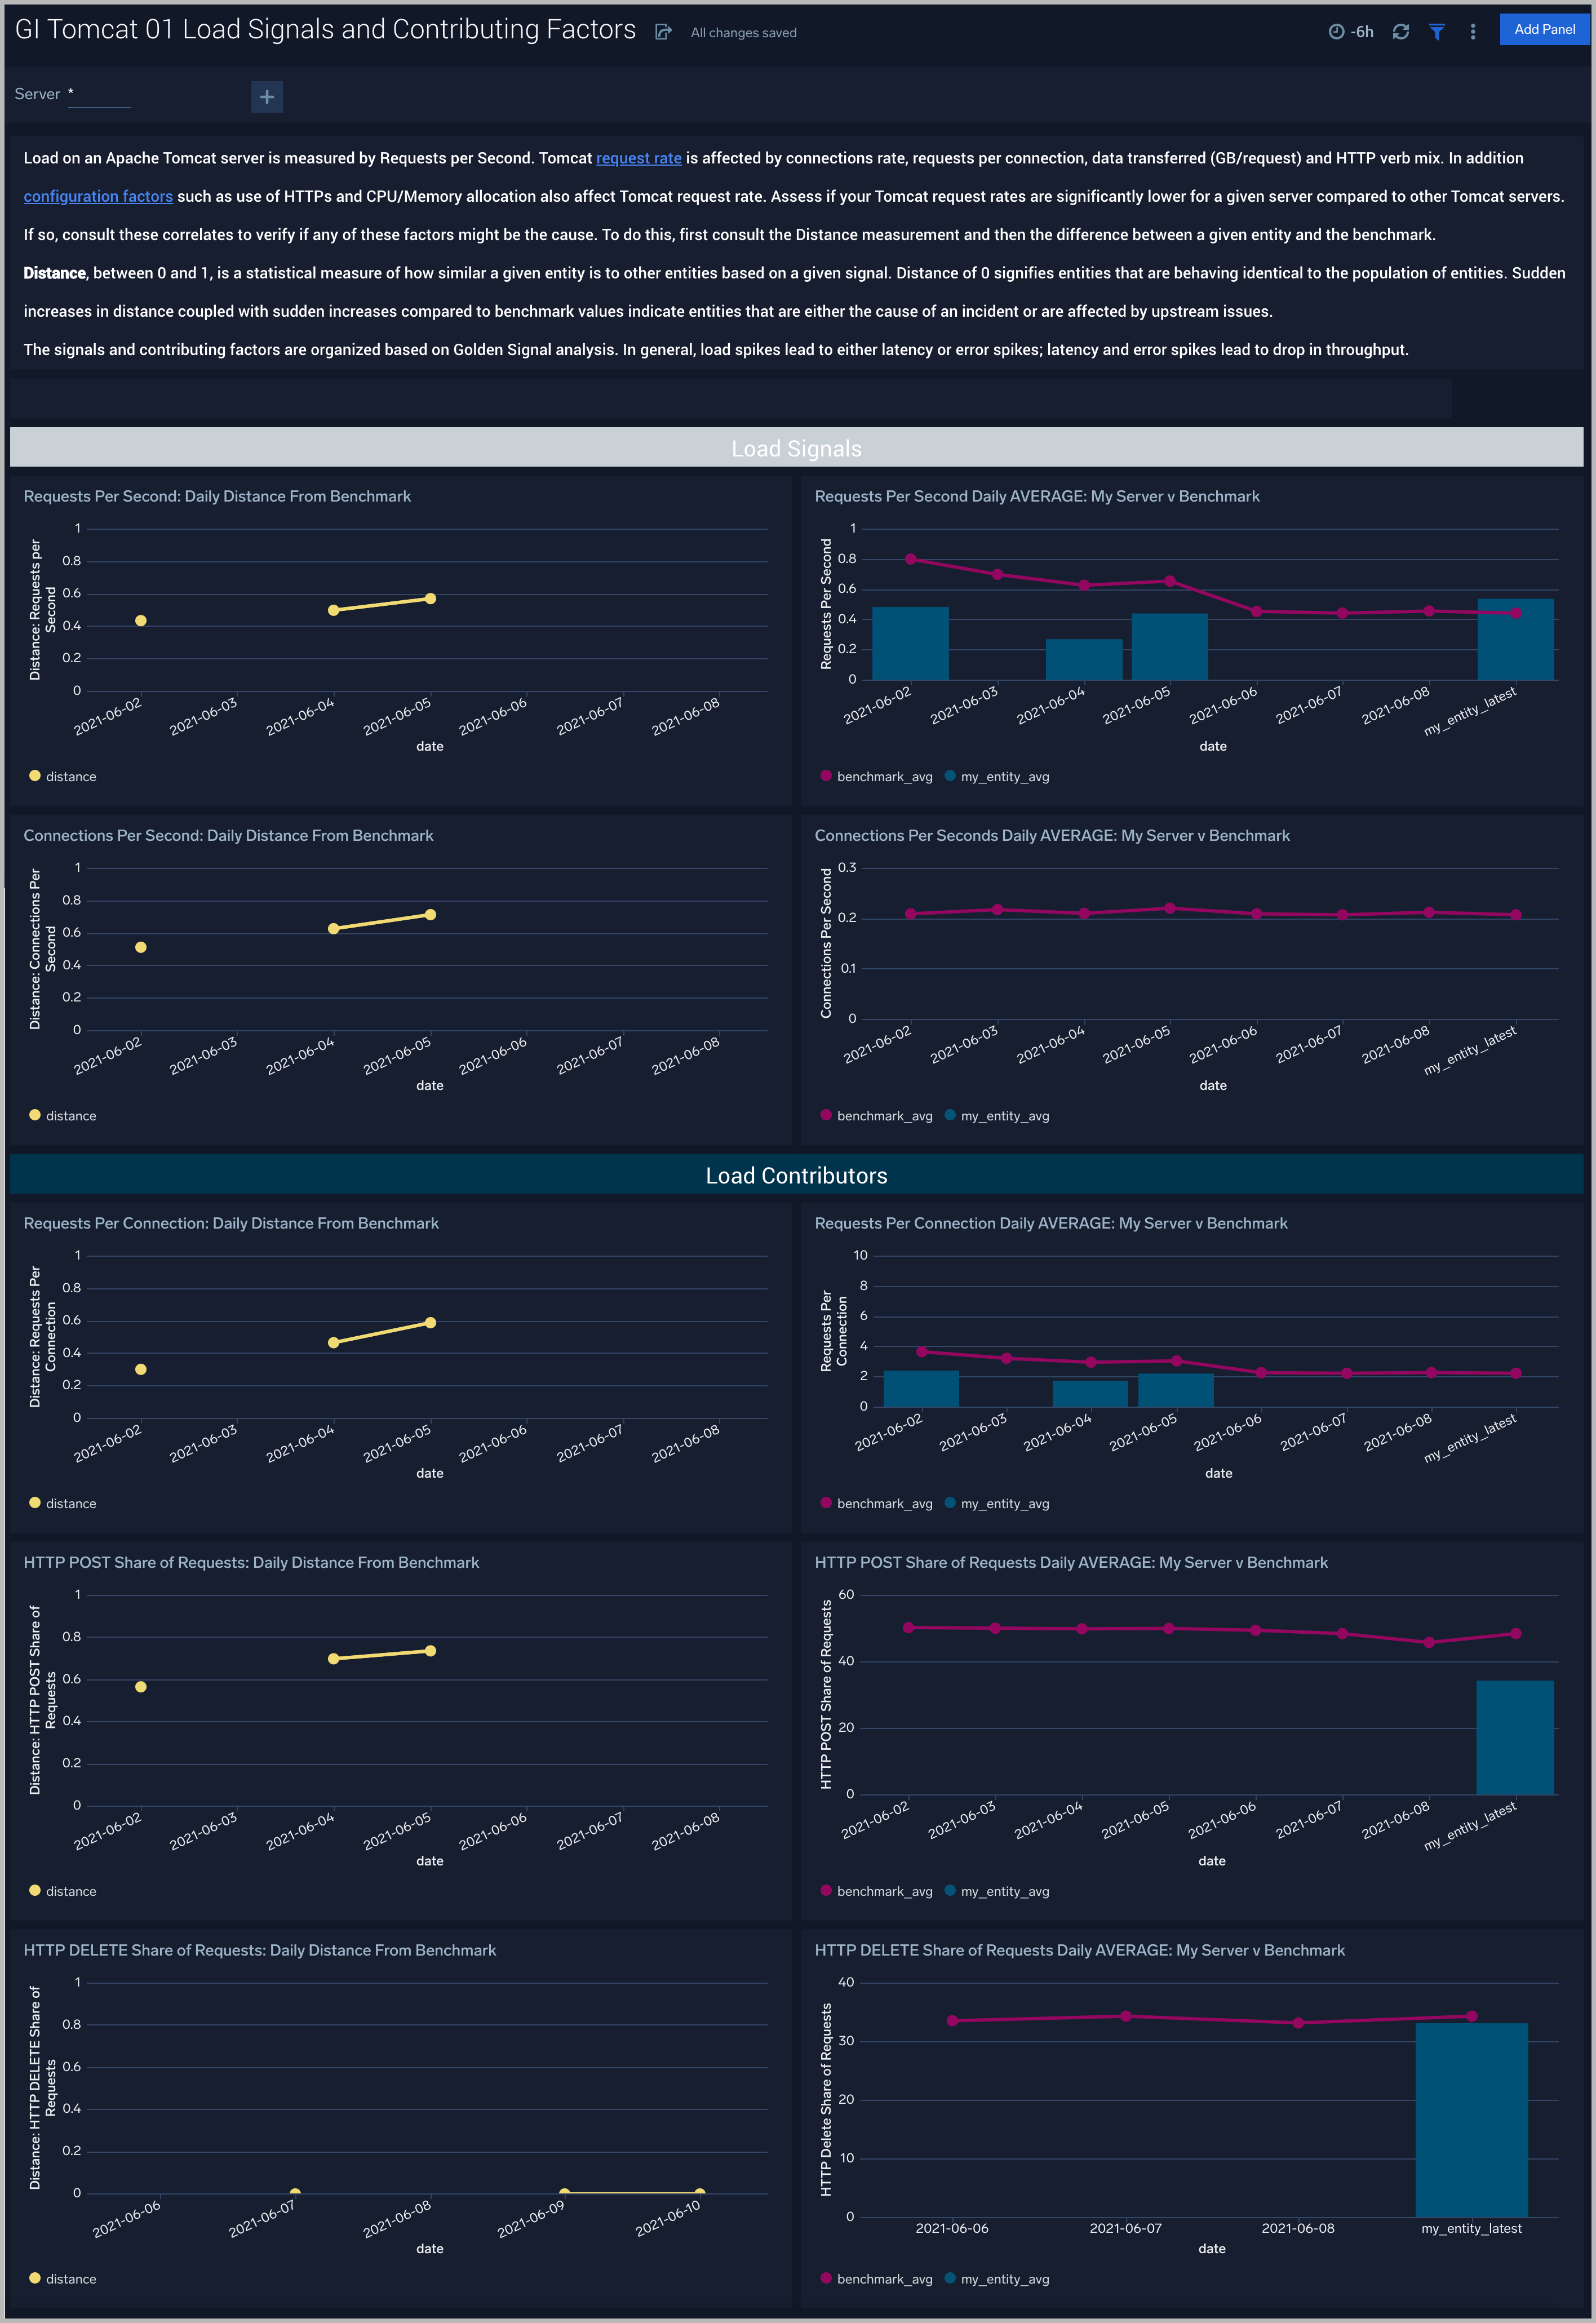
Load Signals and Contributing Factors
The GI Apache Tomcat - 01 Load Signals and Contributing Factors dashboard compares the golden signal of load (requests per second) for a company’s Apache Tomcat servers to other servers. These signals are impacted by connections per second, requests per connection and share of HTTP POST/DELETE requests. These causal signals are also compared to the population of Apache Tomcat servers. Use this dashboard to analyze unusual load spikes and the reasons for them.
Use this dashboard to:
- analyze unusual load spikes and the reasons for them. Load on an Apache Tomcat server is measured by Requests per Second. Apache Tomcat request rate is affected by connection rate, requests per connection, data transferred (GB/request), BOT activity and HTTP verb mix. In addition configuration factors such as use of HTTPs and CPU/Memory allocation also affect Apache Tomcat request rate. Assess if your Apache Tomcat request rates are significantly lower for a given server compared to other Apache Tomcat servers. If so, consult these correlates to verify if any of these factors might be the cause. To do this, first consult the Distance measurement and then the difference between a given entity and the benchmark
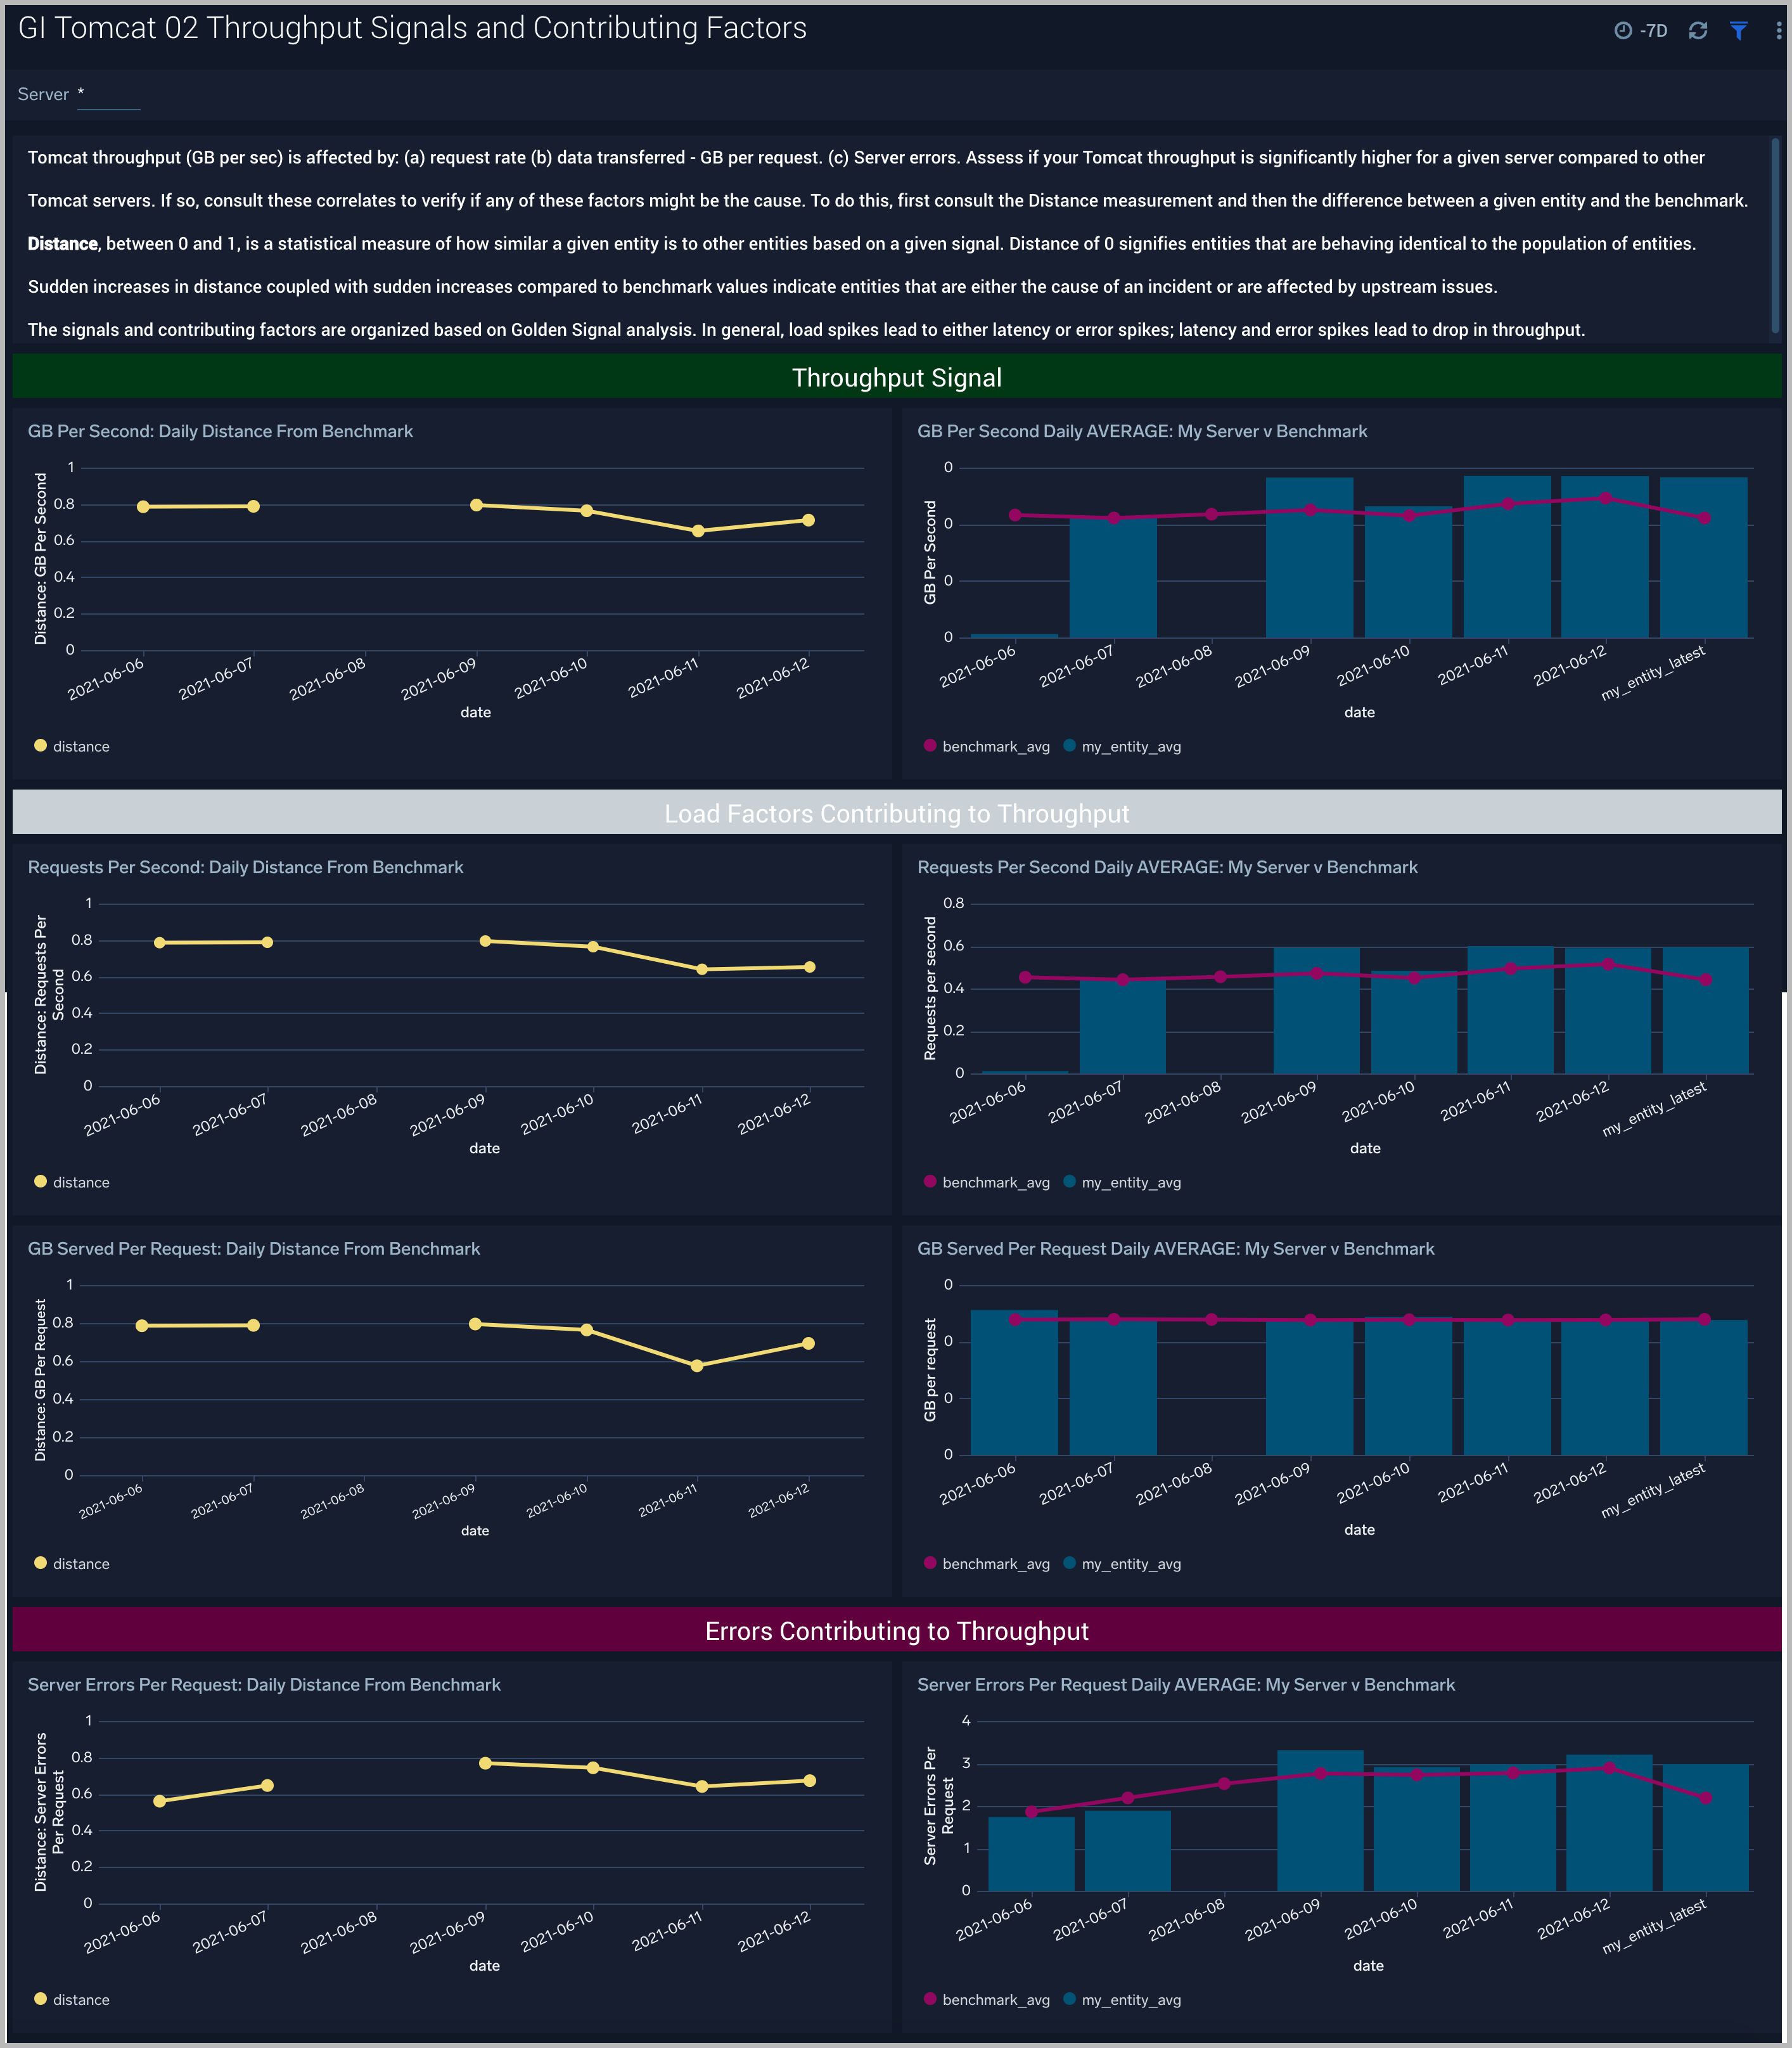
Throughput Signals and Contributing Factors
The GI Apache Tomcat - 02 Throughput Signals and Contributing Factors dashboard compares the golden signal of throughput (GB per second) for a company’s Apache Tomcat servers to other servers. These signals are impacted by requests per second, GB per request and error rate. These causal signals are also compared to the population of Apache Tomcat servers. Use this dashboard to assess unusual throughput drops and the reasons for them such as increased errors or load spikes.
Use this dashboard to:
- Assess if your Apache Tomcat throughput is significantly lower for a given server compared to other Apache Tomcat servers. If so, analyze the request rate, GB per request and server errors to verify if any of these factors might be the cause. To do this, first consult the Distance measurement and then the difference between a given entity and the benchmark. Sudden increases in distance coupled with sudden increases compared to benchmark values indicate entities that are either the cause of an incident or are affected by upstream issues.
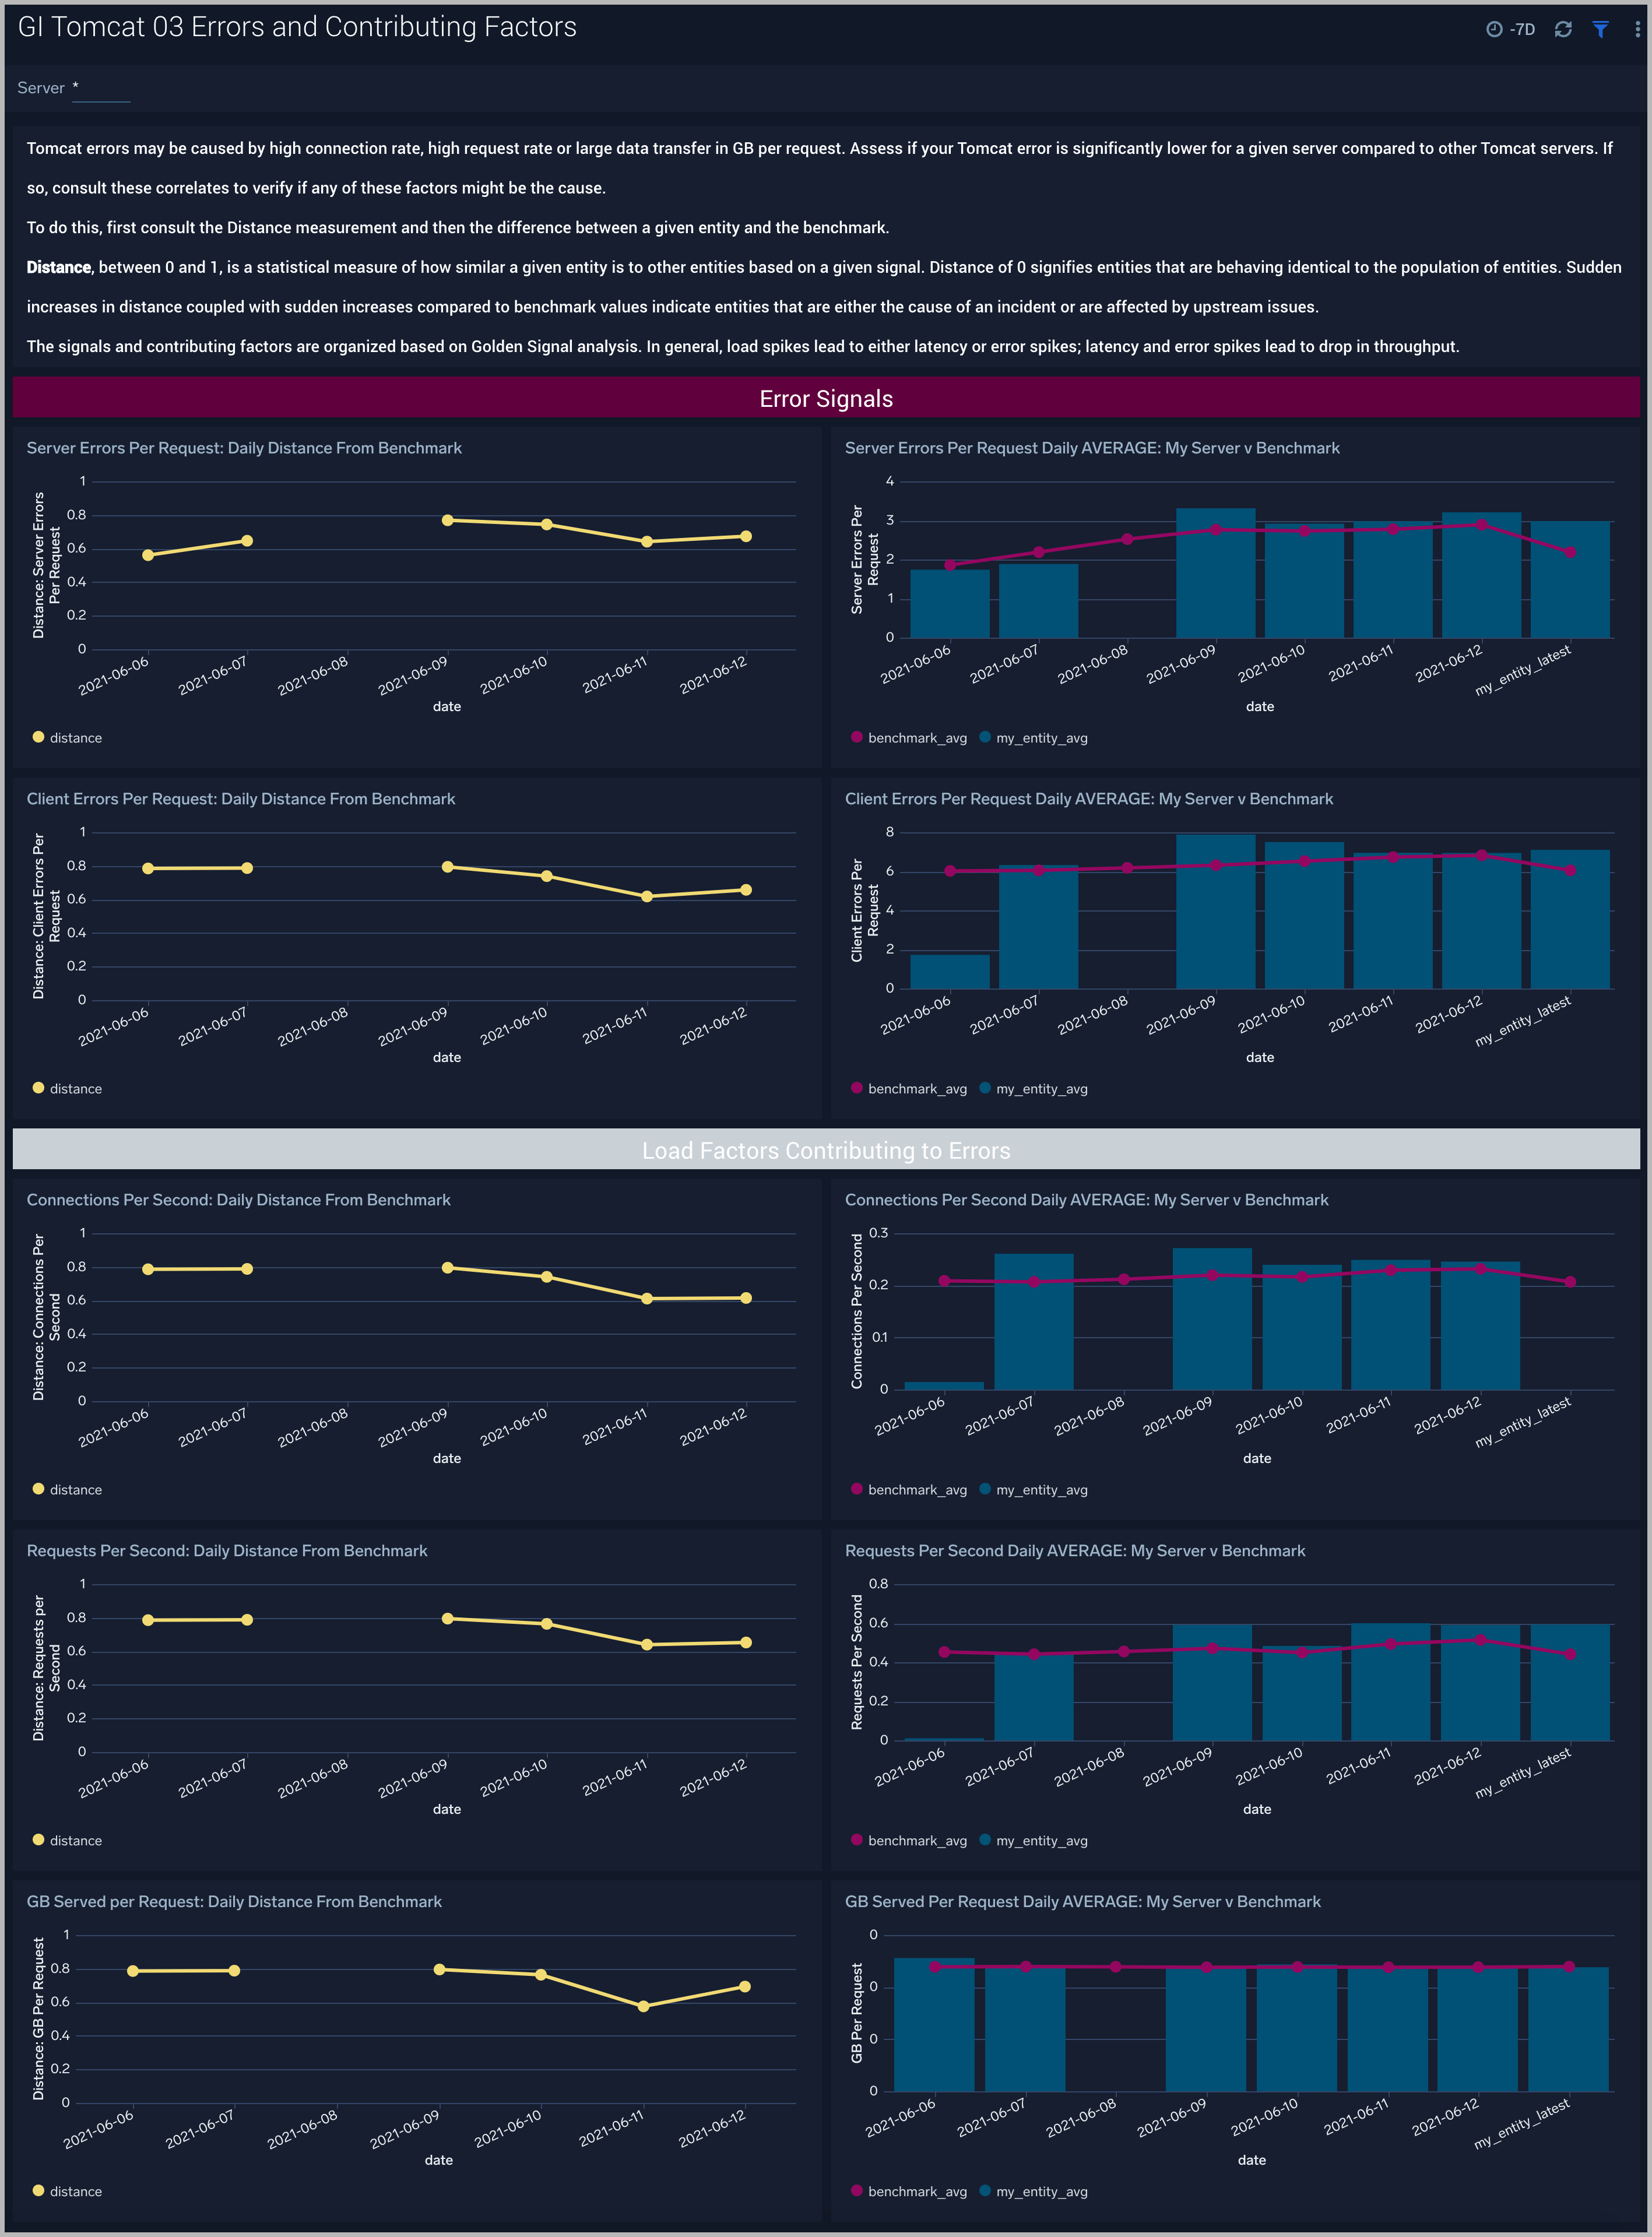
Errors and Contributing Factors
The GI Apache Tomcat - 03 Errors and Contributing Factors dashboard compares the golden signal of error rate for a company’s Apache Tomcat servers to other servers. These signals are impacted by requests per second, connections per second and GB per request. These causal signals are also compared to the population of Apache Tomcat servers. Use this dashboard to assess unusual increases in error rate and the reasons for them such as increased load.
Use this dashboard to:
- assess unusual increases in error rate and the reasons for them. Apache Tomcat errors may be caused by high request rate, high request rate or large data transfer in GB per request. Analyze the request rate, GB per request and server errors to verify if any of these factors might be the cause. To do this, first consult the Distance measurement and then the difference between a given entity and the benchmark. Sudden increases in distance coupled with sudden increases compared to benchmark values indicate entities that are either the cause of an incident or are affected by upstream issues.
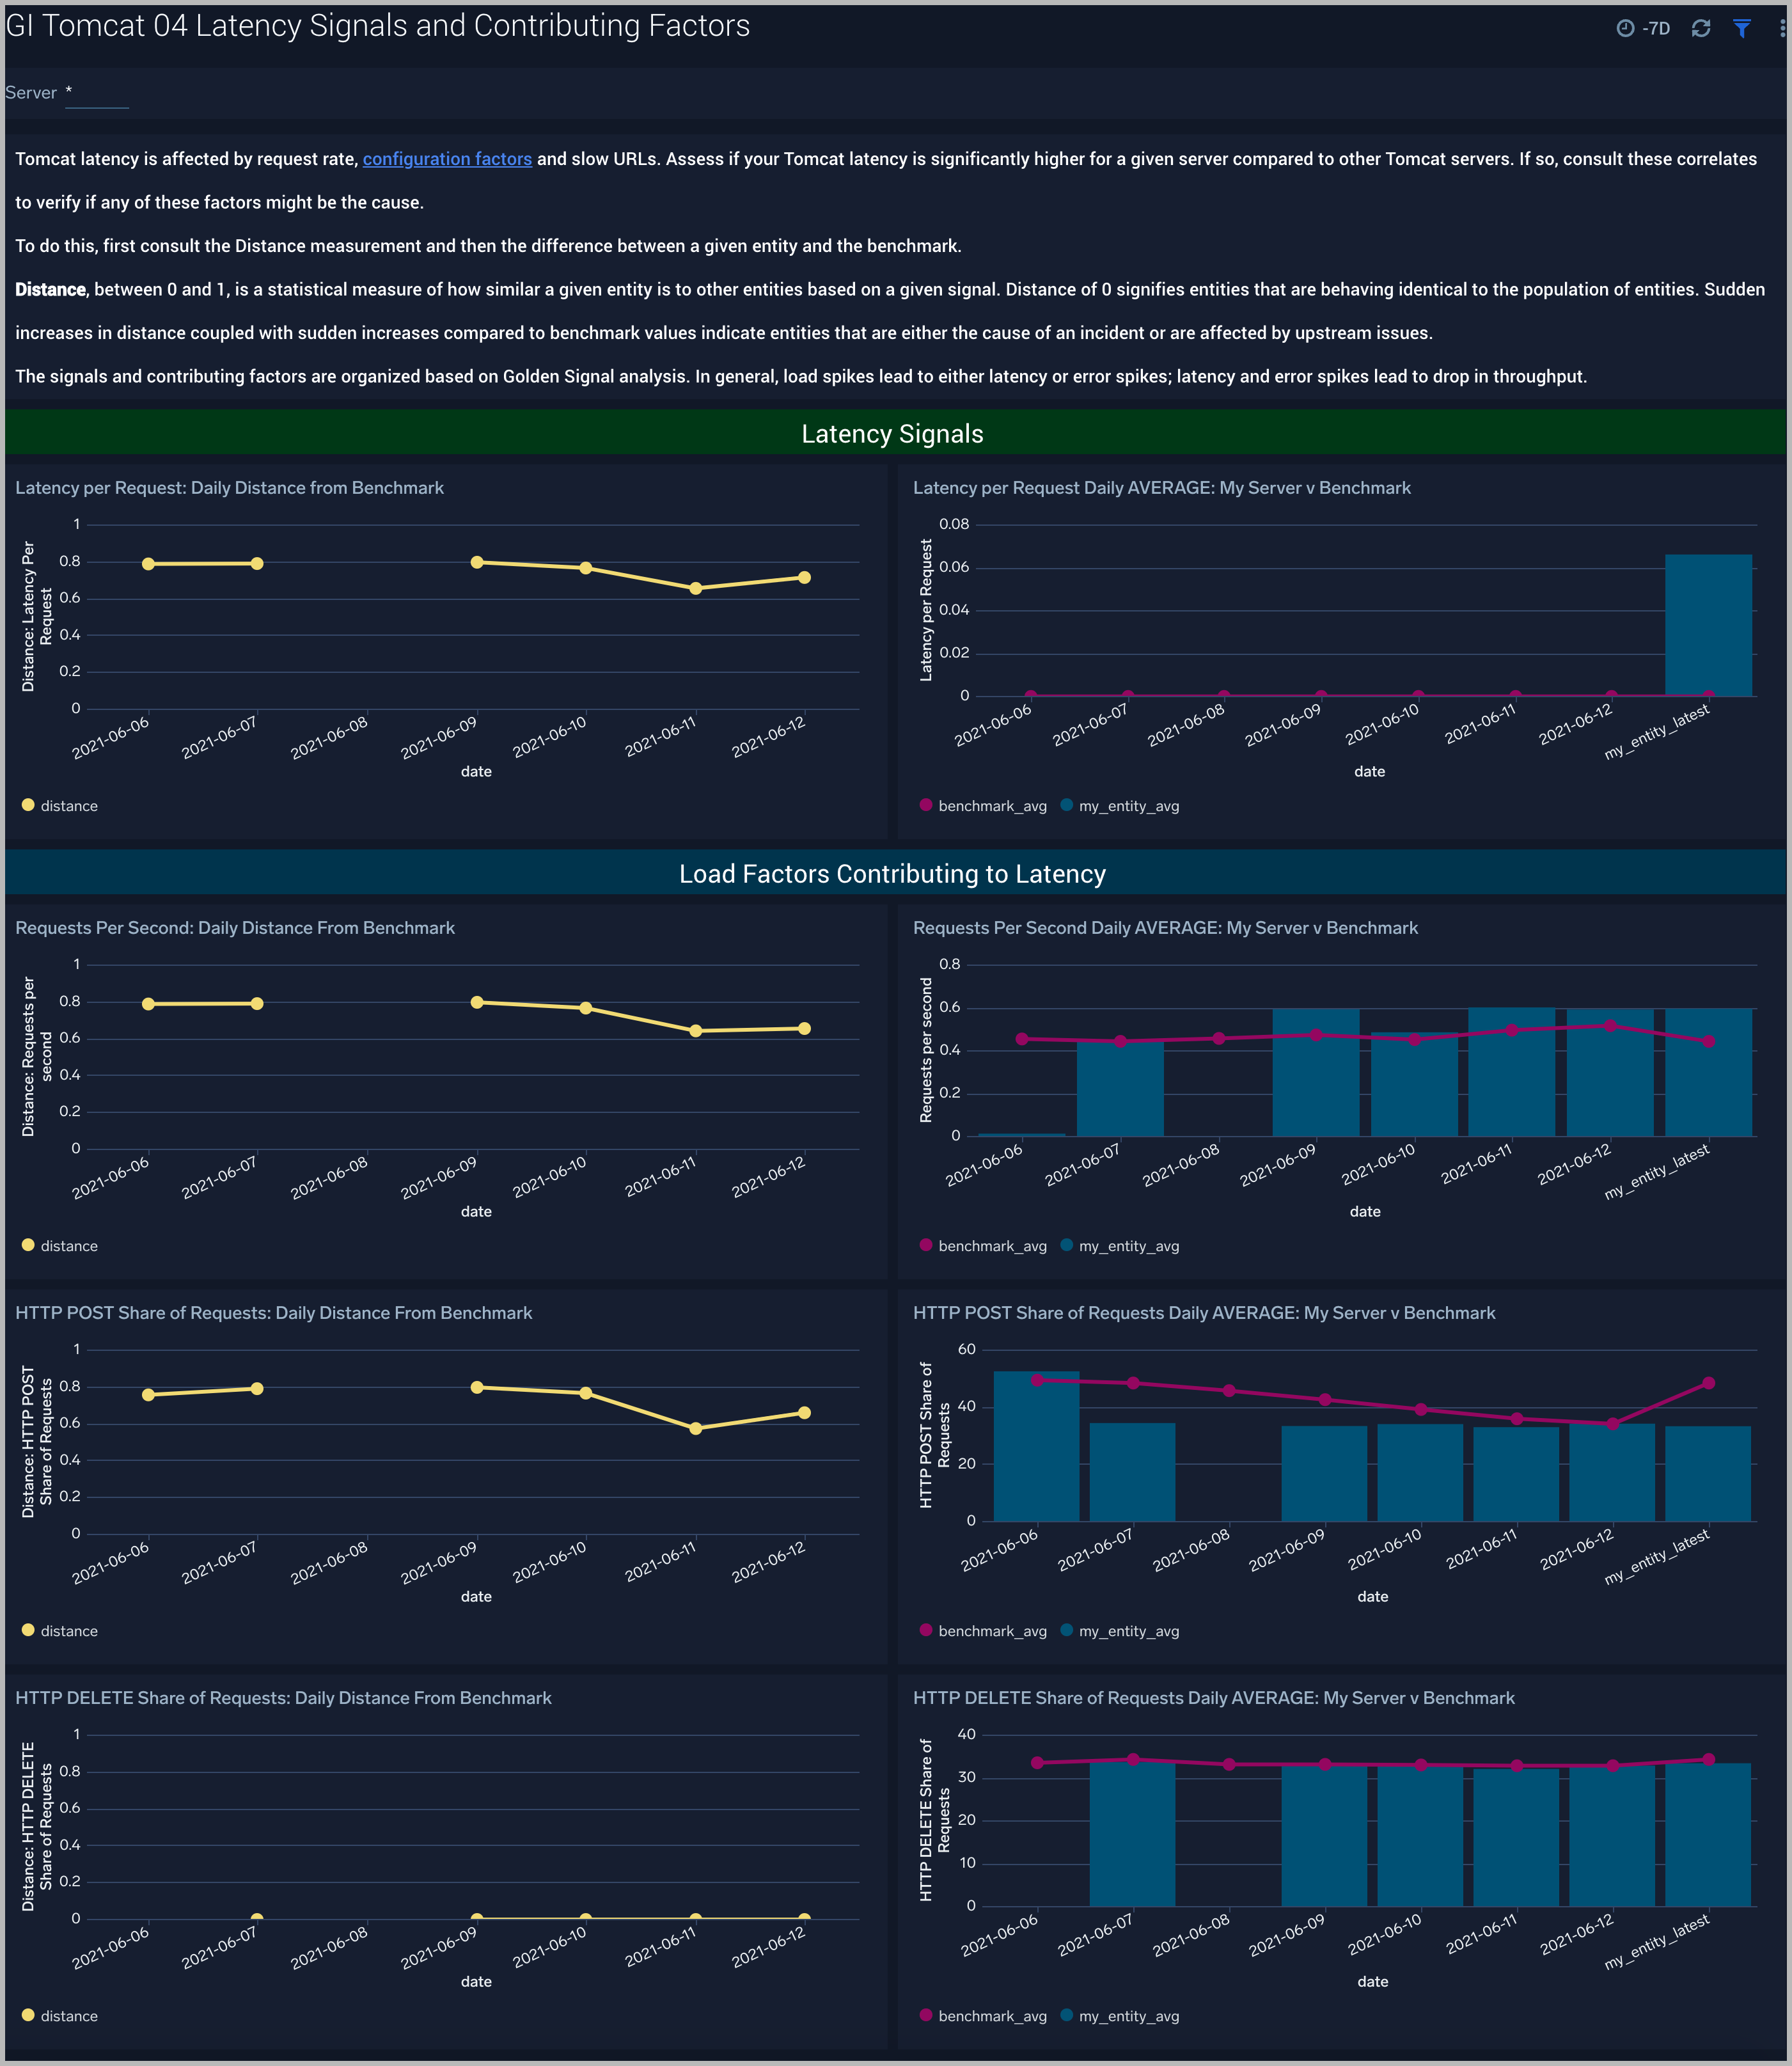
Latency Signals and Contributing Factors
The GI Apache Tomcat - 04 Latency Signals and Contributing Factors dashboard compares the golden signal of latency for a company’s Apache Tomcat servers to other servers. These signals are impacted by requests per second and HTTP POST/DELETE share of requests. These causal signals are also compared to the population of Apache Tomcat servers. Use this dashboard to assess unusual latency increases and the reasons for them such as increased load.
Use this dashboard to:
- assess unusual latency increases and the reasons for them such as increased load. Analyze the request rate and HTTP POST/DELETE mix of requests to verify if any of these factors might be the cause. To do this, first consult the Distance measurement and then the difference between a given entity and the benchmark. Sudden increases in distance coupled with sudden increases compared to benchmark values indicate entities that are either the cause of an incident or are affected by upstream issues.