Install the Global Intelligence for Nginx App and View the Dashboards
This section has instructions for installing the Sumo Logic App for Global Intelligence for Nginx and descriptions of each of the app dashboards.
Dashboard Filters
Each dashboard has a set of filters that you can apply to the entire dashboard, as shown in the following example. Click the funnel icon in the top dashboard menu bar to display a scrollable list of filters that are applied across the entire dashboard.
You can use filters to drill down and examine the data on a granular level. One server must be selected for benchmark comparisons to be meaningful.

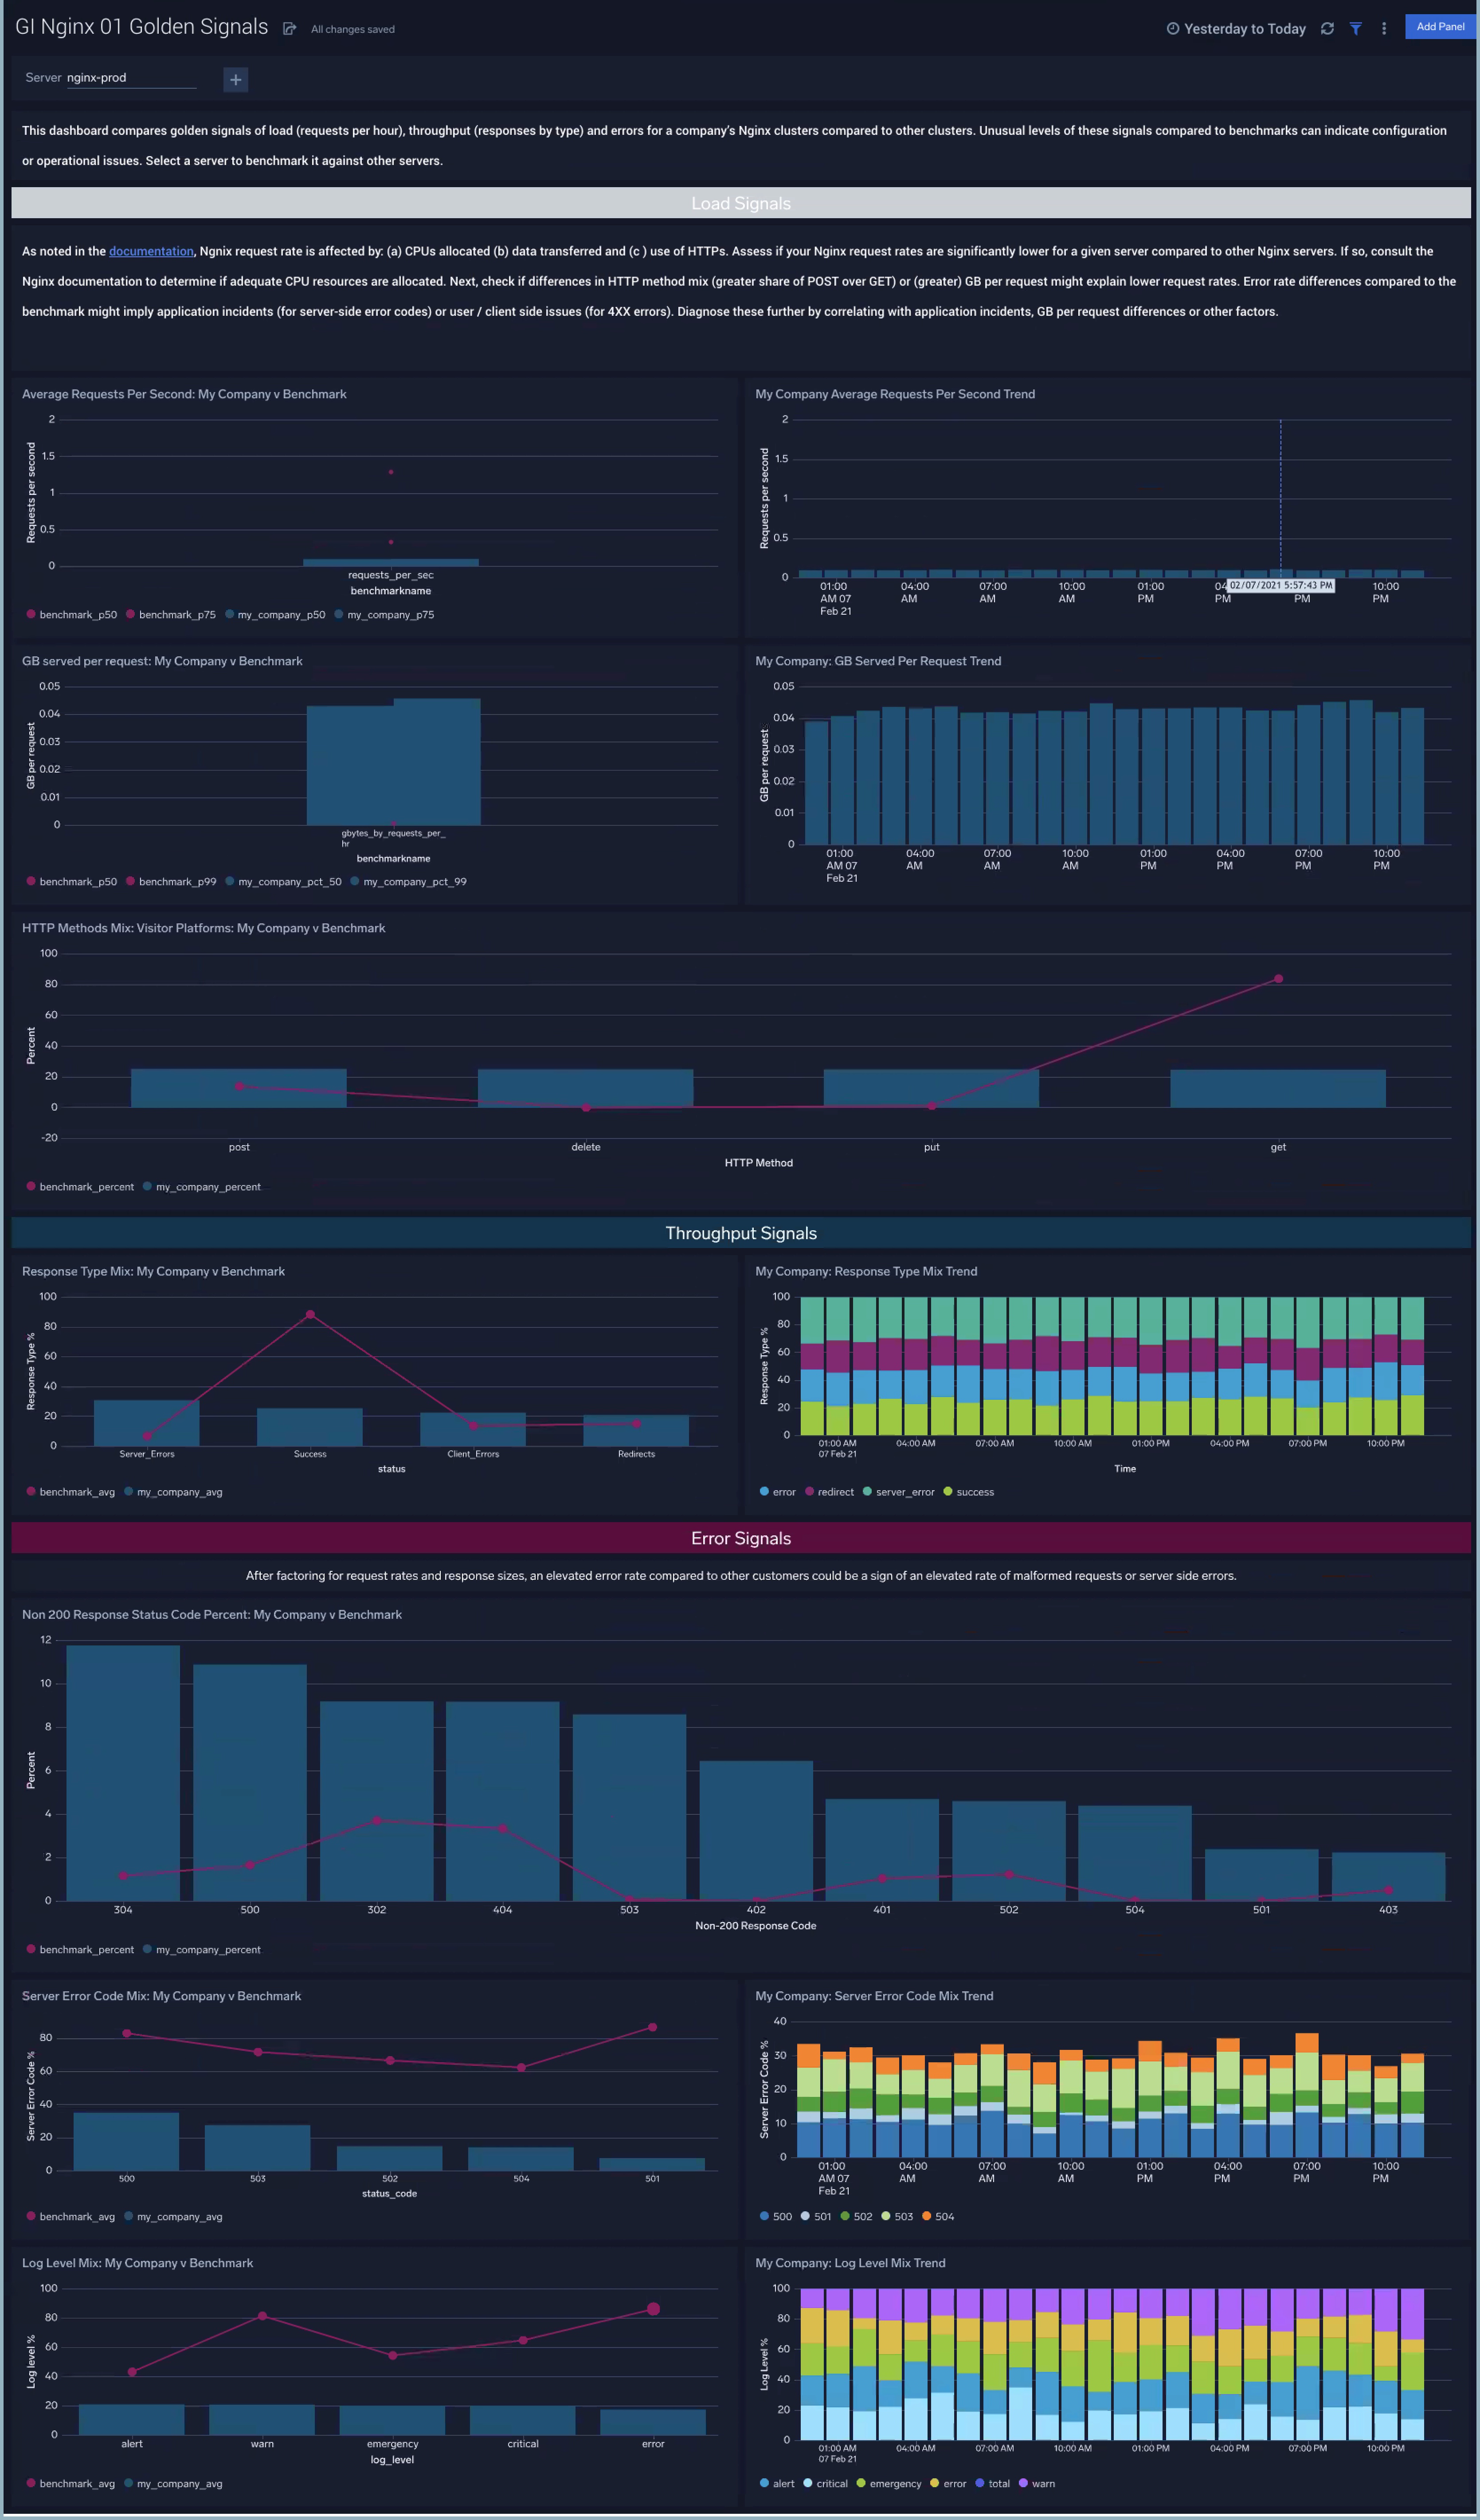
GI Nginx - 01 Golden Signals
The GI Nginx - 01 Golden Signals dashboard tabulates requests per second, HTTP method mix, GB per request, response types (success, error, redirect) per request, and errors in your company’s Nginx servers and compares them to all servers from all customers. Filter results by nginx server to profile a given server against all Nginx servers in the Sumo Logic customer base. If your stats are different compared to the benchmark, it is a strong signal that your Nginx cluster’s load profile is different or is incorrectly provisioned compared to request load when compared to other customers. Refer to https://www.nginx.com/blog/testing-t...s-web-servers/ to validate your nginx configuration relative to load configuration.
Use this dashboard to:
- Compare requests per second, HTTP method mix and GB per request along with response types, errors and log levels distribution for your company’s Nginx servers versus all servers.
- As noted here, Ngnix request rate is affected by: (a) CPUs allocated (b) data transferred and (c ) use of HTTPs. Assess if your Nginx request rates are significantly lower for a given server compared to other Nginx. If so, consult the Nginx documentation to determine if adequate CPU resources are allocated. Next, check if differences in HTTP method mix (greater share of POST over GET) or (greater) GB per request might explain lower request rates. Error rate differences compared to the benchmark might imply application incidents (for server-side error codes) or user / client side issues (for 4XX errors). Diagnose these further by correlating with application incidents, GB per request differences or other factors.
- Use the trend line panels for request rate, GB per request and errors to understand if your Nginx errors have a temporal pattern that might help explain differences compared to benchmarks.
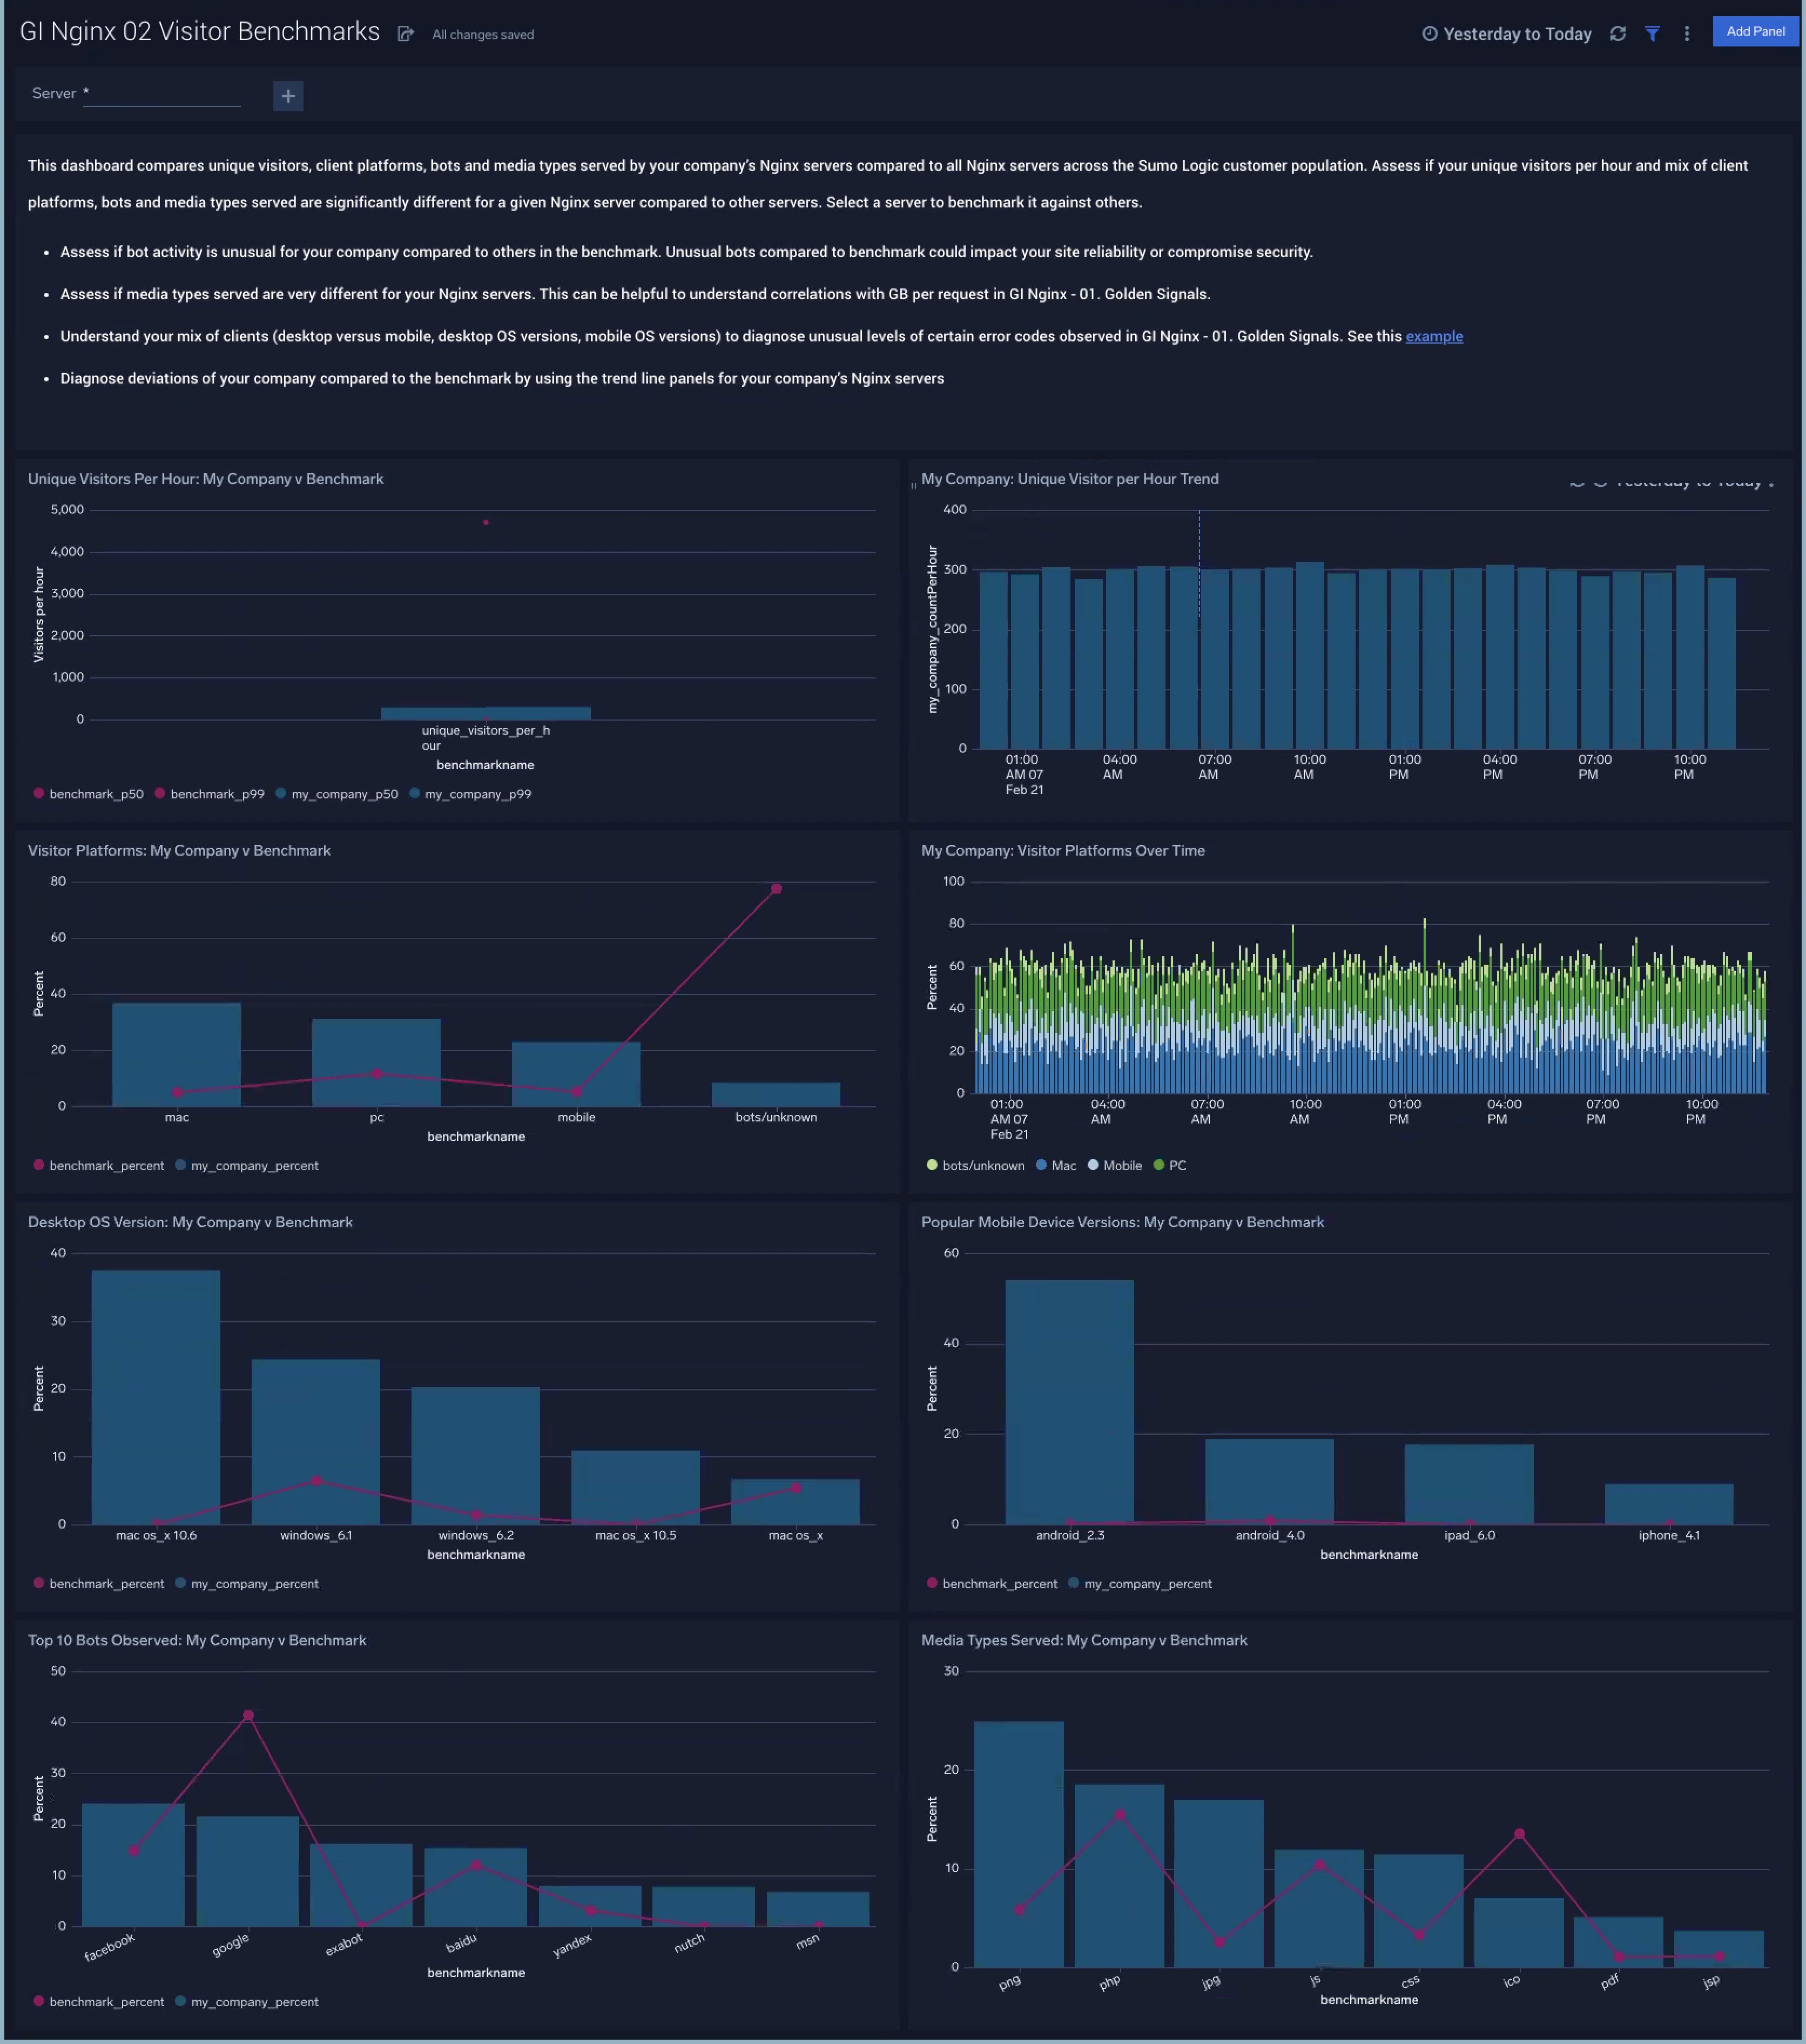
GI Nginx - 02 Visitor Benchmarks
The GI Nginx - 02 Visitor dashboard compares unique visitors, client platforms, bots and media types served by your company’s Nginx servers compared to all Nginx servers across the Sumo Logic customer population.
Use this dashboard to:
- Assess if your unique visitors per hour and mix of client platforms, bots and media types served are significantly different for a given Nginx server compared to other servers.
- Assess if bot activity is unusual for your company compared to others in the benchmark. Unusual bots compared to benchmark could impact your site reliability or compromise security.
- Assess if media types served are very different for your Nginx servers. This can be helpful to understand correlations with GB per request in GI Nginx - 01 Golden Signals.
- Understand your mix of clients (desktop versus mobile, desktop OS versions, mobile OS versions) to diagnose unusual levels of certain error codes observed in GI Nginx - 01 Golden Signals. See this example.
- Diagnose deviations of your company compared to the benchmark by using the trend line panels for your company’s Nginx servers