Collect Logs and Metrics for the Oracle App
This section provides instructions for configuring log and metric collection for the Sumo Logic App for the Oracle App.
Step 1: Configure Fields in Sumo Logic
Create the following Fields in Sumo Logic prior to configuring the collection. This ensures that your logs and metrics are tagged with relevant metadata, which is required by the app dashboards. For information on setting up fields, see Sumo Logic Fields.
This step is not needed if you are using the application components solution terraform script.
- Kubernetes environments
- Non-Kubernetes environments
If you're using Oracle in a Kubernetes environment, create the fields:
pod_labels_componentpod_labels_environmentpod_labels_db_systempod_labels_db_clusterpod_labels_db_cluster_addresspod_labels_db_cluster_port
If you're using Oracle in a non-Kubernetes environment, create the fields:
componentenvironmentdb_systemdb_clusterdb_cluster_addressdb_cluster_port`
Step 2: Configure Oracle Logs and Metrics Collection
Sumo Logic supports the collection of logs and metrics data from Oracle in both Kubernetes and non-Kubernetes environments.
Click on the appropriate links based on the environment where your Oracle clusters are hosted.
- Kubernetes environments
- Non-Kubernetes environments
For Kubernetes environments
In Kubernetes environments, we use the Telegraf Operator, which is packaged with our Kubernetes collection. You can learn more about it here. The diagram below illustrates how data is collected from Oracle in Kubernetes environments. In the architecture shown below, there are four services that make up the metric collection pipeline: Telegraf, Prometheus, Fluentd, and FluentBit.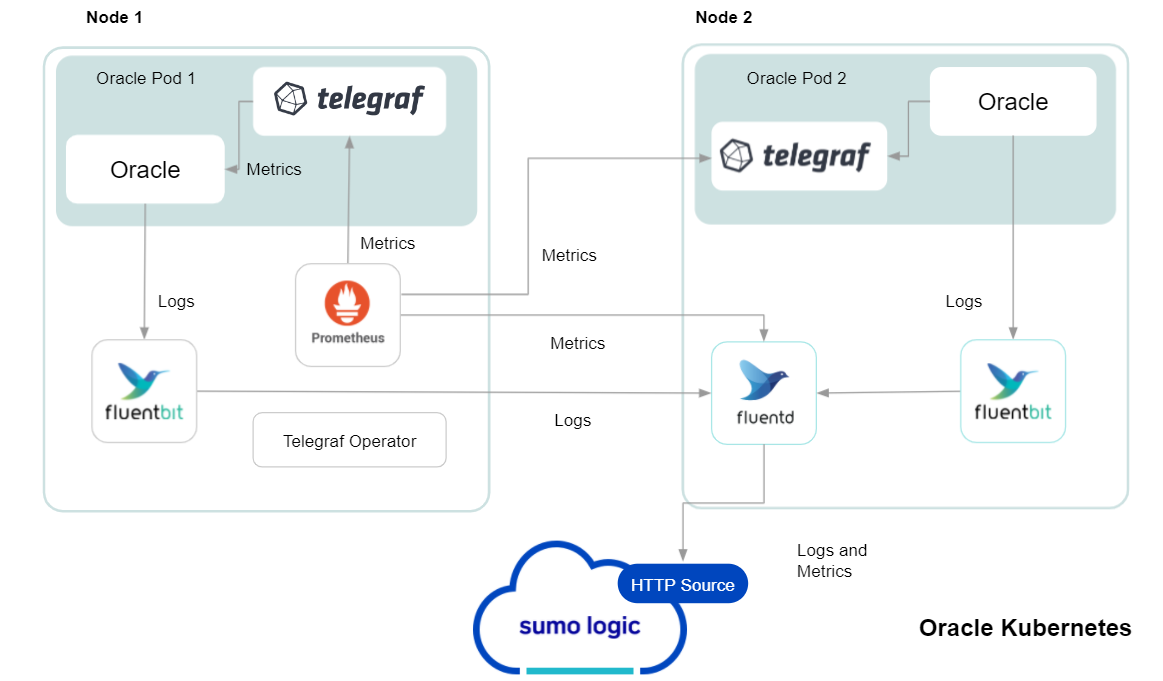
The first service in the pipeline is Telegraf. Telegraf collects metrics from Oracle. Note that we’re running Telegraf in each pod we want to collect metrics from as a sidecar deployment: i.e. Telegraf runs in the same pod as the containers it monitors. Telegraf uses the exec input plugin to obtain metrics. (For simplicity, the diagram doesn’t show the input plugins.) The injection of the Telegraf sidecar container is done by the Telegraf Operator. We also have Fluentbit that collects logs written to standard out and forwards them to FluentD, which in turn sends all the logs and metrics data to a Sumo Logic HTTP Source.
Follow the below instructions to set up the metric collection:
- Configure Metrics Collection
- Configure Oracle pod to send Oracle metrics to Sumo Logic
- Setup Kubernetes Collection with the Telegraf operator
- Add annotations on your Oracle pods
- Configure Logs Collection 4. Configure logging in Oracle. 5. Add labels on your Oracle pods to capture logs from standard output. 6. Collecting Oracle Logs from a Log file.
Prerequisites
It’s assumed that you are using the latest helm chart version. If not, upgrade using the instructions here.
Configure Metrics Collection
This section explains the steps to collect Oracle metrics from a Kubernetes environment.
In Kubernetes environments, we use the Telegraf Operator, which is packaged with our Kubernetes collection. You can learn more about this here. Follow the steps listed below to collect metrics from a Kubernetes environment:
Step 1. Configure Oracle pod to send metrics to Sumo Logic
We use custom Python script which sends Oracle metrics into Sumo Logic as mentioned here. There are two methods to execute the script in pod:
- Use Config Map to execute the script.
- Modify existing dockerfile and update the Pod definition:
FROM python:3.7
RUN pip install cx_Oracle
# Install Oracle Client
ENV ORACLE_HOME=/opt/oracle
ENV LD_LIBRARY_PATH=$LD_LIBRARY_PATH:$ORACLE_HOME/lib
RUN wget https://dl.influxdata.com/telegraf/r....4-1_amd64.deb \
    && dpkg -i telegraf_1.20.4-1_amd64.deb
RUN apt-get update && apt-get install -y libaio1 && rm -rf /var/lib/apt/lists/* \
 && wget -q https://download.oracle.com/otn_soft....0.0.0dbru.zip \
 && unzip instantclient-*.zip \
 && mkdir -p $ORACLE_HOME \
 && mv instantclient_19_6 $ORACLE_HOME/lib \
 && rm -f instantclient-*.zip
COPY sumo_oracle_metrics.py /app/
COPY exec_oracle_metrics.sh /app/
RUN chmod +x entrypoint.sh && chmod +x /tmp/exec_oracle_metrics.sh
CMD ["telegraf"]
Step 2. Setup Kubernetes Collection with the Telegraf Operator.
Step 3. Add annotations on your Oracle pods On your Oracle Pods, add the following annotations:
annotations:
    telegraf.influxdata.com/class: sumologic-prometheus
    prometheus.io/scrape: "true"
    prometheus.io/port: "9273"
    telegraf.influxdata.com/inputs: |+
        [[inputs.exec]]
          commands = ["/path_TO_BE_CHANGEME/exec_oracle_metrics.sh"]
          timeout = "5s"
          data_format = "influx"
          [inputs.exec.tags]
          environment="dev_ENV_TO_BE_CHANGED"
           component="database"
           db_system="oracle"
           db_cluster="oracle_on_premise_ENV_TO_BE_CHANGED"
           db_cluster_address = "ENV_TO_BE_CHANGED"
           db_cluster_port = "ENV_TO_BE_CHANGED"
If you haven’t defined a cluster in Oracle, then enter default for db_cluster.
Enter in values for the following parameters (marked ENV_TO_BE_CHANGED in the snippet above):
telegraf.influxdata.com/inputs- This contains the required configuration for the Telegraf exec Input plugin. Please refer to this doc for more information on configuring the Oracle input plugin for Telegraf. Note: As telegraf will be run as a sidecar the host should always be localhost.In the input plugins section i.e. :
- commands - The exec plugin executes all the commands in parallel on every interval and parses metrics from their output in any one of the accepted Input Data Formats.
In the tags section
[inputs.exec.tags]:* `environment` - This is the deployment environment where the Oracle cluster identified by the value of **servers** resides. For example: dev, prod or qa. While this value is optional we highly recommend setting it.
* `db_cluster` - Enter a name to identify this Oracle cluster. This cluster name will be shown in the Sumo Logic dashboards.
* `db_cluster_address` - Enter the cluster hostname or ip address that is used by the application to connect to the database. It could also be the load balancer or proxy endpoint.
* `db_cluster_port` - Enter the database port. If not provided, a default port will be used.
:::note
`db_cluster_address` and `db_cluster_port` should reflect exact configuration of DB client configuration in your application, especially if you instrument it with OT tracing. The values of these fields should match exactly the connection string used by the database client (reported as values for net.peer.name and net.peer.port metadata fields).
For example if your application uses `“oracle-prod.sumologic.com:3306”` as the connection string, the field values should be set as follows: `db_cluster_address=oracle-prod.sumologic.com db_cluster_port=3306`
If your application connects directly to a given oracle node, rather than the whole cluster, use the application connection string to override the value of the “host” field in the Telegraf configuration: `host=oracle-prod.sumologic.com`
Pivoting to Tracing data from Entity Inspector is possible only for “Oracle address” Entities.
:::Do not modify the following values as they will cause the Sumo Logic apps to not function correctly.
telegraf.influxdata.com/class: sumologic-prometheus- This instructs the Telegraf operator what output to use. This should not be changed.prometheus.io/scrape: "true"- This ensures our Prometheus will scrape the metrics.prometheus.io/port: "9273"- This tells prometheus what ports to scrape on. This should not be changed.telegraf.influxdata.com/inputsIn the tags section [inputs.exec.tags]
* `component: “database”` - This value is used by Sumo Logic apps to identify application components.
* `db_system: “oracle”` - This value identifies the database system.
For all other parameters, see this doc for more parameters that can be configured in the Telegraf agent globally.
Sumo Logic Kubernetes collection will automatically start collecting metrics from the pods having the labels and annotations defined in the previous step.
Verify metrics in Sumo Logic.
Configure Logs Collection
This section explains the steps to collect Oracle logs from a Kubernetes environment.
(Recommended Method) Add labels on your Oracle pods to capture logs from standard output.
Make sure that the logs from Oracle are sent to stdout. Follow the instructions below to capture Oracle logs from stdout on Kubernetes.
Apply following labels to the Oracle pod
labels:
    environment: "prod_ENV_TO_BE_CHANGED"
    component: "database"
    db_system: "oracle"
    db_cluster "Cluster_ENV_TO_BE_CHANGED"
    db_cluster_address = "ENV_TO_BE_CHANGED"
    db_cluster_port = "ENV_TO_BE_CHANGED"
Enter in values for the following parameters (marked in ENV_TO_BE_CHANGED above):
environment- This is the deployment environment where the Oracle cluster identified by the value of servers resides. For example:- dev, prod, or QA. While this value is optional we highly recommend setting it.db_cluster- Enter a name to identify this Oracle cluster. This cluster name will be shown in the Sumo Logic dashboards. If you haven’t defined a cluster in Oracle, then enter ‘default’ fordb_cluster.db_cluster_address- Enter the cluster hostname or ip address that is used by the application to connect to the database. It could also be the load balancer or proxy endpoint.db_cluster_port- Enter the database port. If not provided, a default port will be used.notedb_cluster_addressanddb_cluster_portshould reflect the exact configuration of DB client configuration in your application, especially if you instrument it with OT tracing. The values of these fields should match exactly the connection string used by the database client (reported as values for net.peer.name and net.peer.port metadata fields).
For example, if your application uses “oracle-prod.sumologic.com:3306” as the connection string, the field values should be set as follows: db_cluster_address=oracle-prod.sumologic.com db_cluster_port=3306
If your application connects directly to a given oracle node, rather than the whole cluster, use the application connection string to override the value of the “host” field in the Telegraf configuration: host=oracle-prod.sumologic.com
Pivoting to Tracing data from Entity Inspector is possible only for “Oracle address” Entities. ::: Do not modify the following values as they will cause the Sumo Logic apps to not function correctly.
component: “database”- This value is used by Sumo Logic apps to identify application components.db_system: “oracle”- This value identifies the database system.For all other parameters, see this doc for more parameters that can be configured in the Telegraf agent globally.
- The Sumologic-Kubernetes-Collection will automatically capture the logs from stdout and will send the logs to Sumologic. For more information on deploying Sumologic-Kubernetes-Collection, visit here.
- Verify logs in Sumo Logic.
- (Optional) Collecting Oracle Logs from a Log File Follow the steps below to capture Oracle logs from a log file on Kubernetes.
- Determine the location of the Oracle log file on Kubernetes. This can be determined from the Oracle.conf for your Oracle cluster along with the mounts on the Oracle pods.
- Install the Sumo Logic tailing sidecar operator.
- Add the following annotation in addition to the existing annotations.
annotations:
  tailing-sidecar: sidecarconfig;<mount>:<path_of_Oracle_log_file>/<SQLserver_log_file_name>
Example:
annotations:
  tailing-sidecar: sidecarconfig;data:/var/opt/oracle/errorlog
- Make sure that the Oracle pods are running and annotations are applied by using the command:
kubectl describe pod <Oracle_pod_name>
- Sumo Logic Kubernetes collection will automatically start collecting logs from the pods having the annotations defined above.
- Verify logs in Sumo Logic.
- Add an FER to normalize the fields in Kubernetes environments. This step is not needed if one is using application components solution terraform script. Labels created in Kubernetes environments automatically are prefixed with pod_labels. To normalize these for our app to work, we need to create a Field Extraction Rule if not already created for Proxy Application Components. To do so:
- Go to Manage Data > Logs > Field Extraction Rules.
- Click the + Add button on the top right of the table. The Add Field Extraction Rule** form will appear.
Enter the following options:
Rule Name. Enter the name as App Observability - database.
Applied At. Choose Ingest Time.
Scope. Select Specific Data.
Scope: Enter the following keyword search expression.
```sql
pod_labels_environment=* pod_labels_component=database pod_labels_db_cluster=* pod_labels_db_system=*
```
Parse Expression. Enter the following parse expression.
      ```sql
      if (!isEmpty(pod_labels_environment), pod_labels_environment, "") as environment
      | pod_labels_component as component
      | pod_labels_db_system as db_system
      | if(!isEmpty(pod_labels_db_cluster), pod_labels_db_cluster, null) as db_cluster
      ```
- Click Save to create the rule.
For Non-Kubernetes environments
Sumo Logic uses the Telegraf operator for Oracle metric collection and the Installed Collector for collecting Oracle logs. The diagram below illustrates the components of the Oracle collection in a non-Kubernetes environment. Telegraf uses the exec input plugin to obtain Oracle metrics and the Sumo Logic output plugin to send the metrics to Sumo Logic. Logs from Oracle are collected by a Local File Source.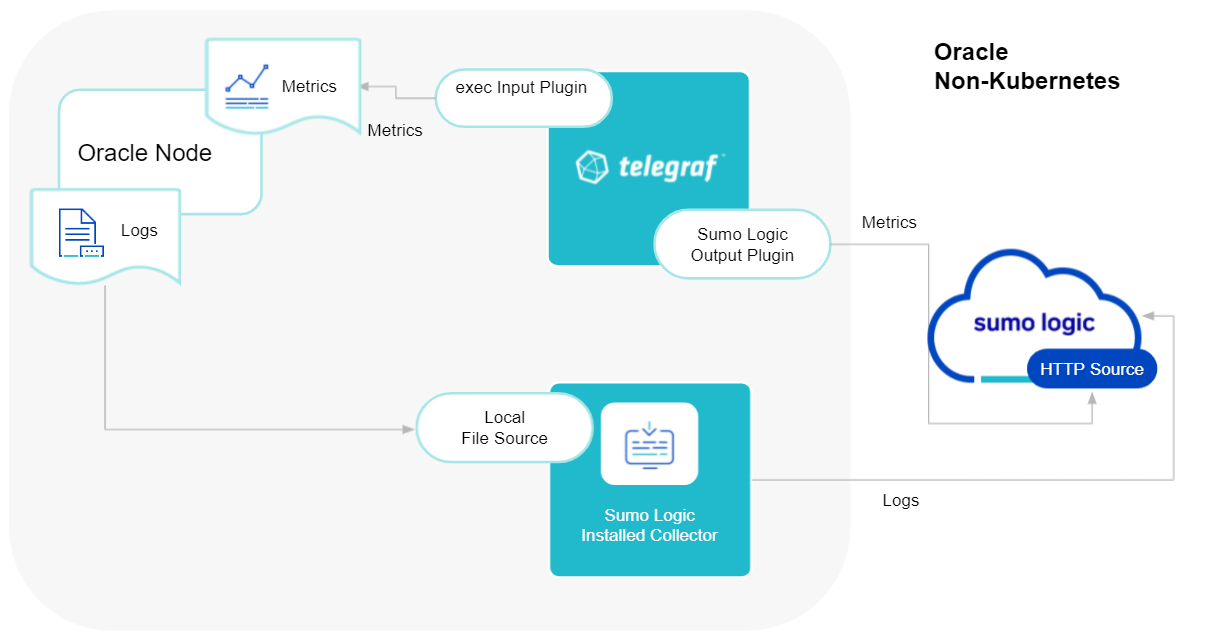
The process to set up collection for Oracle data is done through the following steps:
- Configure Logs Collection
- Enable Oracle Logging
- Verify Log Files Path.
- Configure three Local log file Sources.
- Set Up Oracle Performance Metrics Script
- Configure Metrics Collection
- Configure a Hosted Collector
- Configure an HTTP Logs and Metrics Source
- Install Telegraf
- Configure, and start Telegraf
Configure Logs Collection
This section provides instructions for configuring log collection for Oracle running on a non-Kubernetes environment.
Preview steps for Oracle log collection:
- Enable Oracle Logging
- Verify Log Files Path.
- Configure three Local log file Sources.
- Set Up Oracle Performance Metrics Script
Step 1. Enable Oracle Logging
If logging is not currently enabled for the following logs, enable it.
- Alert log
- Listener log Enable Listener Log: The basic syntax of Listener Control utility commands is as follows
lsnrctl command [listener_name]
lsnrctl set log_status on
- Audit Log — Follow this guide to enable Audit Logs
Step 2. Verify Local logs file directories and Path.
- Oracle Alert Logs
For 11g and later releases (12c, 18c, 19c)
By default, Oracle logs are stored in
**$ORACLE_BASE/diag/rdbms/$DB_UNIQUE_NAME/$ORACLE_SID/trace/**.


The default directory for log files is value of `BACKGROUND_DUMP_DEST`. you can query the value of `BACKGROUND_DUMP_DEST`, an initialization parameter, where you can find Oracle alert log


SQL> show parameter background_dump_dest;
Oracle Listener Logs
You can check listener log file with command
[oracle@sumolab alert]$ lsnrctl status
Oracle Audit Logs
By default, Oracle logs are stored in
**$ORACLE_BASE/app/oracle/admin/orcl/adump**

The default directory for log files is value of `audit_file_dest`. you can query the value of `audit_file_dest`, an initialization parameter, where you can find directory  Oracle Audit log


SQL> show parameter audit


Audit Logs should be in either `XML, EXTENDED` or `{{OS }}` for app to work.
Step 3. Configure three Local File Sources.
In this step, you will configure three Local File sources on an installed collector, one for each of the following Oracle logs: Alert, Listener, and Audit.
Follow the instructions in Local File Source.
When you configure the sources, plan your source categories to ease the querying process. A hierarchical approach allows you to make use of wildcards. For example:
| Source | Example Source Category |
| Alert Logs | DB/Oracle/Alert |
| Listener Logs | DB/Oracle/Listener |
| Audit | DB/Oracle/Audit |
Add Following Fields on each Local File Source:
- Fields. Set the following fields:
* `component = database`.
* `db_system = oracle`.
* `db_cluster = <Your_Oracle_Cluster_Name>`. Enter **Default** if you do not have one.
* `environment = <Your_Environment_Name> `(for example, Dev, QA, or Prod).
* `db_cluster_address` - Enter the cluster hostname or ip address that is used by the application to connect to the database. It could also be the load balancer or proxy endpoint.
* `db_cluster_port` - Enter the database port. If not provided, a default port will be usednotedb_cluster_addressanddb_cluster_portshould reflect exact configuration of DB client configuration in your application, especially if you instrument it with OT tracing. The values of these fields should match exactly the connection string used by the database client (reported as values for net.peer.name and net.peer.port metadata fields).
For example, if your application uses “oracle-prod.sumologic.com:3306” as the connection string, the field values should be set as follows: db_cluster_address=oracle-prod.sumologic.com db_cluster_port=3306
If your application connects directly to a given oracle node, rather than the whole cluster, use the application connection string to override the value of the “host” field in the Telegraf configuration: host=oracle-prod.sumologic.com.
Pivoting to Tracing data from Entity Inspector is possible only for “Oracle address” Entities. :::
Step 4. Set Up Oracle Performance Metrics Script.
The instructions for setting up the Oracle performance metrics script vary by operating system:
- For Linux, see Set Up Oracle Performance Metrics Script on Linux
- For Windows, see Set Up Oracle Performance Metrics Script on Windows
Configure Metrics Collection
Set up a Sumo Logic HTTP Source
Step 1. Configure a Hosted Collector for Metrics.
To create a new Sumo Logic hosted collector, perform the steps in the [Configure a Hosted Collector](/docs/send-data/hosted-collectors/configure-hosted-collector) documentation.
Step 2. Configure an HTTP Logs & Metrics source:
- On the created Hosted Collector on the Collection Management screen, select Add Source.
- Select HTTP Logs & Metrics.
- Name (Required). Enter a name for the source.
- Description(Optional).
- Source Category (Recommended). Be sure to follow the Best Practices for Source Categories. A recommended Source Category may be Prod/DB/Oracle/Metrics.
- Select Save.
- Take note of the URL provided once you click Save. You can retrieve it again by selecting the Show URL next to the source on the Collection Management screen.
Set up Telegraf
Step 3. Install Telegraf
- Install Telegraf if you haven’t already.
- Use the following steps to install Telegraf.
- Install custom Python script to send Oracle metrics into Sumo
- Use the following steps to install a custom Python script to send Oracle metrics into Sumo.
Step 4. Configure and start Telegraf.
As part of collecting metrics data from Telegraf, we will use the exec input plugin to get data from Telegraf and the Sumo Logic output plugin to send data to Sumo Logic.
There are two options
Create
telegraf.conffile.or modify existing
telegraf.conffile.And copy and paste the text below
[[inputs.exec]]
  commands = ["/path_TO_BE_CHANGEME/exec_oracle_metrics.sh"]
  timeout = "5s"
  data_format = "influx"
  [inputs.exec.tags]
  environment="DEV_ENV_TO_BE_CHANGED"
  component="database"
  db_system="oracle"
  db_cluster="PROD_ENV_TO_BE_CHANGED"
  db_cluster_address = "ENV_TO_BE_CHANGED"
  db_cluster_port = "ENV_TO_BE_CHANGED"

[[outputs.sumologic]]
  url = "<URL_from_HTTP_Logs_and_Metrics_Source>"
  data_format = "prometheus"
Enter values for fields annotated with <ENV_TO_BE_CHANGED> to the appropriate values. Do not include the brackets (< >) in your final configuration
Input plugins section, which is
[[inputs.exec]]:- commands- The exec plugin executes all the commands in parallel on every interval and parses metrics from their output in any one of the accepted Input Data Formats.
In the tags section, which is
[inputs.exec.tags]:environment- This is the deployment environment where the Oracle cluster identified by the value of servers resides. For example; dev, prod, or QA. While this value is optional we highly recommend setting it.db_cluster- Enter a name to identify this Oracle cluster. This cluster name will be shown in our dashboards.db_cluster_address- Enter the cluster hostname or ip address that is used by the application to connect to the database. It could also be the load balancer or proxy endpoint.db_cluster_port- Enter the database port. If not provided, a default port will be used.notedb_cluster_addressanddb_cluster_portshould reflect the exact configuration of DB client configuration in your application, especially if you instrument it with OT tracing. The values of these fields should match exactly the connection string used by the database client (reported as values for net.peer.name and net.peer.port metadata fields).For example, if your application uses
“oracle-prod.sumologic.com:3306”as the connection string, the field values should be set as follows:db_cluster_address=oracle-prod.sumologic.com db_cluster_port=3306If your application connects directly to a given oracle node, rather than the whole cluster, use the application connection string to override the value of the “host” field in the Telegraf configuration:
host=oracle-prod.sumologic.comPivoting to Tracing data from Entity Inspector is possible only for “Oracle address” Entities.
In the output plugins section, which is
[[outputs.sumologic]]:- URL - This is the HTTP source URL created previously. See this doc for more information on additional parameters for configuring the Sumo Logic Telegraf output plugin.
Here’s an explanation for additional values set by this Telegraf configuration.
If you haven’t defined a cluster in Oracle, then enter ‘default’ for db_cluster.
There are additional values set by the Telegraf configuration. We recommend not to modify these values as they might cause the Sumo Logic app to not function correctly.
data_format: “prometheus”- In the output[[outputs.sumologic]]plugins section. Metrics are sent in the Prometheus format to Sumo Logic.- component - “database” - In the input
[[inputs.exec]]plugins section. This value is used by Sumo Logic apps to identify application components. - db_system - “oracle” - In the input plugins sections. This value identifies the database system.
See this doc for all other parameters that can be configured in the Telegraf agent globally.
After you have finalized your telegraf.conf file, you can start or reload the telegraf service using instructions from this doc.
At this point, Telegraf should start collecting the Oracle metrics and forward them to the Sumo Logic HTTP Source.