Install the Monitors, App, and view the Dashboards
This section provides instructions for installing the Oracle Monitors, App, as well as examples of each of the App dashboards. These instructions assume you have already set up the collection as described in the Collect Logs and Metrics for the Oracle App page.
Pre-Packaged Alerts
Sumo Logic has provided out-of-the-box alerts available through Sumo Logic monitors to help you monitor your Oracle clusters. These alerts are built based on metrics and logs datasets and include preset thresholds based on industry best practices and recommendations.
For details on the individual alerts, see this page.
Installing Monitors
- To install these alerts, you need to have the Manage Monitors role capability.
- Alerts can be installed by either importing a JSON file or a Terraform script.
There are limits to how many alerts can be enabled - see the Alerts FAQ for details.
Method A: Importing a JSON file
- Download the JSON file that describes the monitors.
- The JSON contains the alerts that are based on Sumo Logic searches that do not have any scope filters and therefore will be applicable to all Oracle clusters, the data for which has been collected via the instructions in the previous sections. However, if you would like to restrict these alerts to specific clusters or environments, update the JSON file by replacing the text
db_system=oraclewith<Your Custom Filter>.
Custom filter examples:
For alerts applicable only to a specific cluster, your custom filter would be, ‘
db_cluster=oracle-prod.01‘.For alerts applicable to all clusters that start with Kafka-prod, your custom filter would be,
db_cluster=oracle-prod*.For alerts applicable to a specific cluster within a production environment, your custom filter would be:
db_cluster=oracle-1andenvironment=prod(This assumes you have set the optional environment tag while configuring collection).Go to Manage Data > Alerts > Monitors.
Click Add: \
Click Import and then copy-paste the above JSON to import monitors.
The monitors are disabled by default. Once you have installed the alerts using this method, navigate to the Oracle folder under Monitors to configure them. See this document to enable monitors to send notifications to teams or connections. See the instructions detailed in Step 4 of this document.
Method B: Using a Terraform script
- Generate a Sumo Logic access key and ID. Generate an access key and access ID for a user that has the Manage Monitors role capability in Sumo Logic using these instructions. Identify which deployment your Sumo Logic account is in, using this link.
- Download and install Terraform 0.13 or later.
- Download the Sumo Logic Terraform package for Oracle alerts. The alerts package is available in the Sumo Logic GitHub repository. You can either download it through the “git clone” command or as a zip file.
- Alert Configuration . After the package has been extracted, navigate to the package directory terraform-sumologic-sumo-logic-monitor/monitor_packages/Oracle/
Edit the Oracle.auto.tfvars file and add the Sumo Logic Access Key, Access Id and Deployment from Step 1.
access_id   = "<SUMOLOGIC ACCESS ID>"
access_key  = "<SUMOLOGIC ACCESS KEY>"
environment = "<SUMOLOGIC DEPLOYMENT>"
The Terraform script installs the alerts without any scope filters, if you would like to restrict the alerts to specific clusters or environments, update the variable ’oracle_data_source’. Custom filter examples:
- A specific cluster **‘
db_cluster=oracle.prod.01’. - All clusters in an environment ‘
environment=prod’. - For alerts applicable to all clusters that start with oracle-prod, your custom filter would be: ‘
db_cluster=qracle-prod*’. - For alerts applicable to a specific cluster within a production environment, your custom filter would be, \
db_cluster=oracle-1andenvironment=prod(This assumes you have set the optional environment tag while configuring collection).
All monitors are disabled by default on installation, if you would like to enable all the monitors, set the parameter monitors_disabled to false in this file.
By default, the monitors are configured in a monitor folder called “Oracle”, if you would like to change the name of the folder, update the monitor folder name in “folder” key at **Oracle.auto.tfvars file.
If you would like the alerts to send email or connection notifications, configure these in the file **Oracle_notifications.auto.tfvars. For configuration examples, refer to the next section.
- Email and Connection Notification Configuration Examples \ Modify the file Oracle_notifications.auto.tfvars and populate connection_notifications and email_notifications as per below examples.
connection_notifications = [
    {
      connection_type       = "PagerDuty",
      connection_id         = "<CONNECTION_ID>",
      payload_override      = "{\"service_key\": \"your_pagerduty_api_integration_key\",\"event_type\": \"trigger\",\"description\": \"Alert: Triggered {{TriggerType}} for Monitor {{Name}}\",\"client\": \"Sumo Logic\",\"client_url\": \"{{QueryUrl}}\"}",
      run_for_trigger_types = ["Critical", "ResolvedCritical"]
    },
    {
      connection_type       = "Webhook",
      connection_id         = "<CONNECTION_ID>",
      payload_override      = "",
      run_for_trigger_types = ["Critical", "ResolvedCritical"]
    }
  ]
Replace <CONNECTION_ID> with the connection id of the webhook connection. The webhook connection id can be retrieved by calling the Monitors API.
For overriding payload for different connection types, refer to this [document](/1021/merge/docs/manage/connections-integrations/webhook-connections/set-up-webhook-connections).
email_notifications = [
    {
      connection_type       = "Email",
      recipients            = ["abc@example.com"],
      subject               = "Monitor Alert: {{TriggerType}} on {{Name}}",
      time_zone             = "PST",
      message_body          = "Triggered {{TriggerType}} Alert on {{Name}}: {{QueryURL}}",
      run_for_trigger_types = ["Critical", "ResolvedCritical"]
    }
  ]
- Install the Alerts.
- Navigate to the package directory terraform-sumologic-sumo-logic-monitor/monitor_packages/Oracle/ and run terraform init. This will initialize Terraform and will download the required components.
- Run terraform plan to view the monitors which will be created/modified by Terraform.
- Run terraform apply.
- Post Installation. If you haven’t enabled alerts and/or configured notifications through the Terraform procedure outlined above, we highly recommend enabling alerts of interest and configuring each enabled alert to send notifications to other users or services. This is detailed in Step 4 of this document.
10 There are limits to how many alerts can be enabled - see the Alerts FAQ.
Installing the Oracle App
This section demonstrates how to install the Oracle App.
Locate and install the app you need from the App Catalog. If you want to see a preview of the dashboards included with the app before installing, click Preview Dashboards.
- From the App Catalog, search for and select the app.
- Select the service version you're using and click Add to Library. Version selection applies only to a few apps currently. For more information, see the Install the Apps from the Library.
- To install the app, complete the following fields.
- App Name. You can retain the existing name or enter the app's name of your choice.
- Advanced. Select the Location in the Library (the default is the Personal folder in the library), or click New Folder to add a new folder.
- Click Add to Library.
Once an app is installed, it will appear in your Personal folder, or other folder that you specify. From here, you can share it with your organization.
Panels will start to fill automatically. It's important to note that each panel slowly fills with data matching the time range query and received since the panel was created. Results won't immediately be available, but with a bit of time, you'll see full graphs and maps.
Viewing Oracle Dashboards
Template variables provide dynamic dashboards that can rescope data on the fly. As you apply variables to troubleshoot through your dashboard, you view dynamic changes to the data for a quicker resolution to the root cause. You can use template variables to drill down and examine the data on a granular level. For more information, see Filter with template variables.
Overview
See an overview of Oracle listener process activity, including successful DB connections, TNS error information, SID and Service Name usage, command execution, and top usage, in terms of ports, database users, user hosts, client hosts, and user programs as derived from the Oracle Listener log.
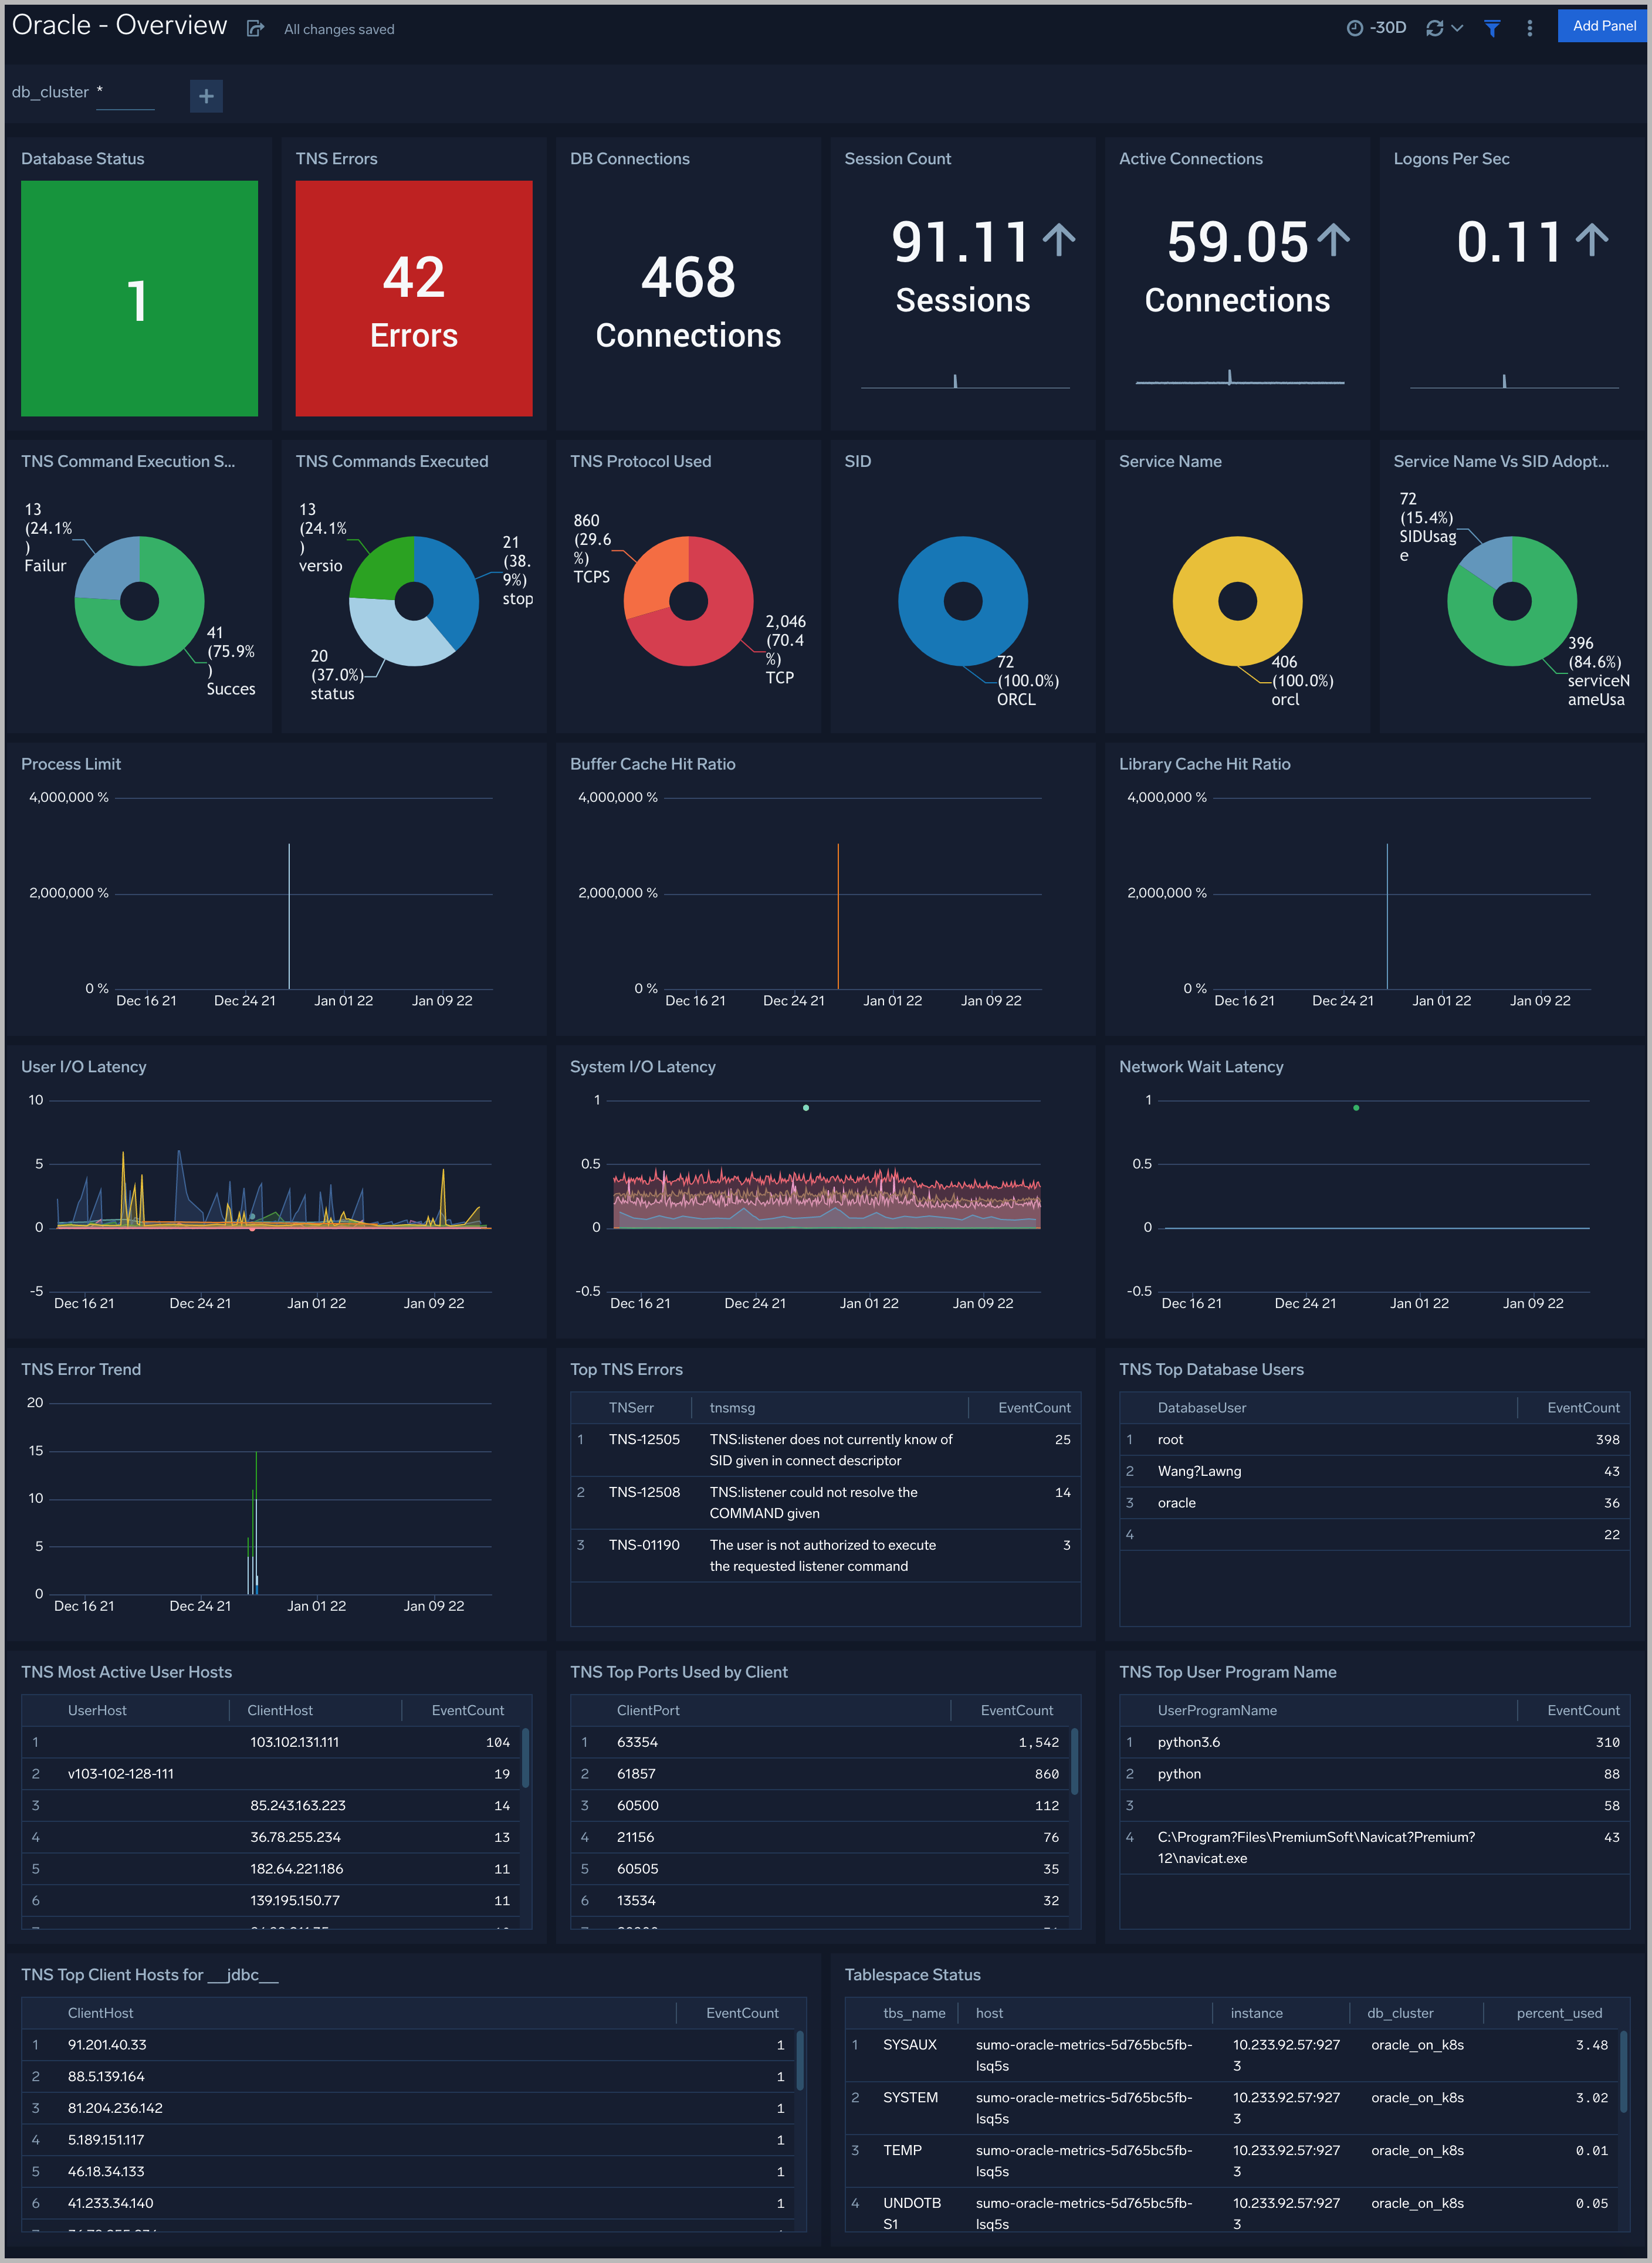
DB Connections. The count of database connections established during the previous 24 hours.
TNS Errors. The count of TNS errors during the previous 24 hours.
Top TNS Errors. A table that shows the top 10 TNS errors and the count of each in the previous 24 hours.
TNS Error Trend. A stacked column chart that shows the count of each TNS error per one hour timeslice, over the previous 24 hours.
SID. A donut chart that shows the breakdown of connections by SID over the previous 24 hours.
Service Name. A donut chart that shows the breakdown of connections by service name over the previous 24 hours.
Service Name Vs SID Adoption. A donut chart that shows the breakdown of connections by SID versus by Service Name over the previous 24 hours.
Protocol Used. A donut chart that shows the breakdown of connection requests by protocol over the previous 24 hours.
Command Execution Status. A donut chart that shows the breakdown of successful and failed Listener commands over the previous 24 hours.
Commands Executed. A donut chart that shows the breakdown of specific lsnrctl commands over the previous 24 hours.
Top Ports Used by Client. A table that shows the top 20 client ports that initiated connections, and connection count for each over the previous 24 hours.
Top Database Users. A table that shows the top 20 database users for which the client initiated connections, and connection count for each over the previous 24 hours.
Most Active User Hosts. A table that shows the top 20 user hosts that initiated connections, and connection count for each over the previous 24 hours.
Top Client Hosts for jdbc. A table that shows connections initiated from Client Host by appserver using the JDBC Thin Client (host name jdbc) and the connection count for each over the previous 24 hours.
Top User Program Name. A table that shows the top 20 programs that initiated connections over the previous 24 hours.
Alert Analysis
See information about Oracle errors, including counts of various error types, ORA messages, oracle instance state, and other data derived from the Oracle Alert log.
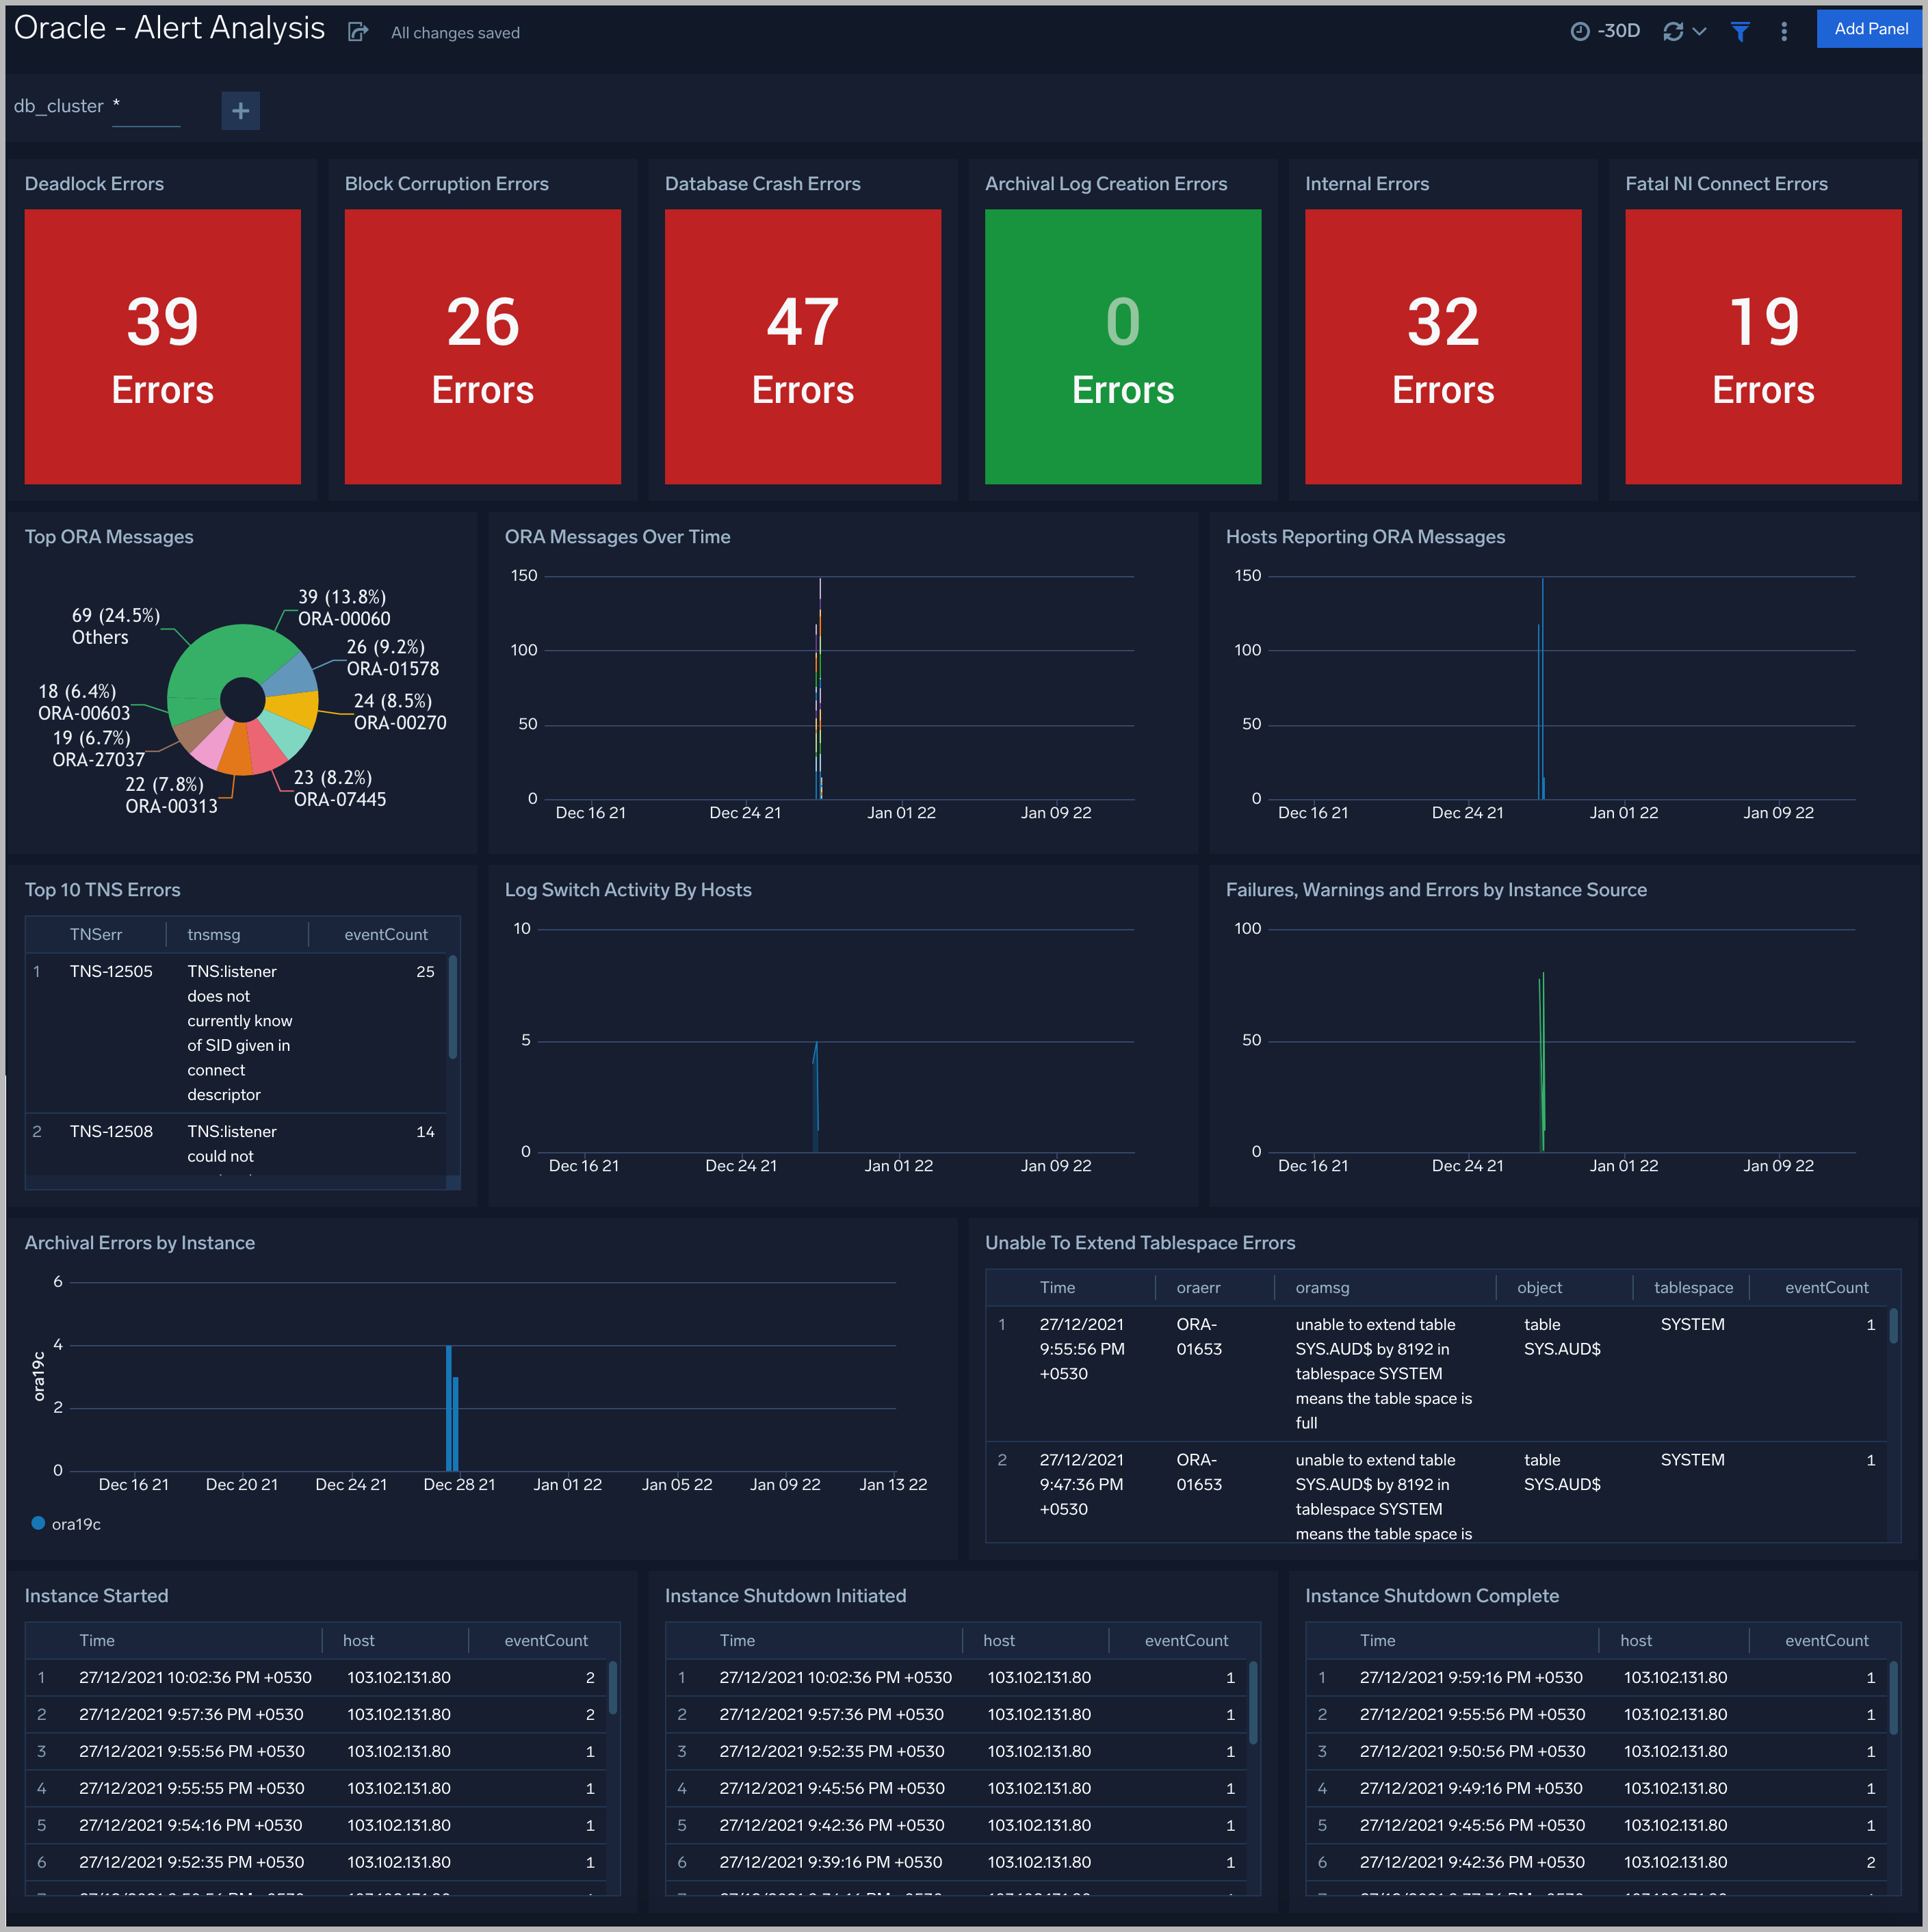
Deadlock Errors. Count of ORA-00060 messages over the previous 24 hours.
Database Crash Errors. Count of database crash errors (ORA-00603, ORA-00449, ORA-00471, or ORA-01092) over the previous 24 hours.
Archival Log Creation Errors. Count of ORA-00270 messages over the previous 24 hours.
Internal Errors. Count of internal errors (ORA-00600 or ORA-07445) over the previous 24 hours.
Fatal NI Connect Errors. Count fatal NI connect errors over the previous 24 hours.
Top ORA Messages. A donut chart that shows the breakdown of ORA messages by message type over the previous 24 hours.
ORA Messages Over Time. A stacked column chart that shows the count of ORA messages of each message type per one hour timeslice over the previous 24 hours.
Hosts Reporting ORA Messages. A stacked column chart that shows the count of ORA messages of all types by host per one hour timeslice over the previous 24 hours.
Top TNS Errors. A table that shows the count of Transparent Network Substrate (TNS) errors of each type over the previous 24 hours.
Log Switch Activity By Hosts. An area chart that shows the count of log switch events per one hour timeslice by host. (A log switch is the point at which the database stops writing to one redo log file and begins writing to another.)
Failures, Warnings and Errors by Instance Source. An area chart that shows the count of messages from the Oracle Alert log that match patterns like: fail*, warn*, or error*.
Archival Errors by Instance. A stacked column chart that shows the count of messages from the Oracle Alert log that contain the string “Archival Error" by per one hour timeslice by database instance over the previous 24 hours.
Unable to Extend Tablespace Errors. A table that lists errors related to a failure to extend a tablespace, that occurred during the previous 24 hours.
Instance Started. A table that lists when database instances were started during the previous three days.
Instance Shutdown Initiated. A table that lists when shutdowns of database instances were initiated during the previous three days.
Instance Shutdown Complete. A table that lists when shutdowns of database instances were initiated during the previous three days.
Listener Troubleshooting
See details of Oracle listener process activity, including database connections by host and application, connection failures, command execution status and trends, and other data derived from the Oracle Listener log.
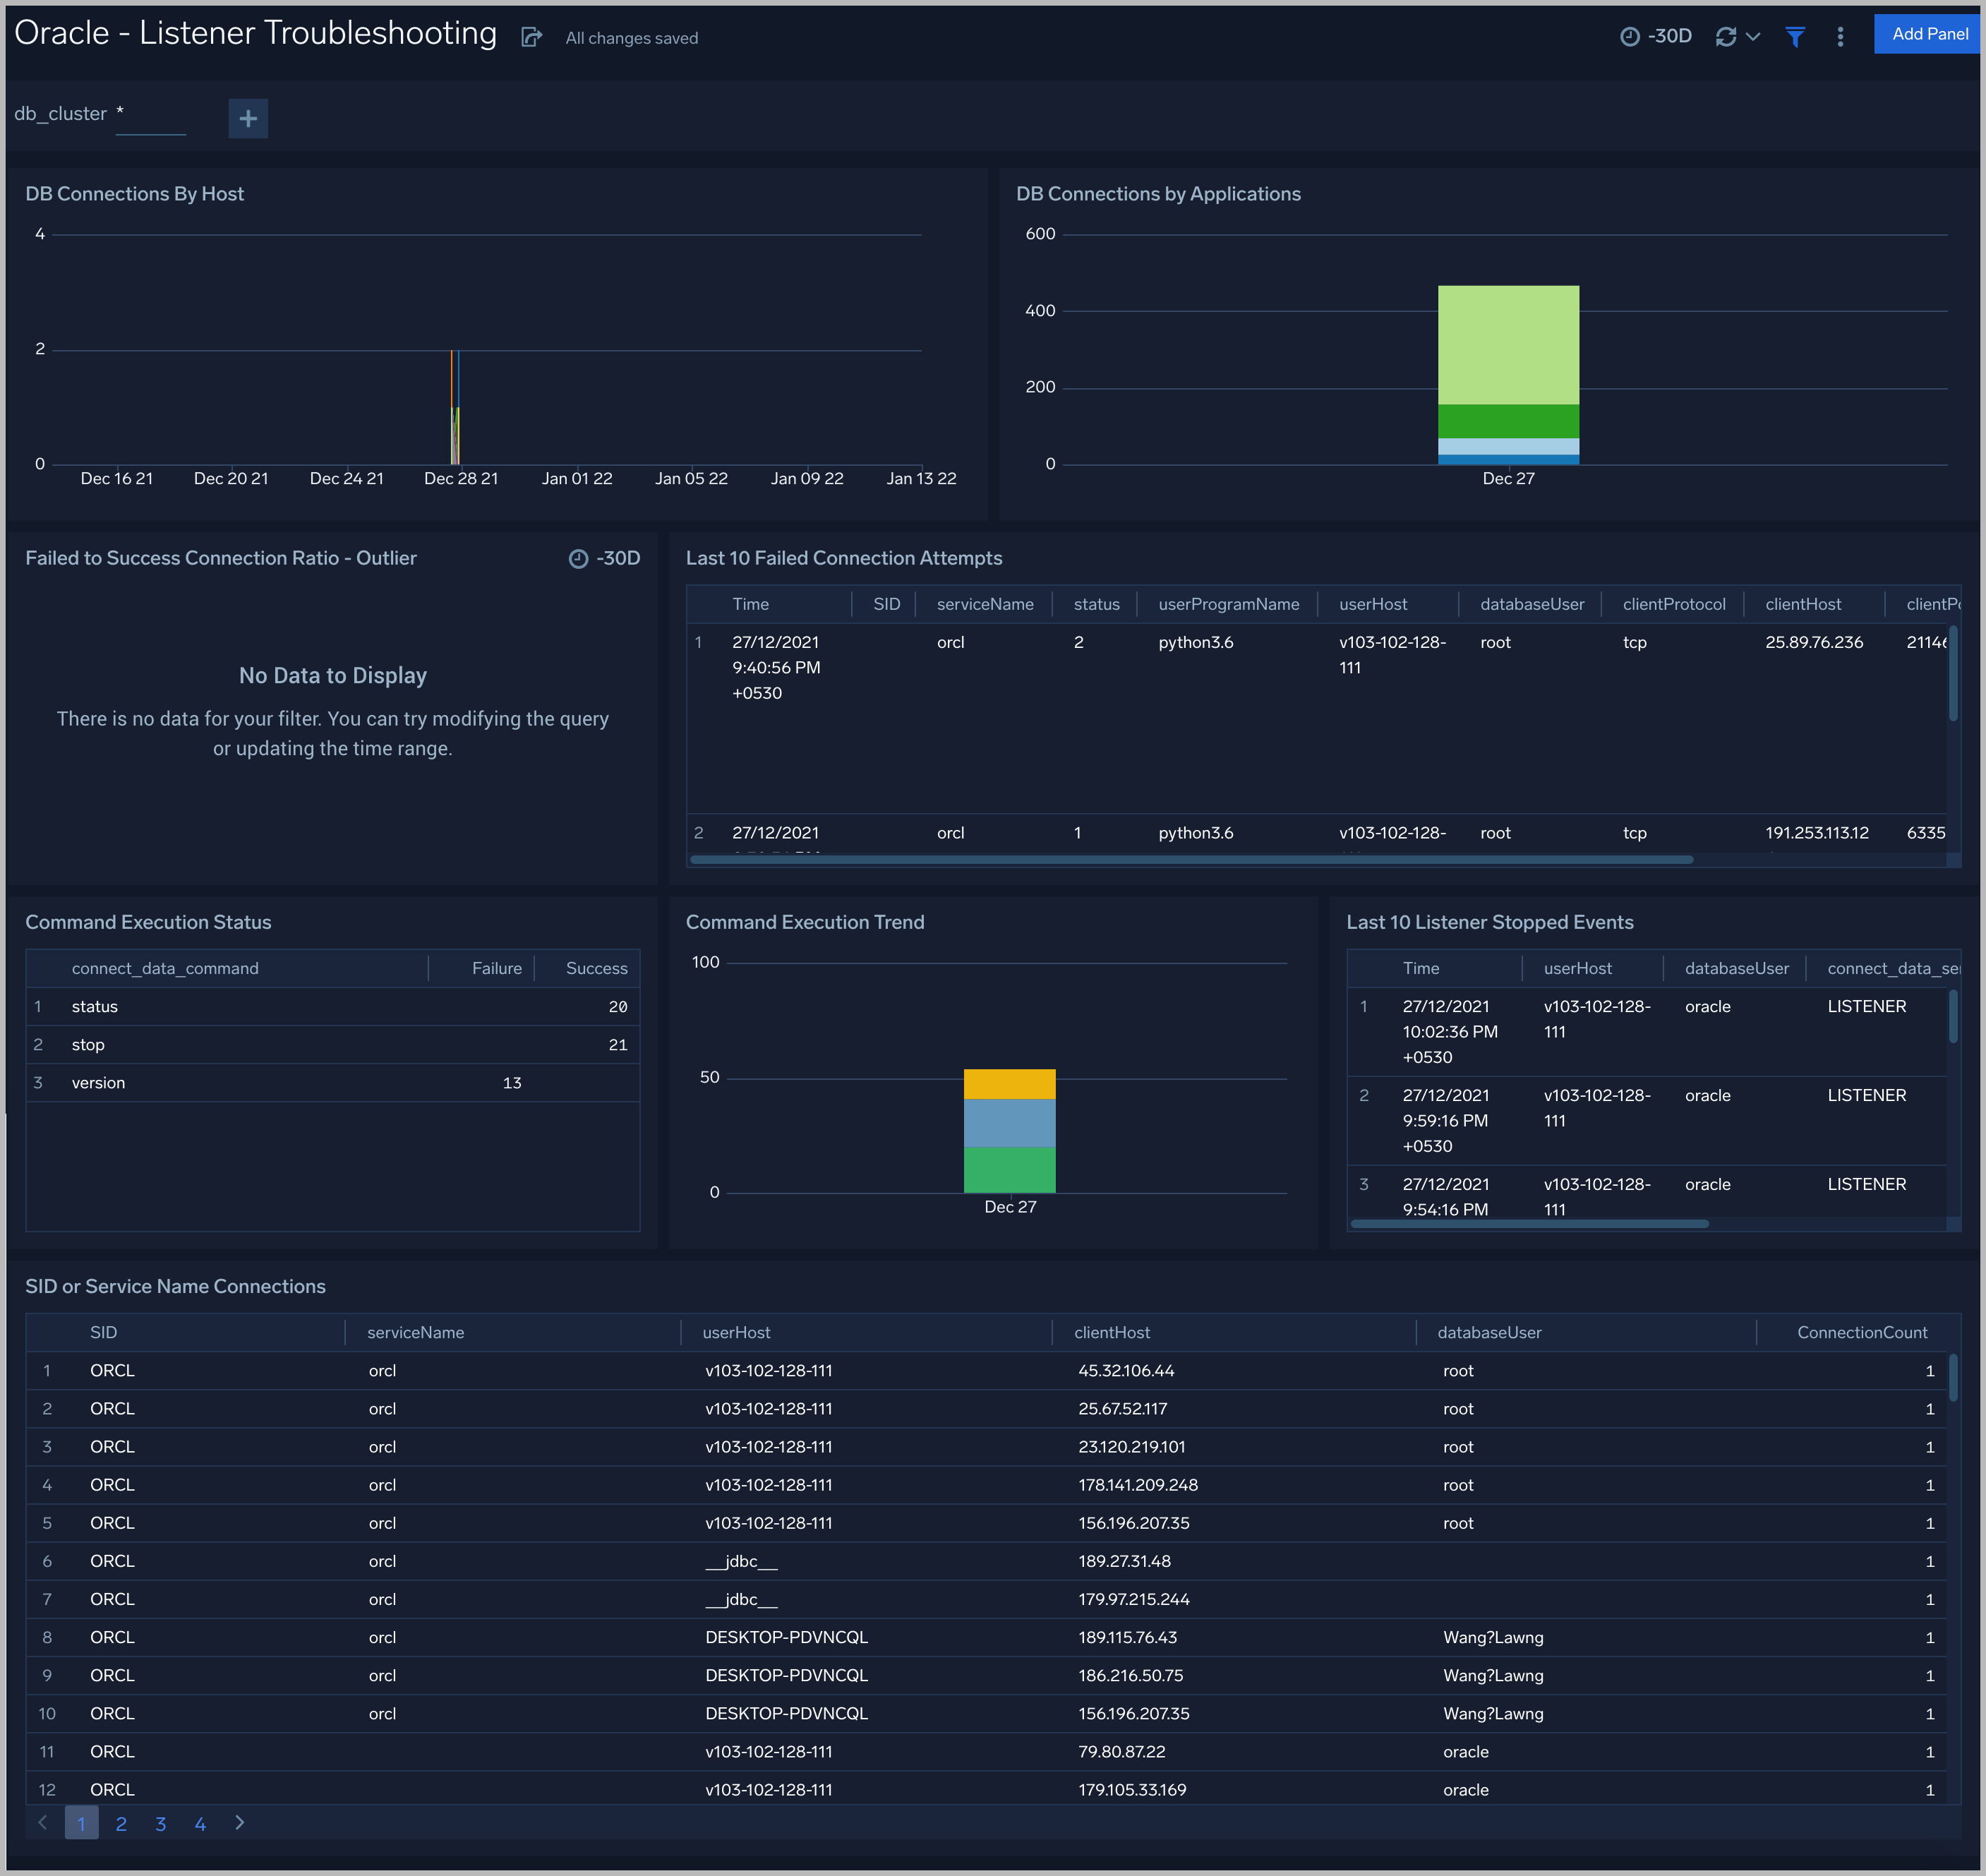
DB Connections By Host. An area chart that shows the count of database connections by host, per 5 minute timeslice, over the previous 24 hours.
DB Connections By Applications. A stacked column chart that shows the count of database connection by initiating program, per one day timeslice, over the previous 7 days.
Failed to Success Connection Ratio - Outlier. A visualization that shows when the ratio of failed to successful connections was statistically significant (more than three standard deviations higher than the running average), over the previous 30 days.
Failed Connection Attempts. A table that lists failed database connection attempts over the previous three days.
Command Execution Status. A table that lists the count of specific lsnrctl commands that were issued in the previous seven days, and the count of failures and successes for each.
Command Execution Trend. A stacked column chart that shows the count of specific lsnrctl commands that were issued in the previous seven days per one day timeslice.
Listener Stopped Events. A table that lists listener stop events during the previous 7 days.
SID or Service Name Detailed Breakup. A table that shows the count of connections performed with sid or service name, by userhost, clienthost, and databaseuser.
Security Monitoring
See information about database connections established by privileged users, connection attempts from public IP addresses, attempts to execute unauthorized commands, and events that associated with potentially inappropriate activities as derived from Oracle Listener and Alert Logs.
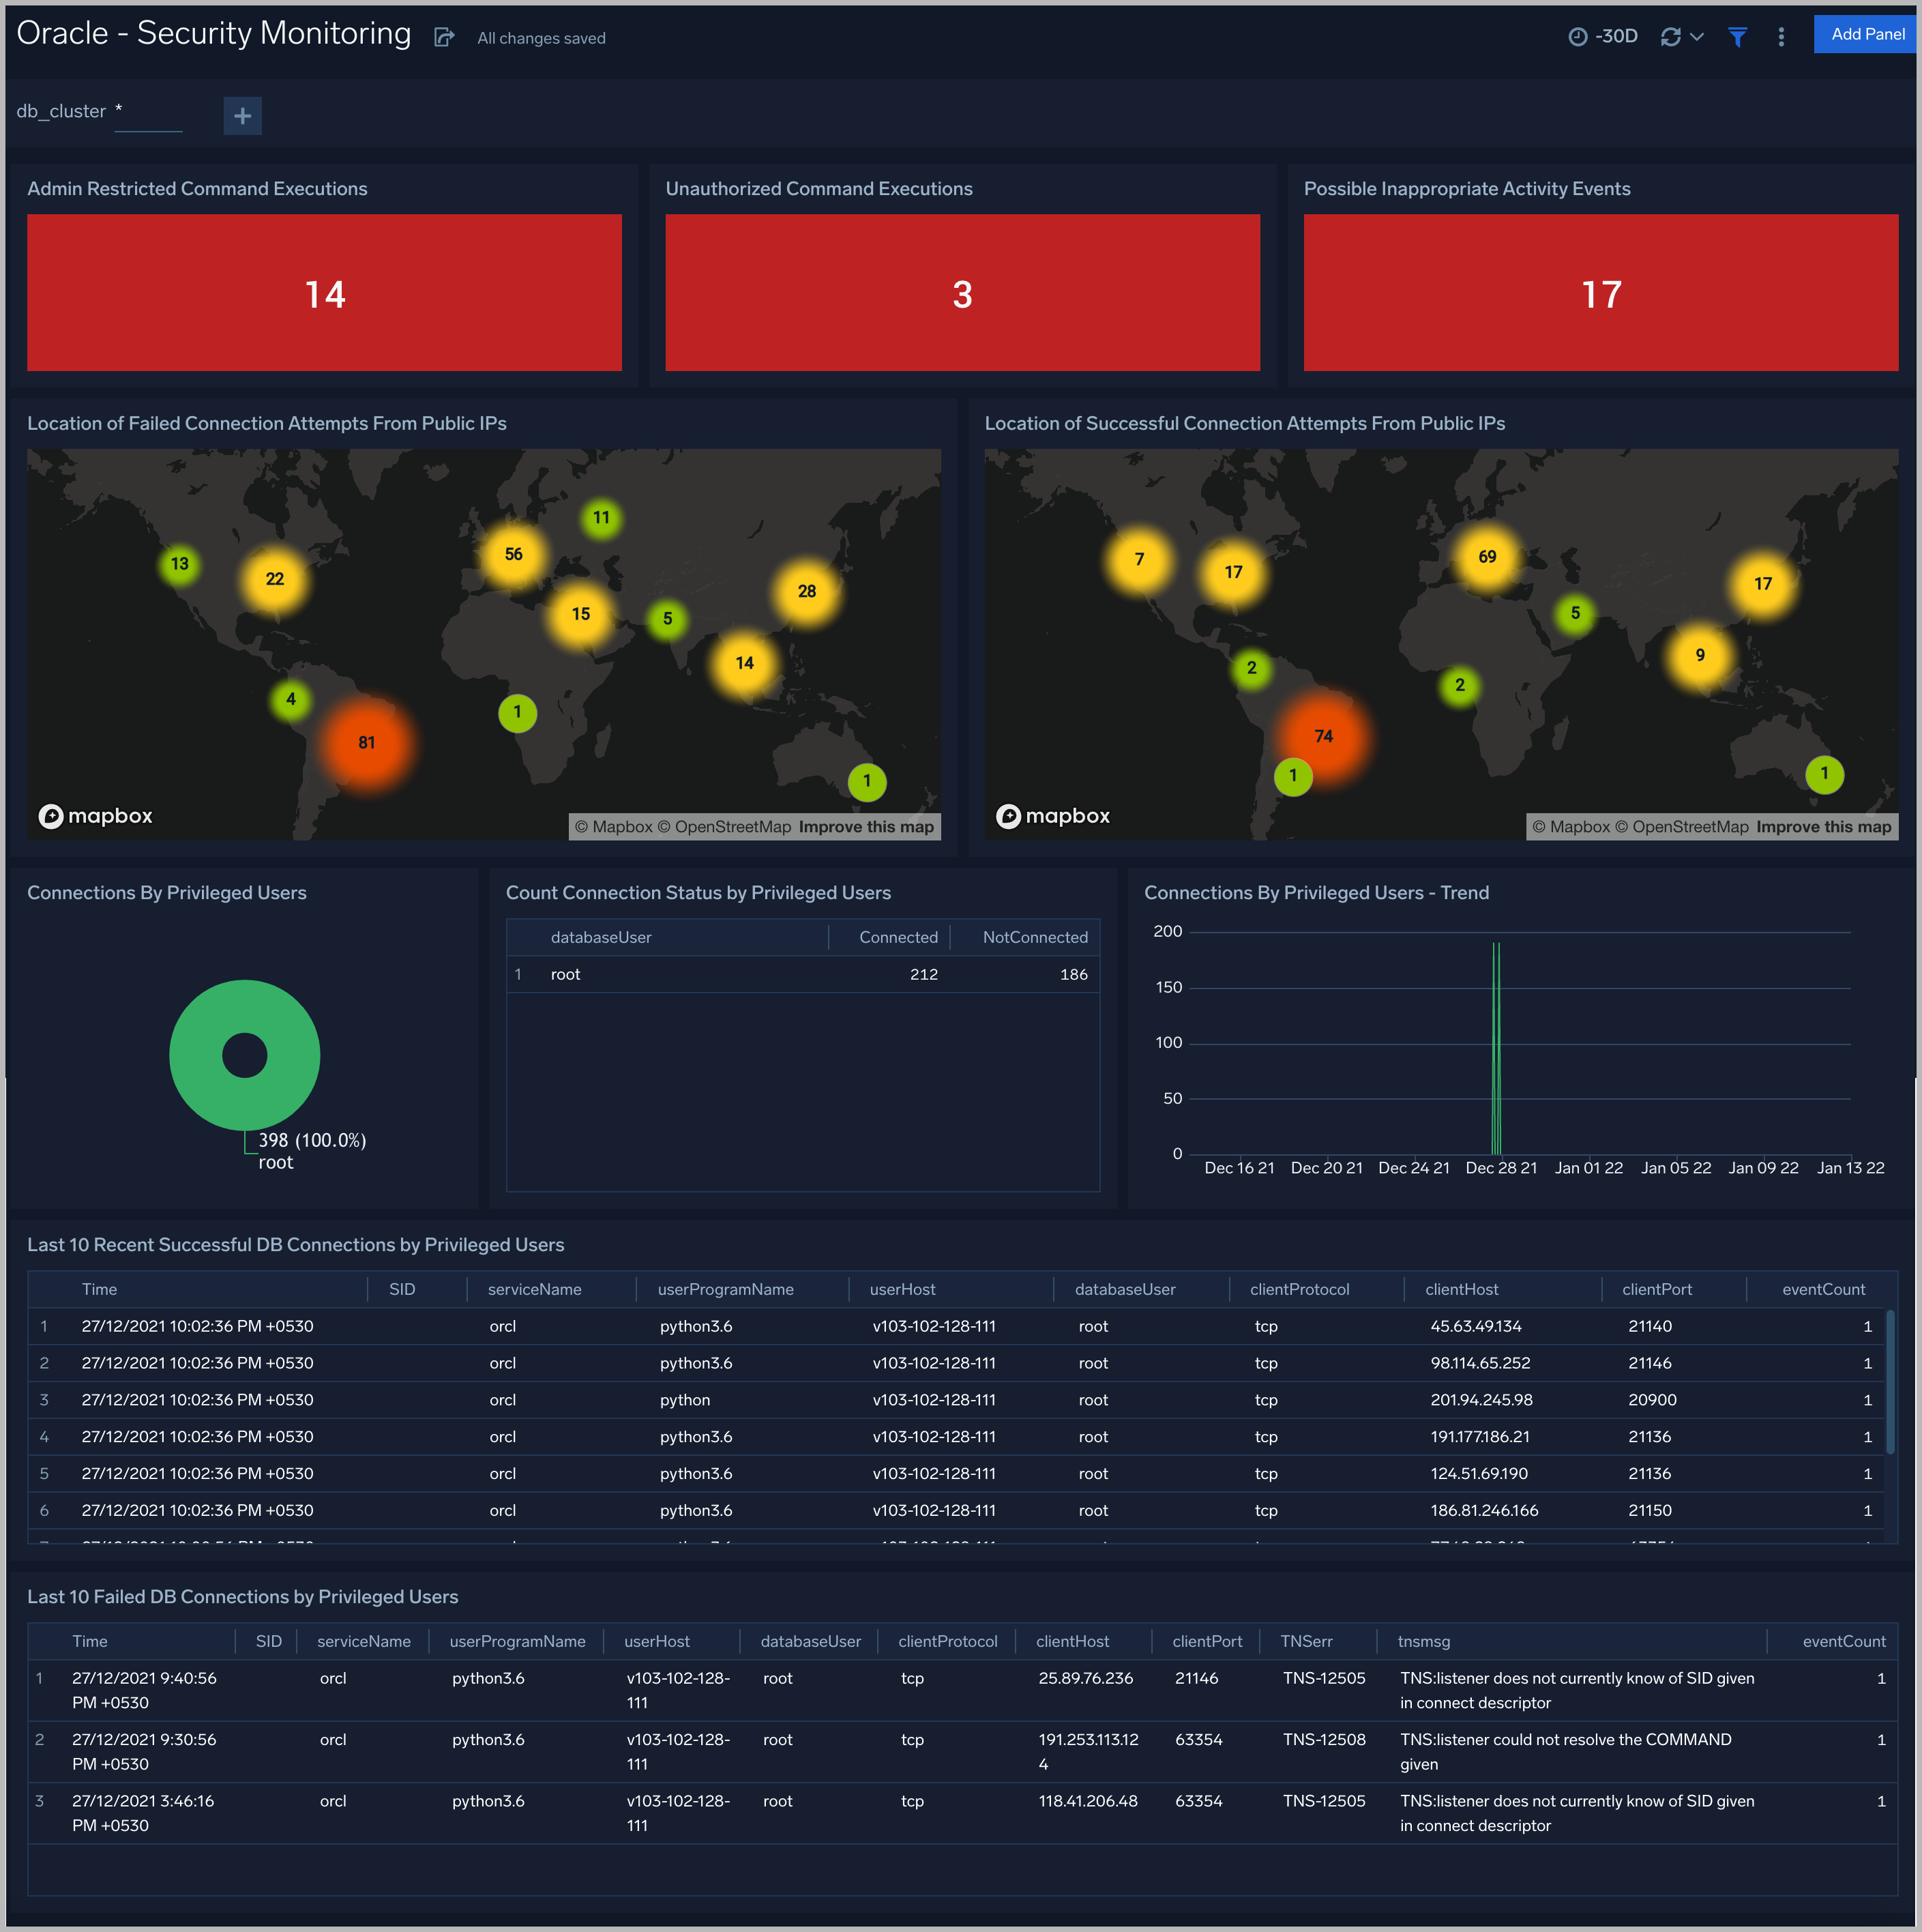
Admin Restricted Command Execution. The count of database commands that resulted in TNS-12508 errors over the previous 24 hours.
Unauthorized Command Execution. The count of database commands that resulted in TNS-01190 errors over the previous 24 hours.
Possible InAppropriate Activity. The count of lsnrctl commands the resulted in errors of the following types over the previous 24 hours: TNS-01169, TNS-01189, TNS-01190, "TNS-12508", ORA-12525, ORA-28040, or ORA-12170.
Connections By Privileged Users. A donut chart that shows the breakdown of connections from privileged user accounts, such as root and administrator, over the previous 24 hours.
Connection Status by Privileged Users. A table that shows the count of successful and unsuccessful connections from privileged user accounts, such as root and administrator, over the previous 24 hours.
Connections By Privileged Users - Trend. A line chart that shows the count of connections from privileged user accounts, such as root and administrator, per one hour timeslice over over the previous 24 hours.
Recent Successful DB Connections by Privileged Users. A table that shows the count of successful connections from privileged user accounts, such as root and administrator, per one minute timeslice, over the previous 24 hours.
Failed Connection Attempt From PublicIP Location. A map chart that shows the count and location of failed connection attempts from geographical locations over the previous 24 hours.
Successful Connection Attempt From PublicIP Location. A map chart that shows the count and location of successful connection attempts from geographical locations over the previous 24 hours.
Failed DB Connections by Privileged Users. A table that provides information about failed database connections from privileged user accounts, such as root and administrator, over the previous 24 hours.
Sys Audit Log
See information derived from the syslog audit trail, including successful and failed activities, and top usage by client, database user, and privileges used.
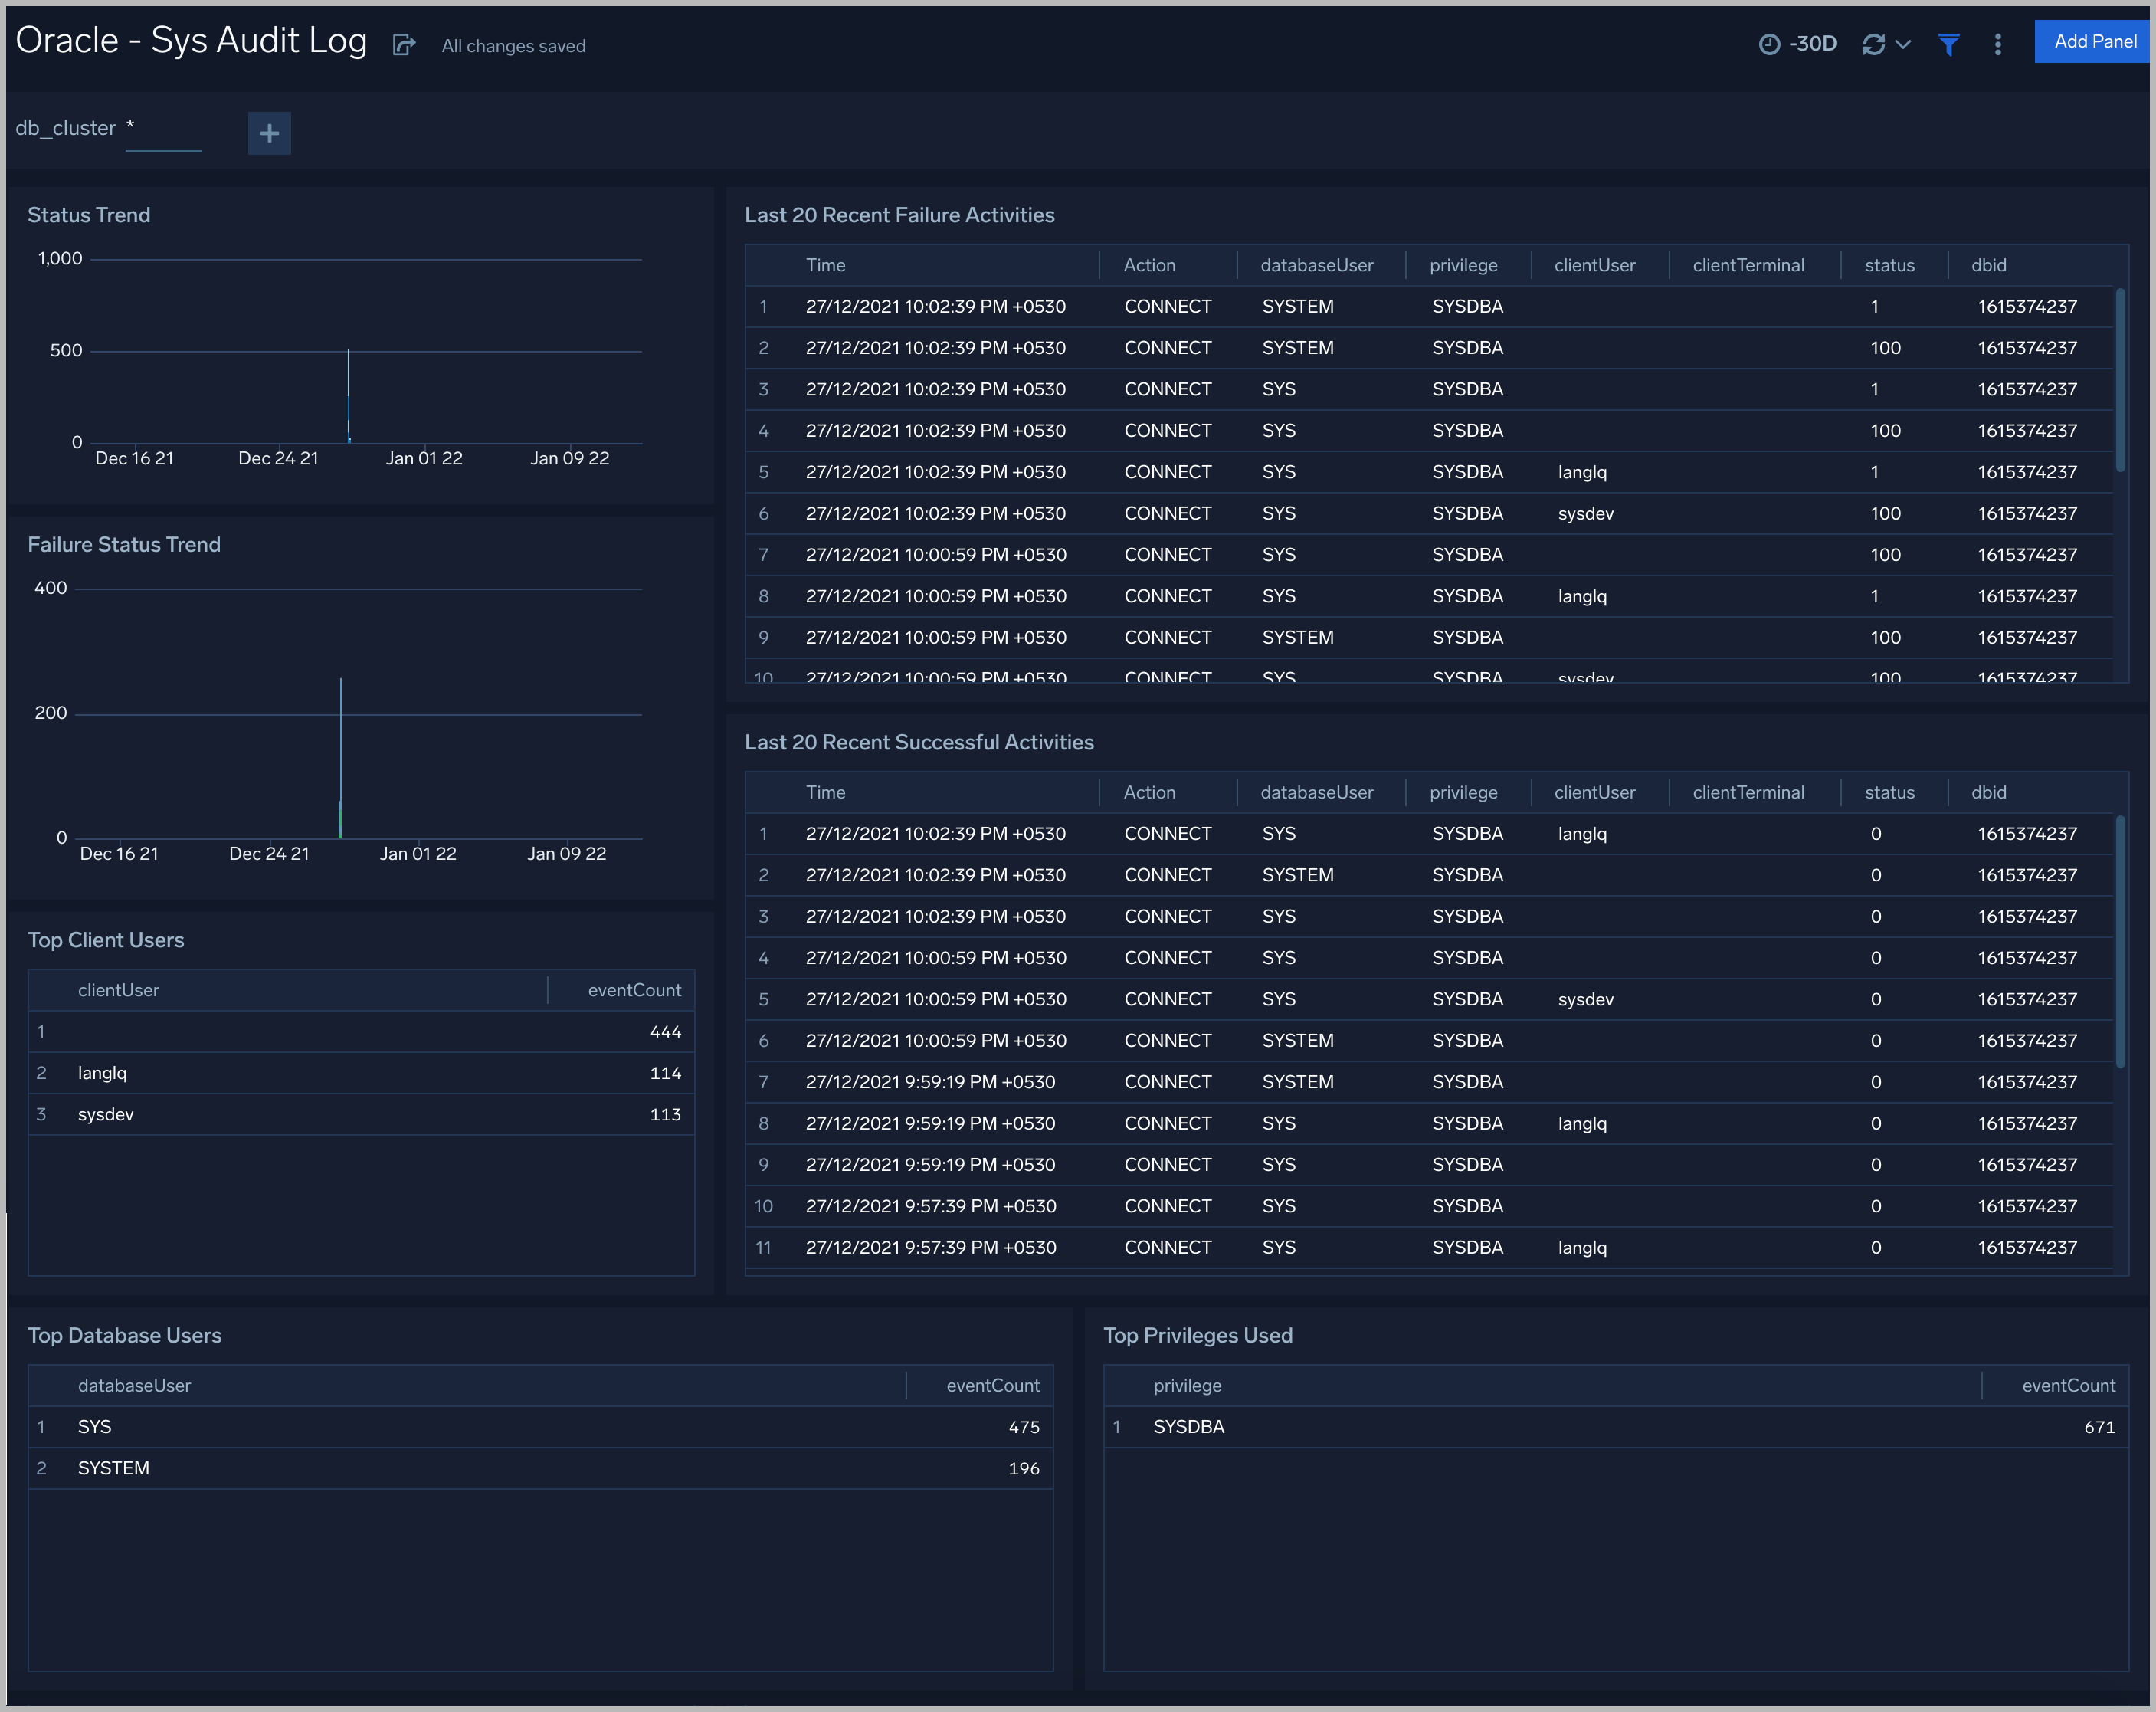
Status Trend. A stacked column chart that shows the count of successful and unsuccessful database actions over the previous 24 hours.
Failure Status Trend. A stacked column chart that shows the count of unsuccessful database actions by failure status code over the previous 24 hours.
Recent Failure Activities. A table that lists unsuccessful database actions over the previous 60 minutes.
Top Client Users. A table that shows the top 10 client users over the previous 24 hours, and a count of the events associated with each.
Top Database Users. A table that shows the top 10 database users over the previous 24 hours, and a count of the events associated with each.
Top Privileges Used. A table that shows the top 10 database privileges used over the previous 24 hours, and a count of the events associated with each.
Recent Successful Activities. A table that lists information about successful database actions over the previous 60 minutes.
Sys Audit Log - Logon Analysis
See logon activity information derived from the syslog audit trail, including successful and failed logons, logon status trends, multiple database user logons and client user logons from the same UserHost, and multiple UserHost logons with the same database user.
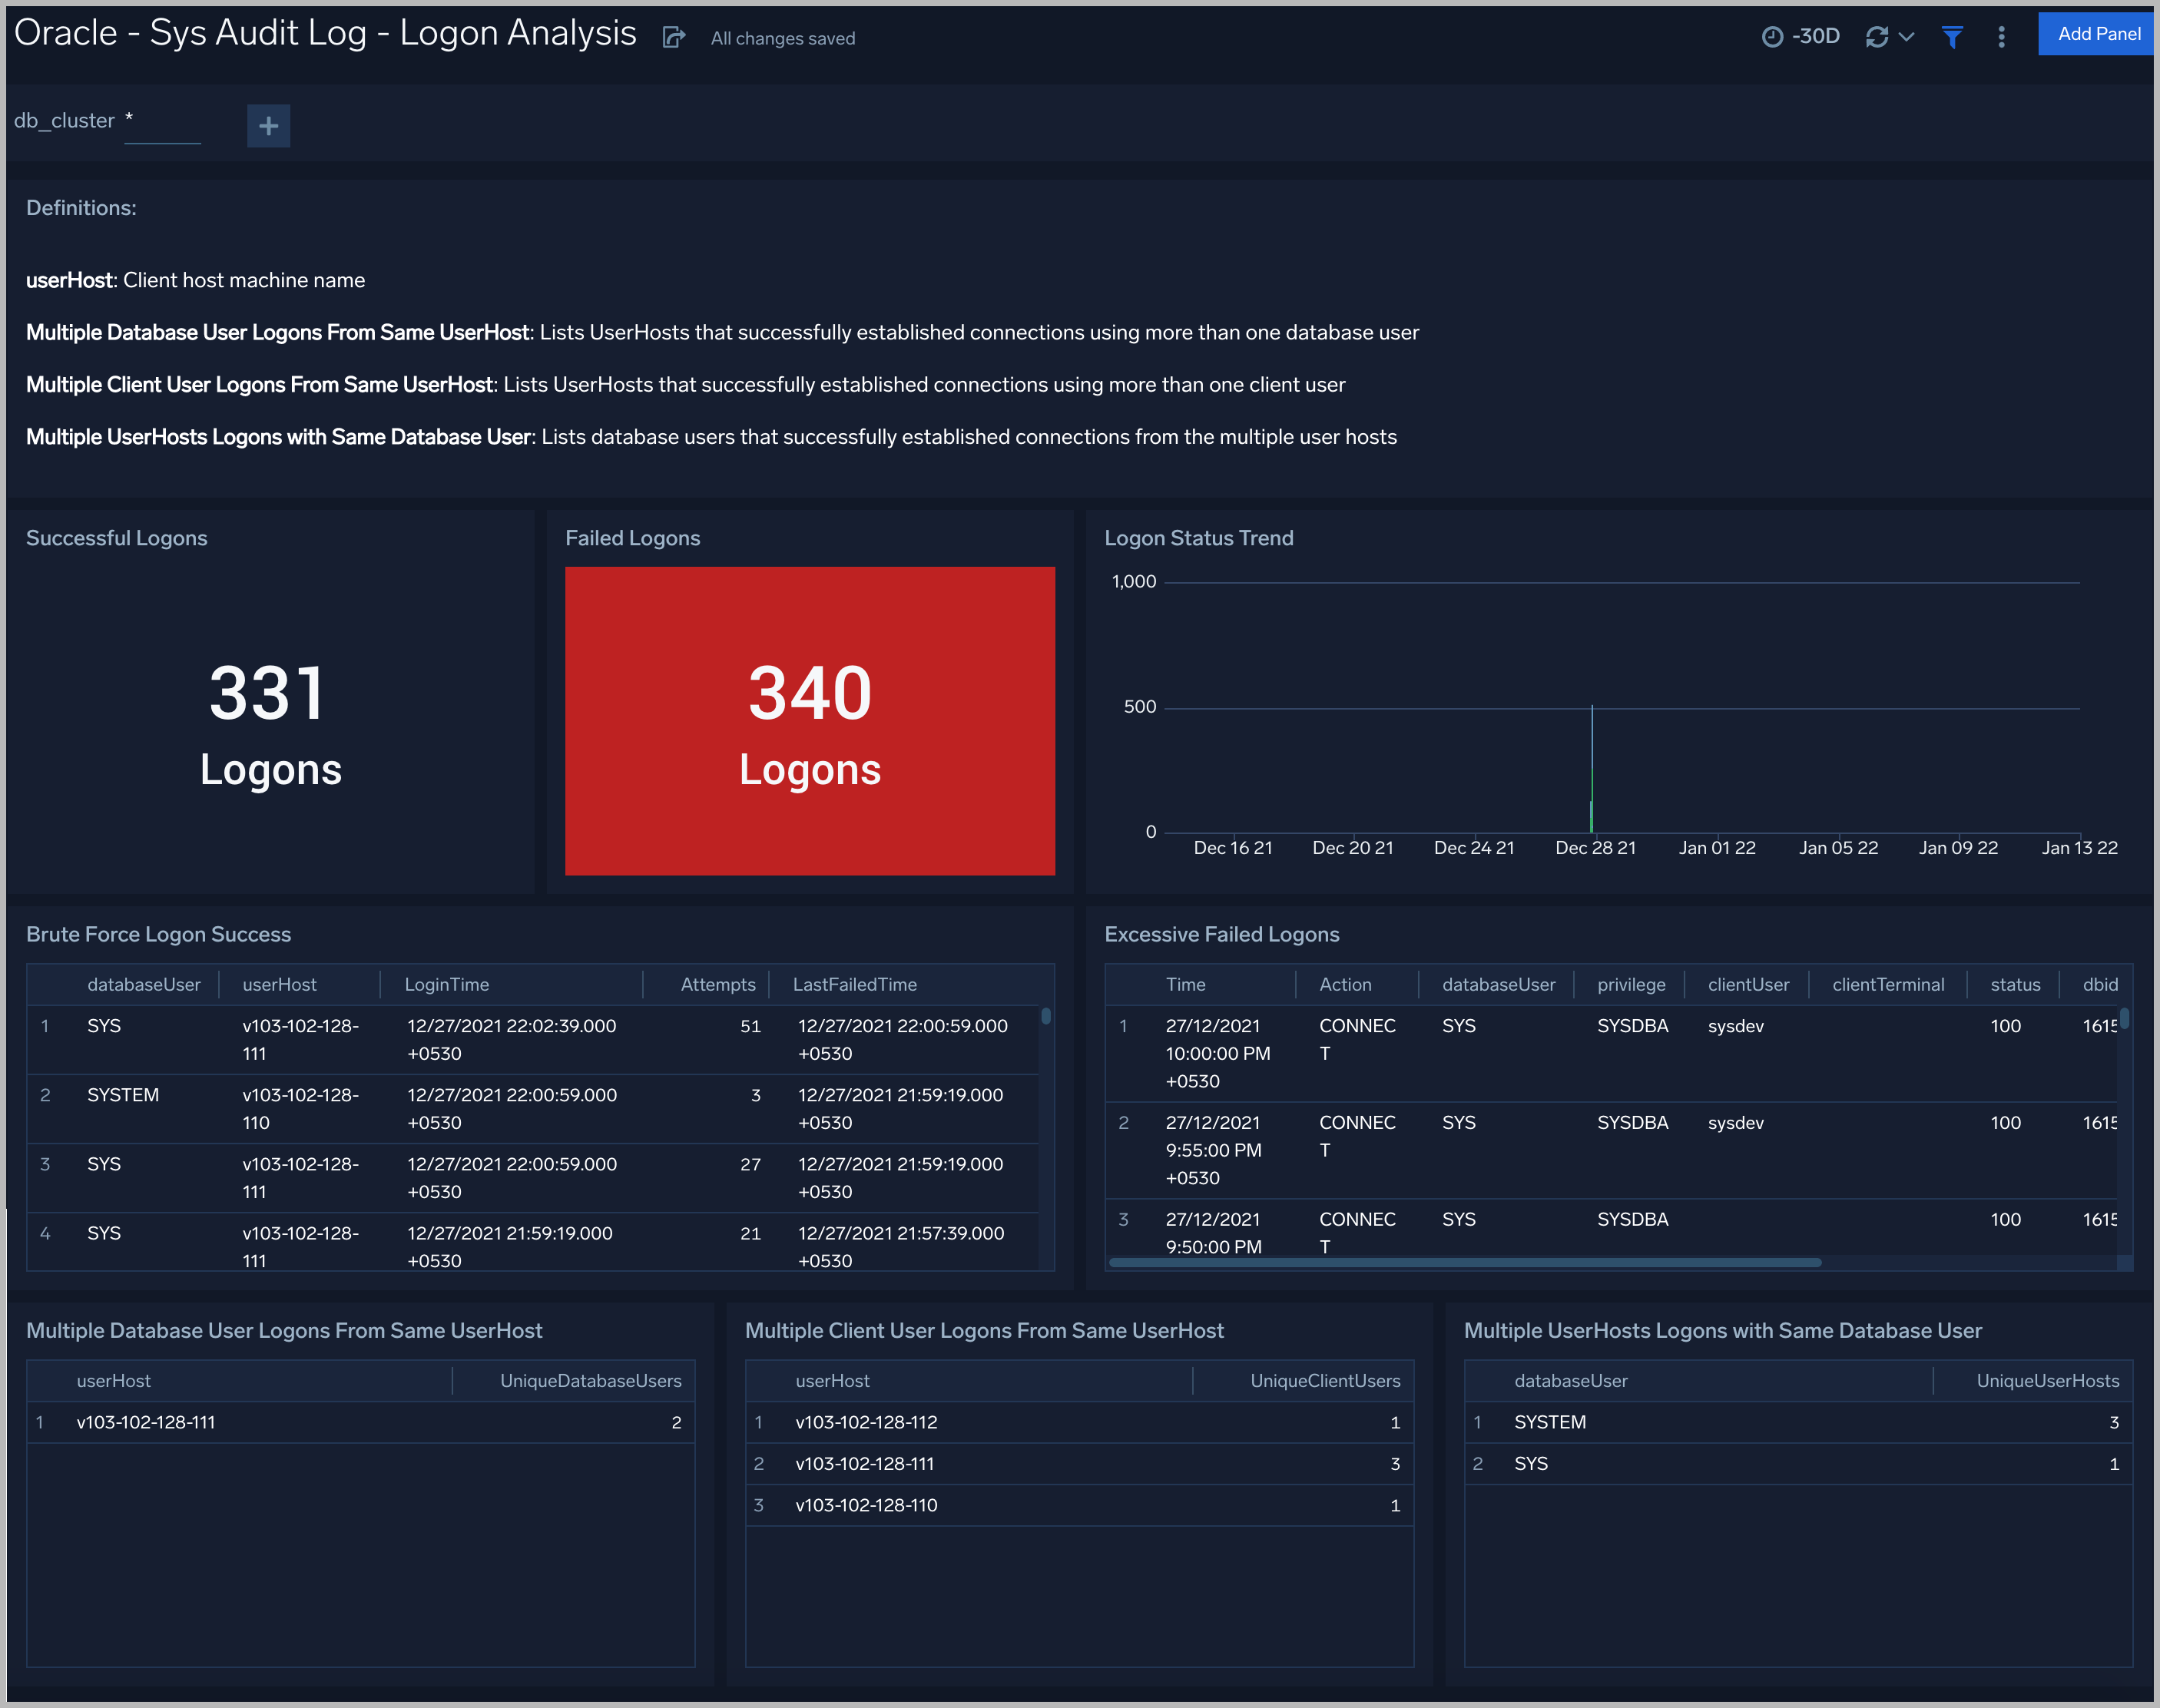
Successful Logons. Count of successful logins in the previous 24 hours.
Failed Logons. Count of failed logins in the previous 24 hours.
Successful Logoffs. Count of successful logoffs in the previous 24 hours.
Logon Activities Trend. Stacked column chart that shows the count of logons and logoffs per one hour timeslice over the previous 24 hours.
Brute Force Login Success. Table that lists information about brute force login attempts that succeeded during the previous three days.
Excessive Failed Logons. A table that lists information about incidents where there were more than five failed logons within 5 minutes during last three days.
Multiple Database User Logons From Same UserHost. A table that lists UserHosts that successfully established connections using more than one database user over the previous 24 hours.
Multiple Client User Logons From Same UserHost. A table that lists UserHosts that successfully established connections using more than one client user over the previous 24 hours.
Multiple UserHosts Logons with Same Database User. A table that lists database users that successfully established connections from the multiple user hosts over the previous 24 hours.
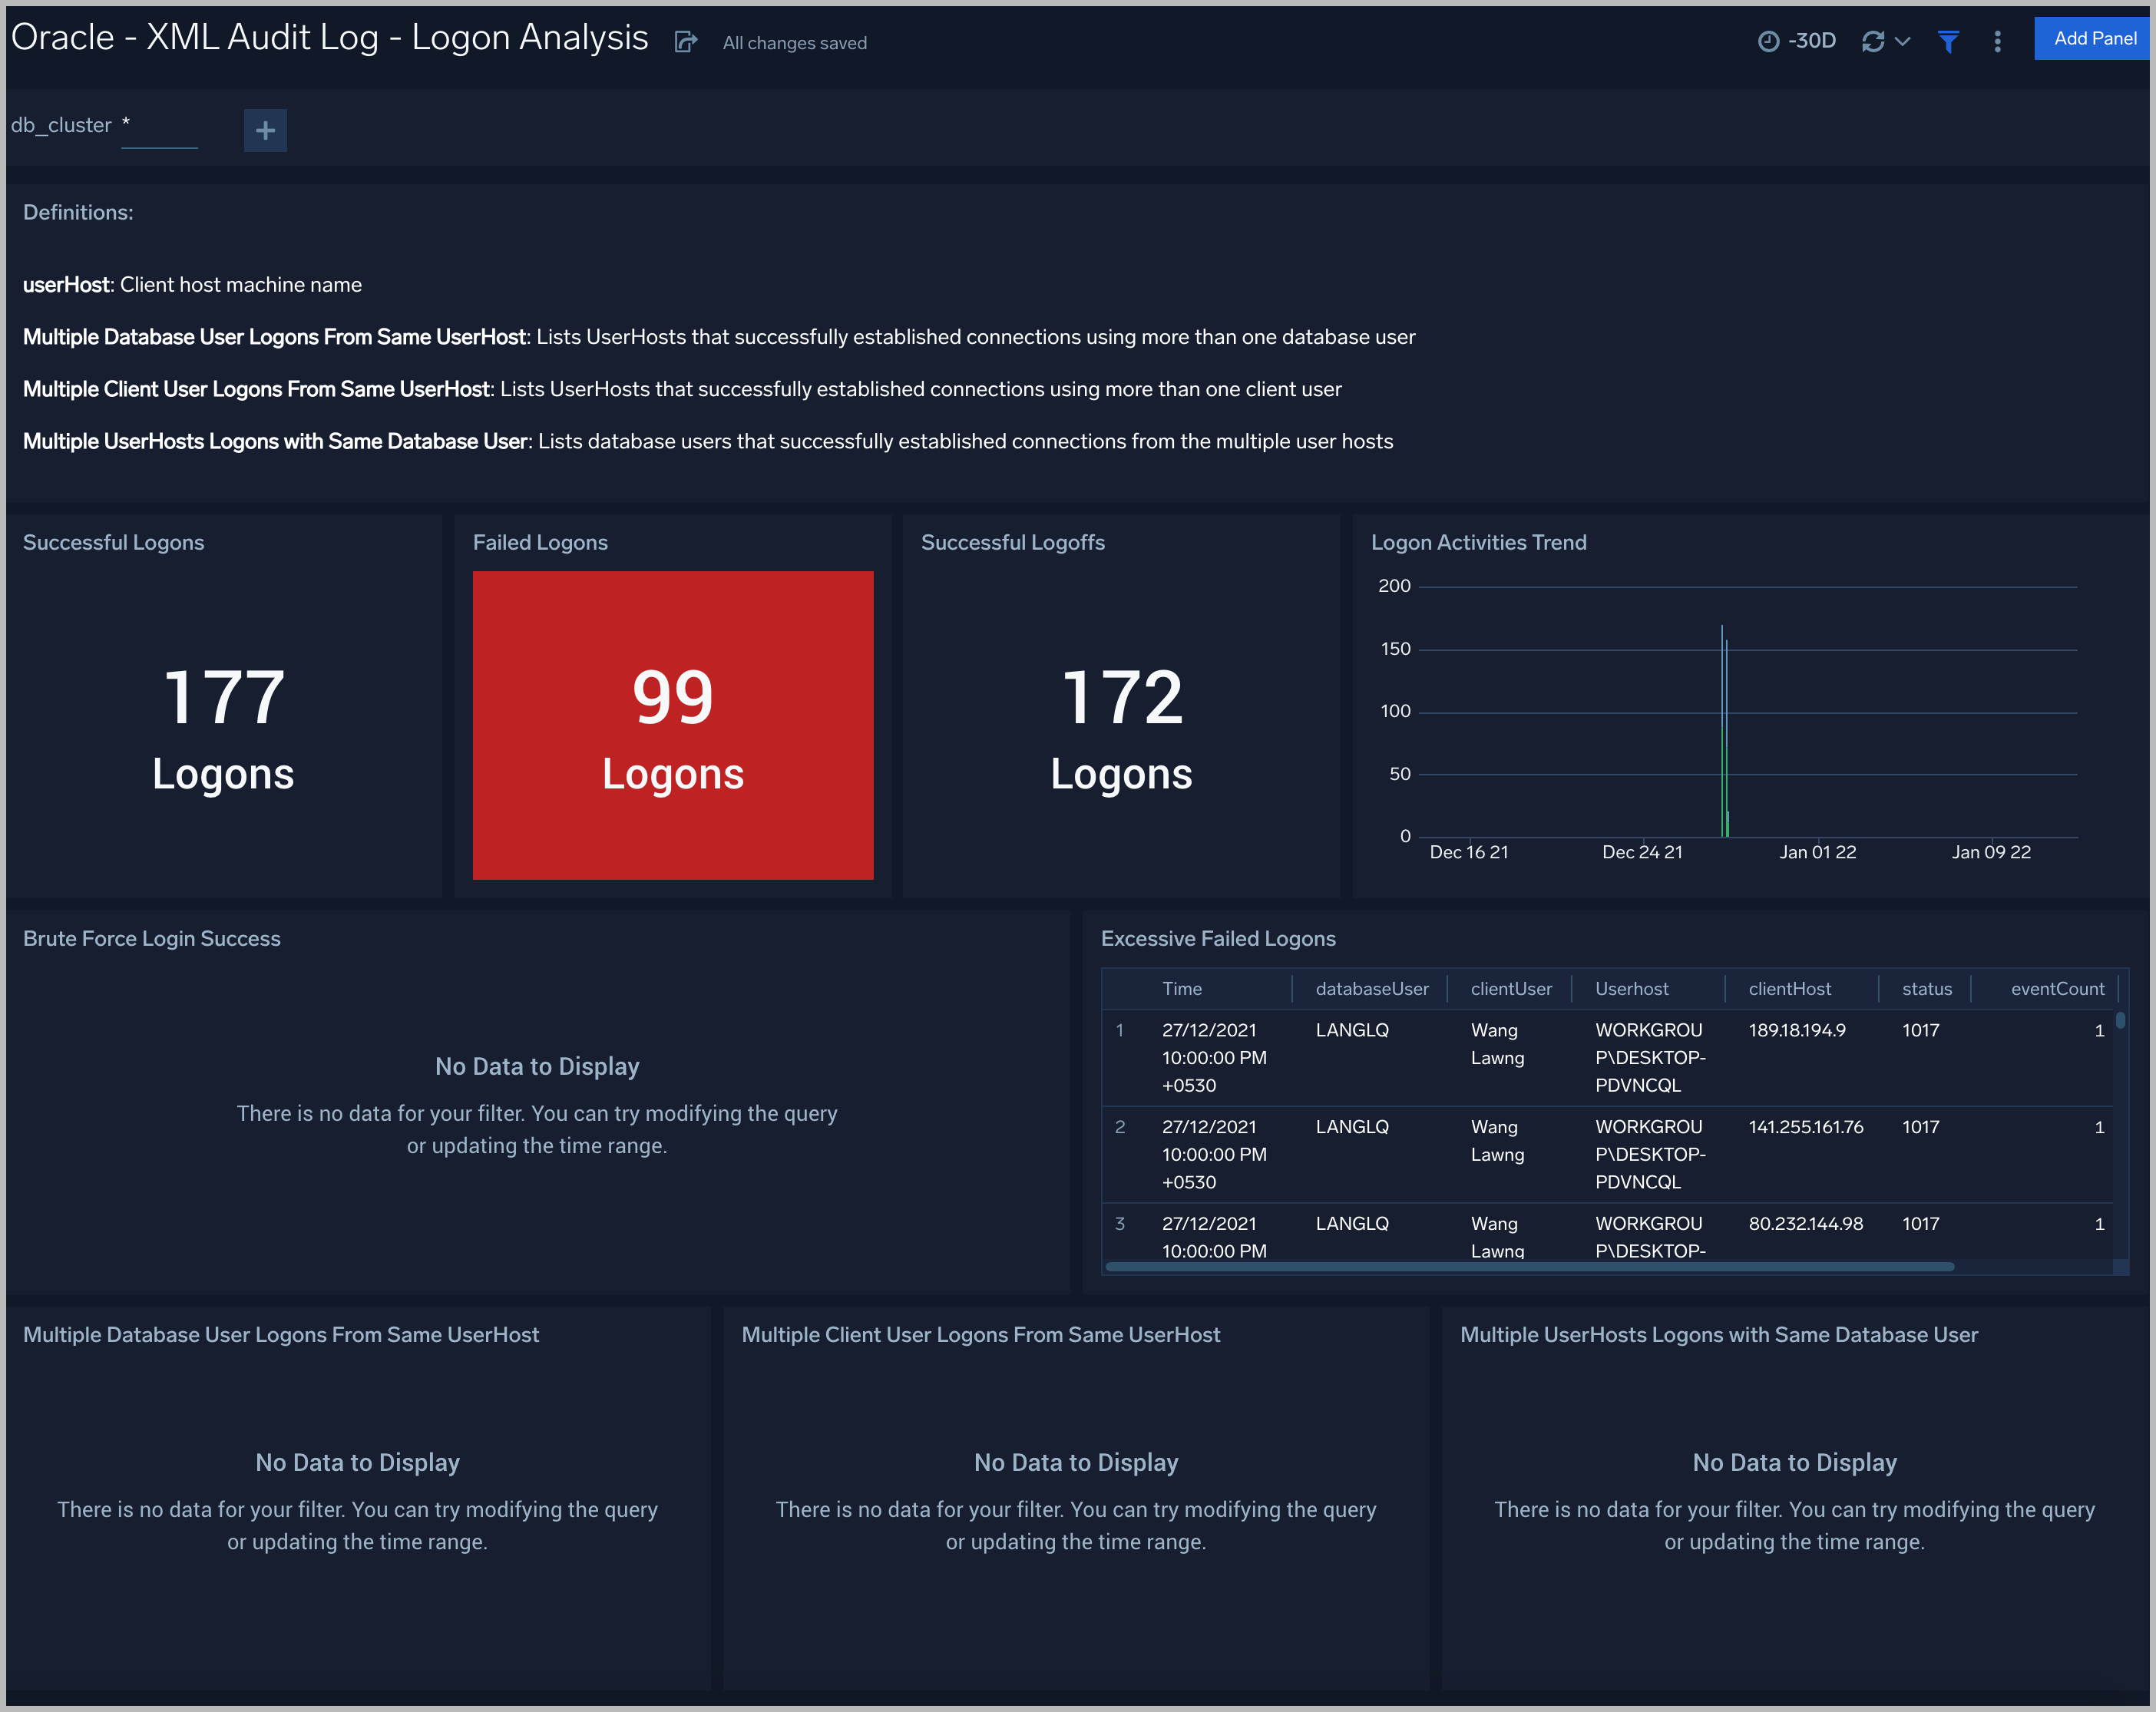
XML Audit Log - Logon Analysis
See logon activity information derived from the XML audit trail, including successful and failed logons, logon status trends, multiple database user logons and client user logons from the same UserHost, and multiple UserHost logons with the same database user.
XML Audit Log - SQL Statement Analysis
See information derived from the XML audit trail about user management, role management, Data Definition Language (DDL), Data Manipulation Language (DML), and Transaction Control Language (TCL) activity.
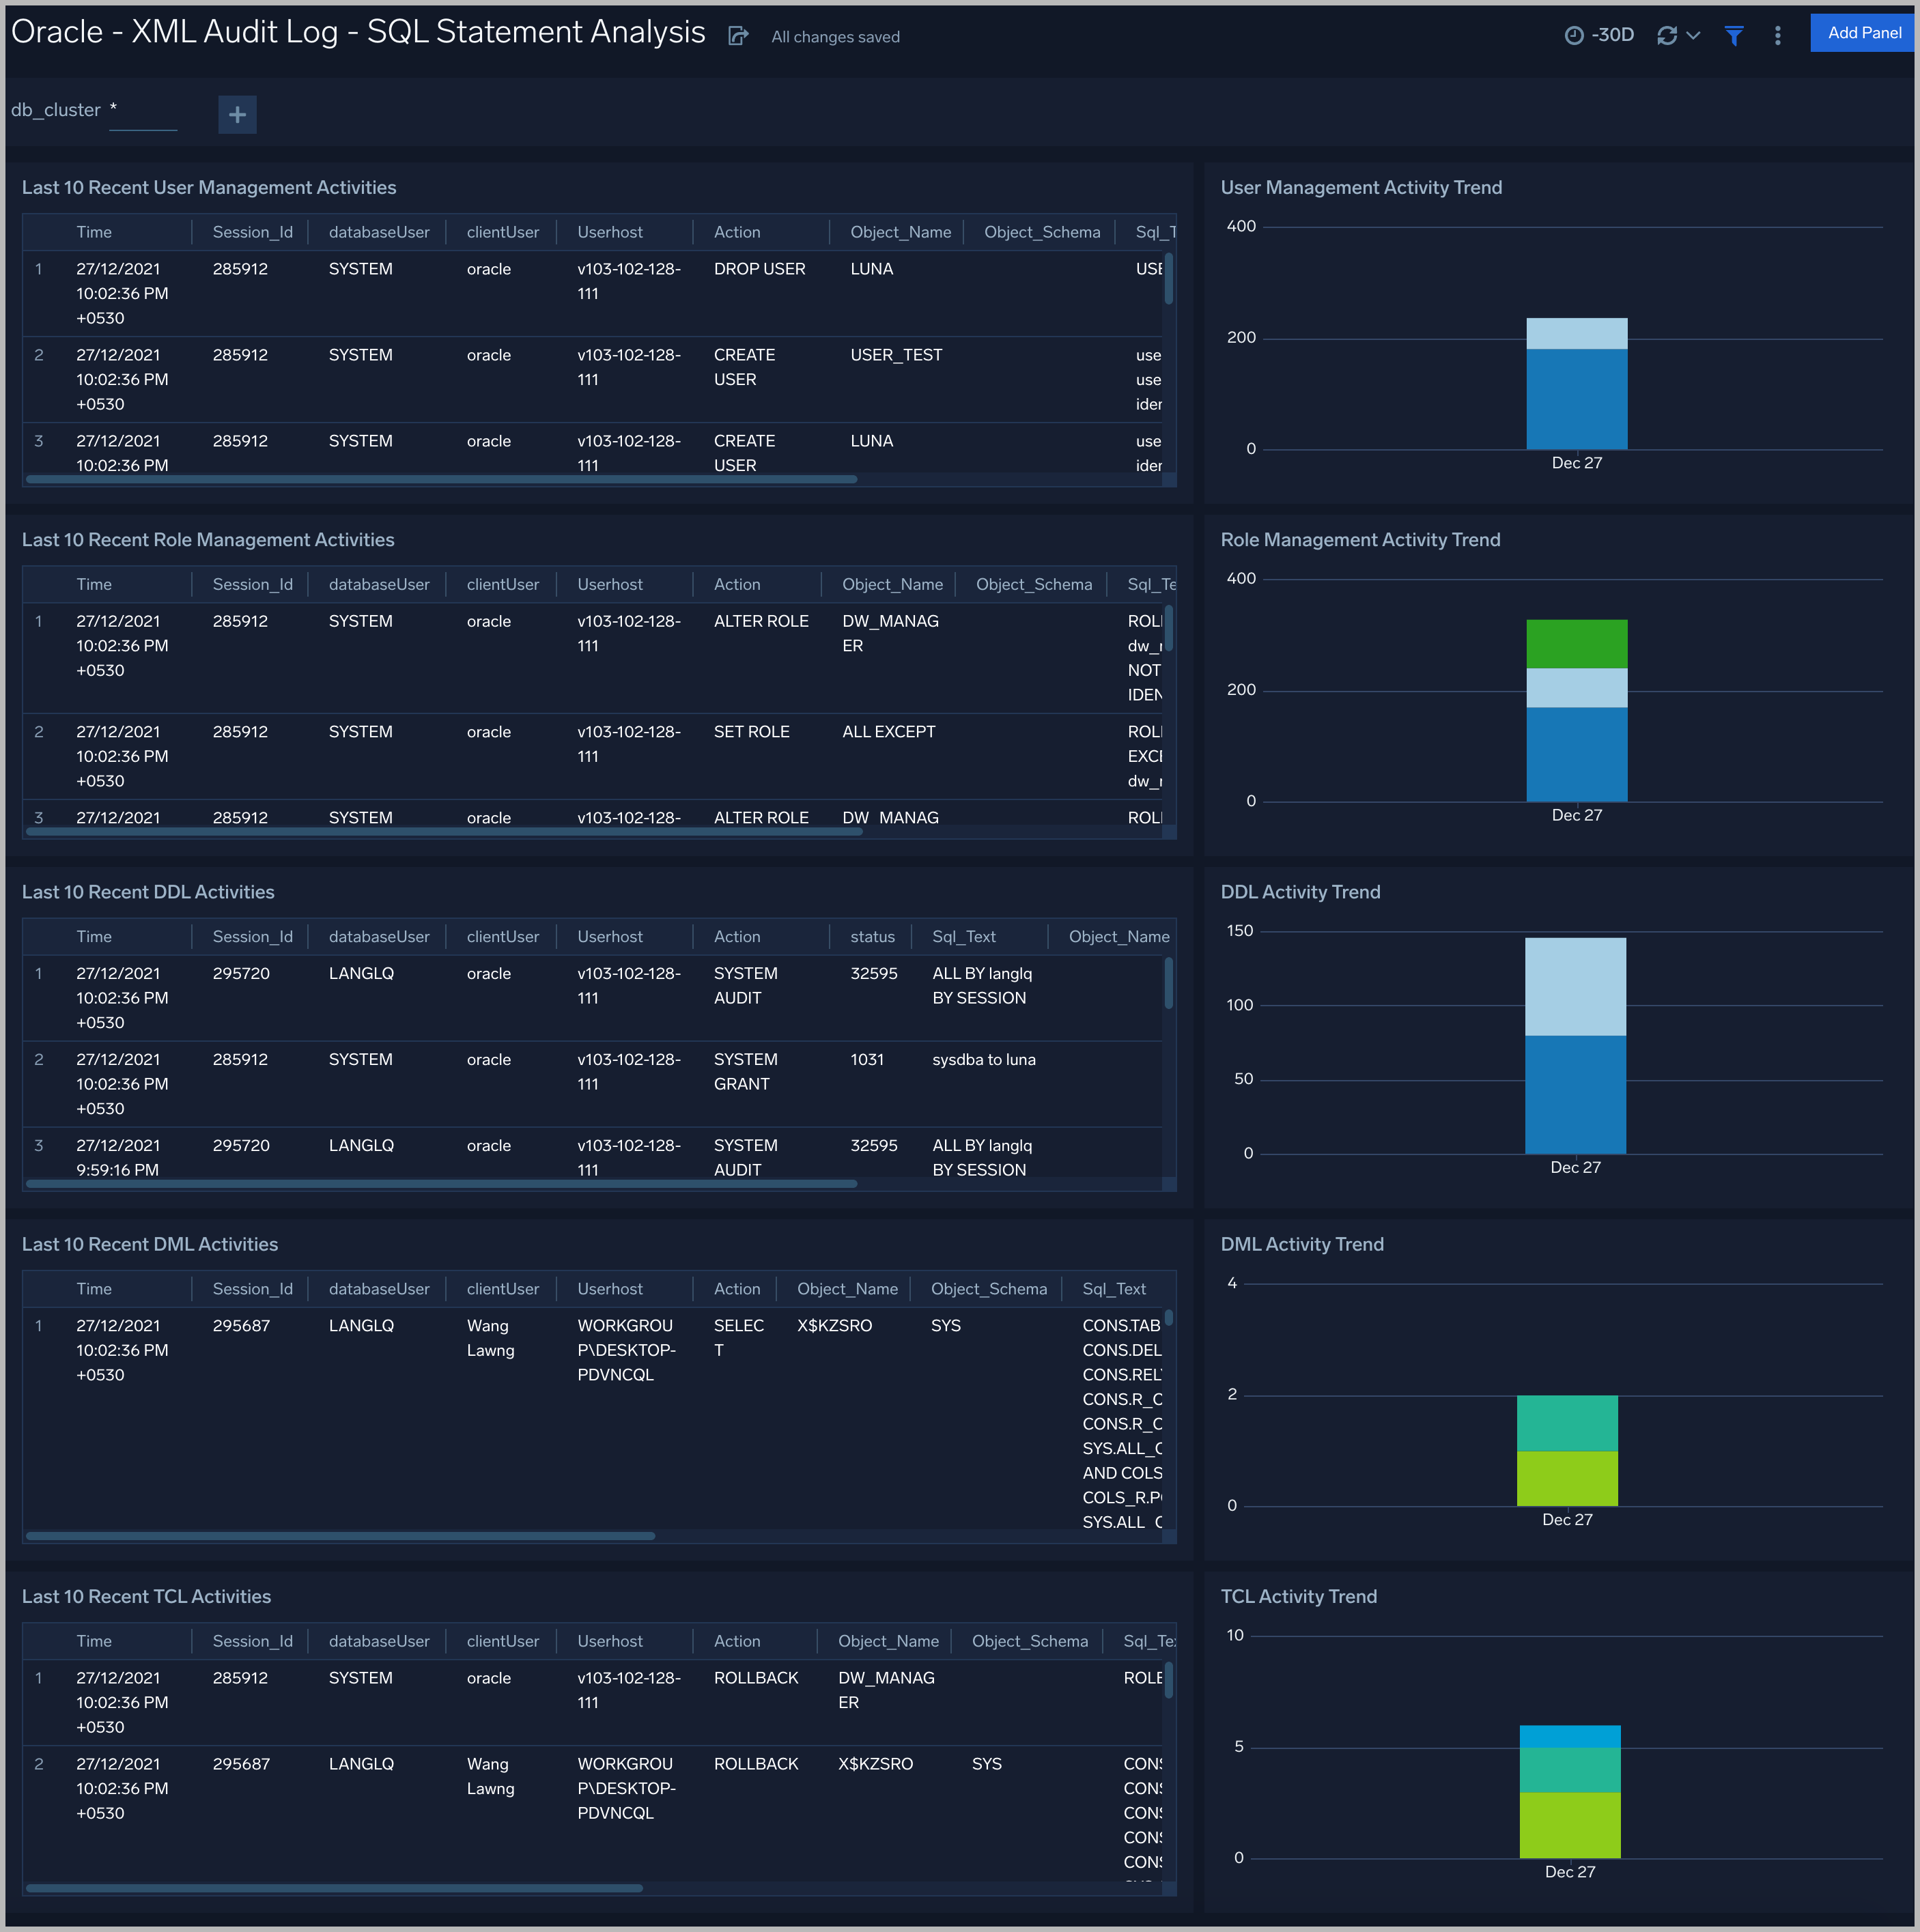
Recent User Management Activities. A table that lists information about user management activities in the previous 24 hours.
User Management Activity Trend. A stacked column chart that shows the count of user management actions by action type per one hour timeslice over the last 7 days.
Recent Role Management Activities. A table that lists information about role management activities in the previous 24 hours.
Role Management Activity Trend. A stacked column chart that shows the count of role management actions by action type per one hour timeslice over the last 7 days.
Recent DDL Activities. A table that lists information about Data Definition Language (DDL) activities in the previous 24 hours.
DDL Activity Trend. A stacked column chart that shows the count of DDL actions by action type per one hour timeslice over the last 7 days.
Recent DML Activities. A table that lists information about Data Manipulation Language (DML) activities in the previous 24 hours.
DML Activity Trend. DDL Activity Trend. A stacked column chart that shows the count of DML actions by action type per one hour timeslice over the last 7 days.
Recent TCL Activities. A table that lists information Transaction Control Language (TCL) activities in the previous 24 hours.
TCL Activity Trend. A stacked column chart that shows the count of DML actions by action type per one hour timeslice over the last 7 days.
Monitor Performance by DB Script
See database usage information obtained by the Oracle script source, including tablespace and datafile utilization; recent active connections; wait times; and recent jobs.
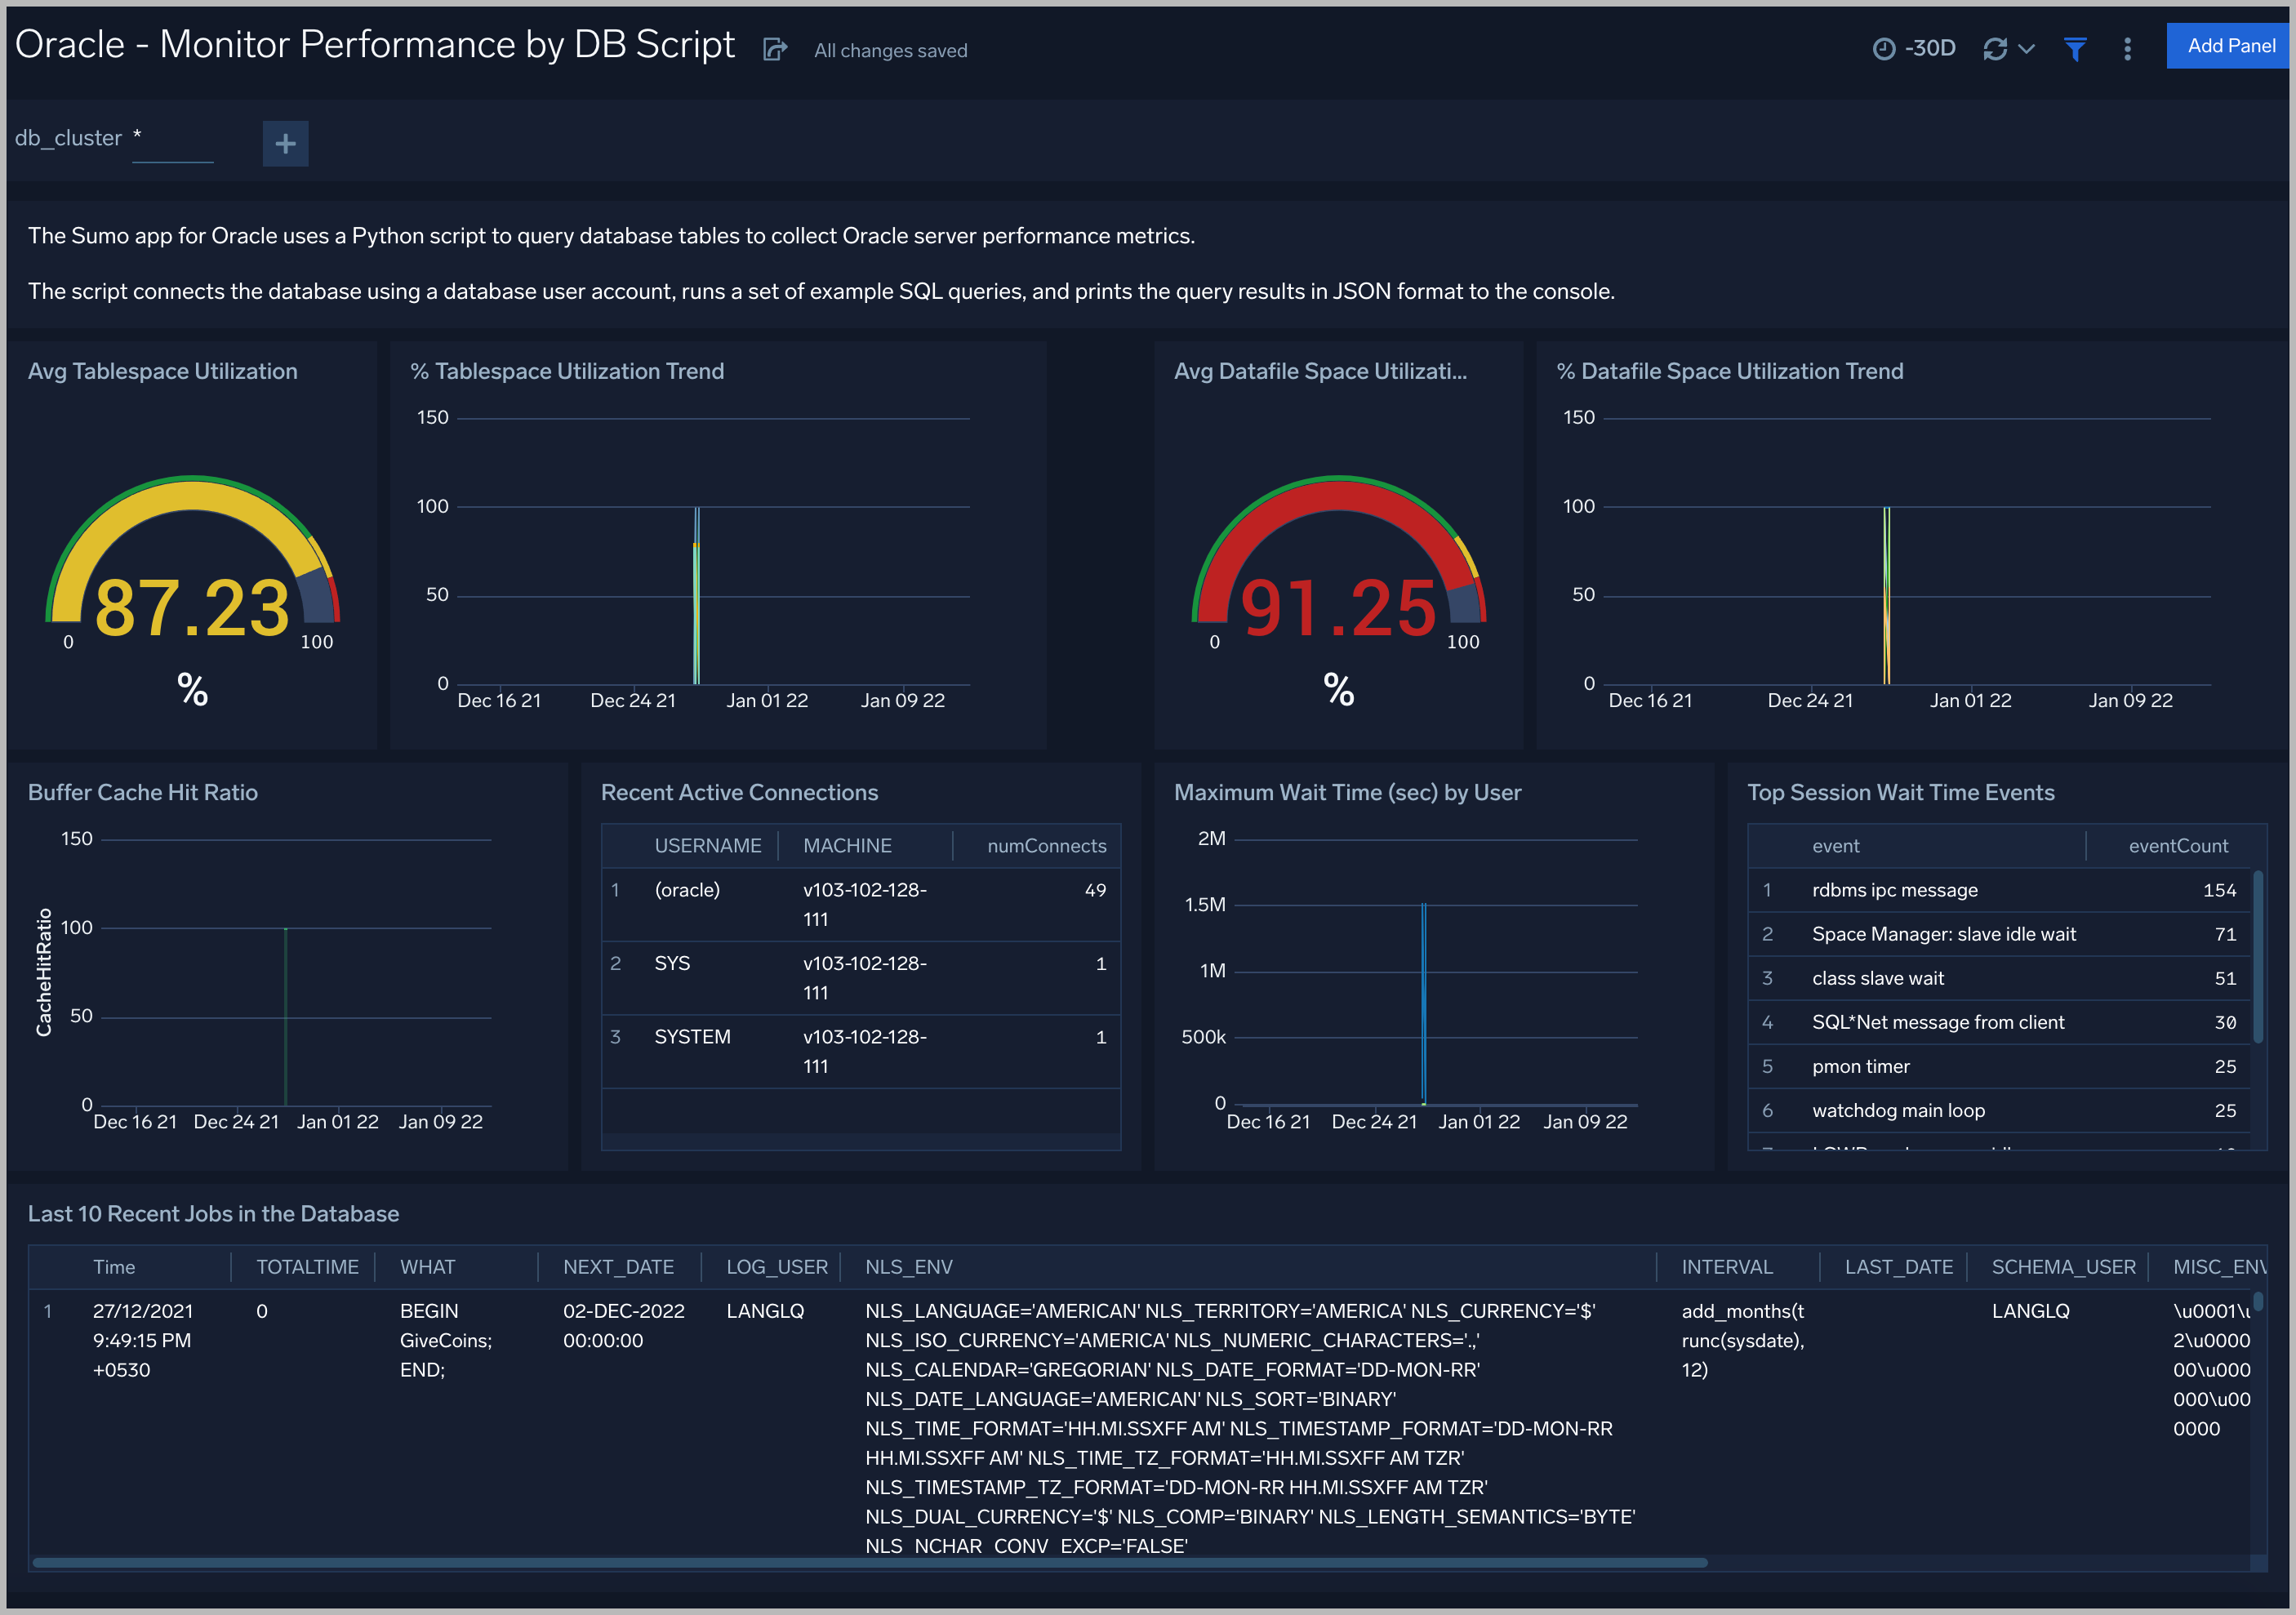
TableSpace Utilization. A table that shows, for each tablespace, the percentage of tablespace used for each 5 minute timeslice over the last 60 minutes.
TableSpace Utilization Trend. A line chart that shows, for each tablespace, the percentage of tablespace used over the last 24 hours.
Datafile Space Utilization. A table that shows, for each database file (.dbf), the percentage of allocated file space used for each 5 minute timeslice over the last 60 minutes.
Datafile Space Utilization Trend. A line chart that shows, for each database file (.dbf), the percentage of allocated file space used over the last 24 hours.
Buffer Cache Hit Ratio. An area chart that shows the buffer cache hit ratio for each 5 minute timeslice over the last 60 minutes.
Recent Active Connections. A table of information about recent active connections, including the user, machine, and number of connections.
Maximum Wait Time (sec) by User. A line chart that shows, for each user, the session wait times for each 5 minute timeslice over the last 60 minutes.
Top Session Wait Time Events. A table that shows the top 10 event types associated with session waits, and the count of each event type.
Recent Jobs in the database. A table of information about recent database jobs, including when each job ran, low long it ran, and when it will next run.
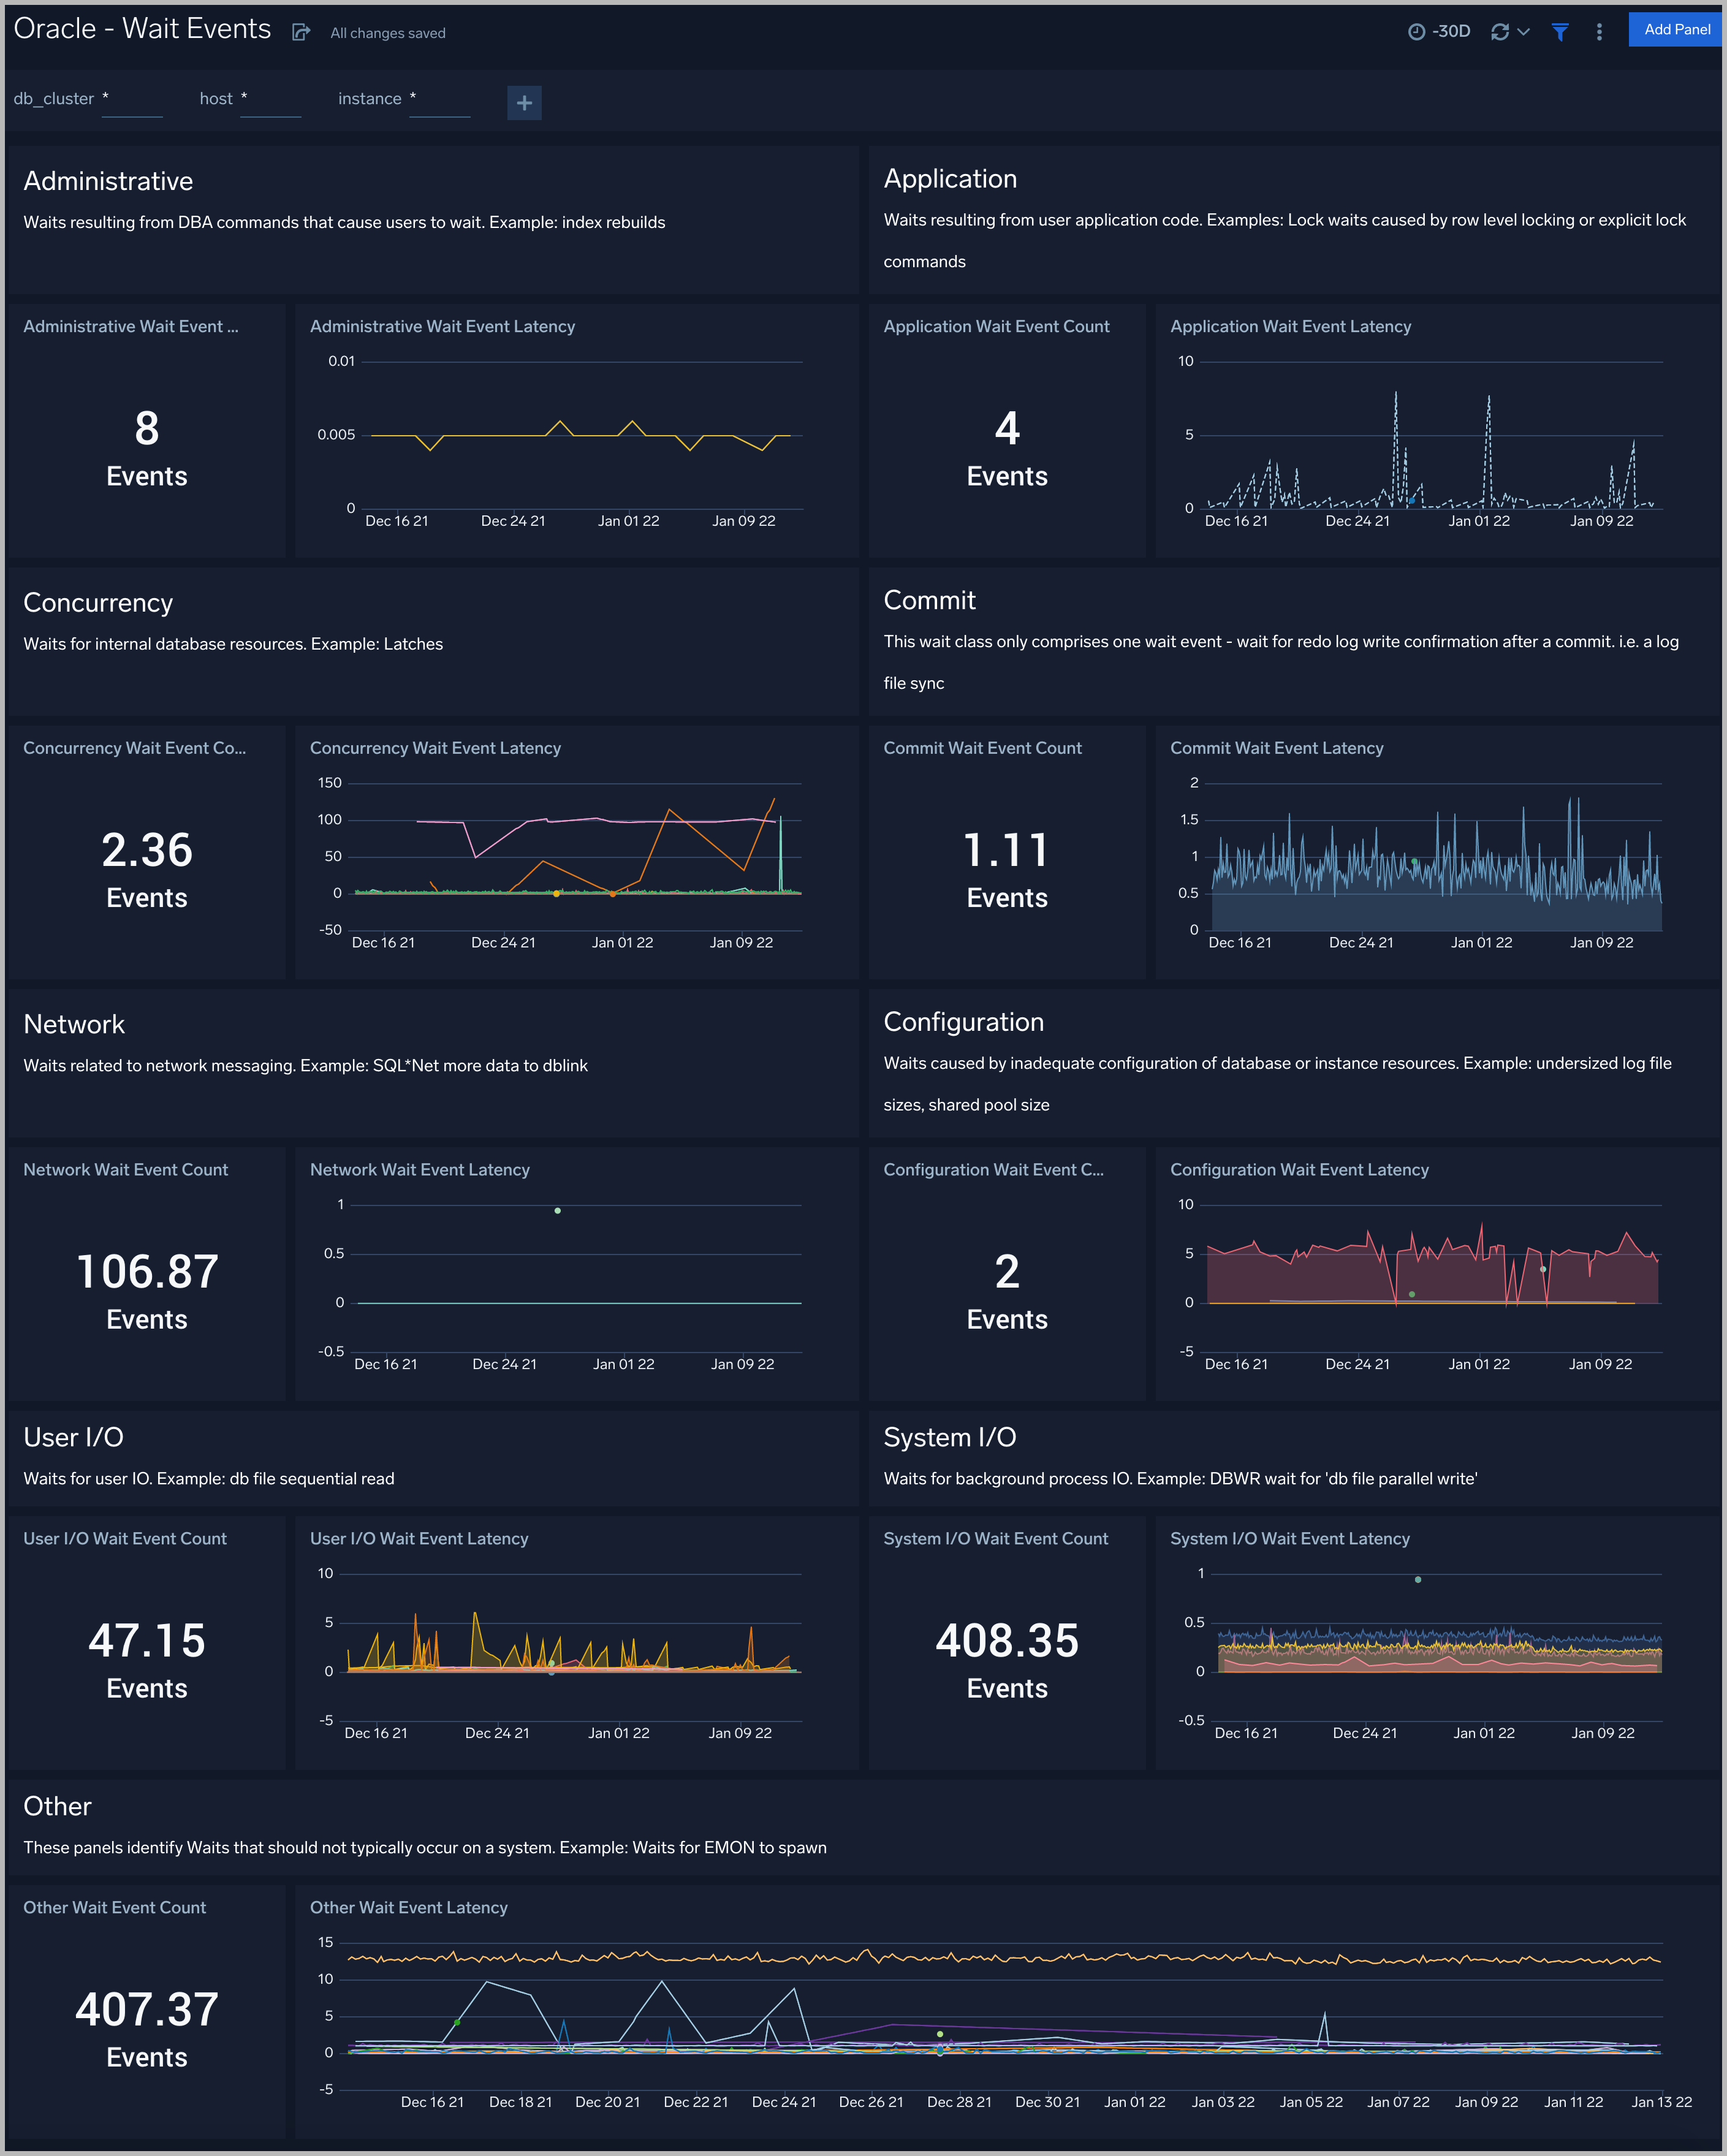
Wait Events
Every wait event belongs to a class of wait events. The following list describes each of the wait classes.
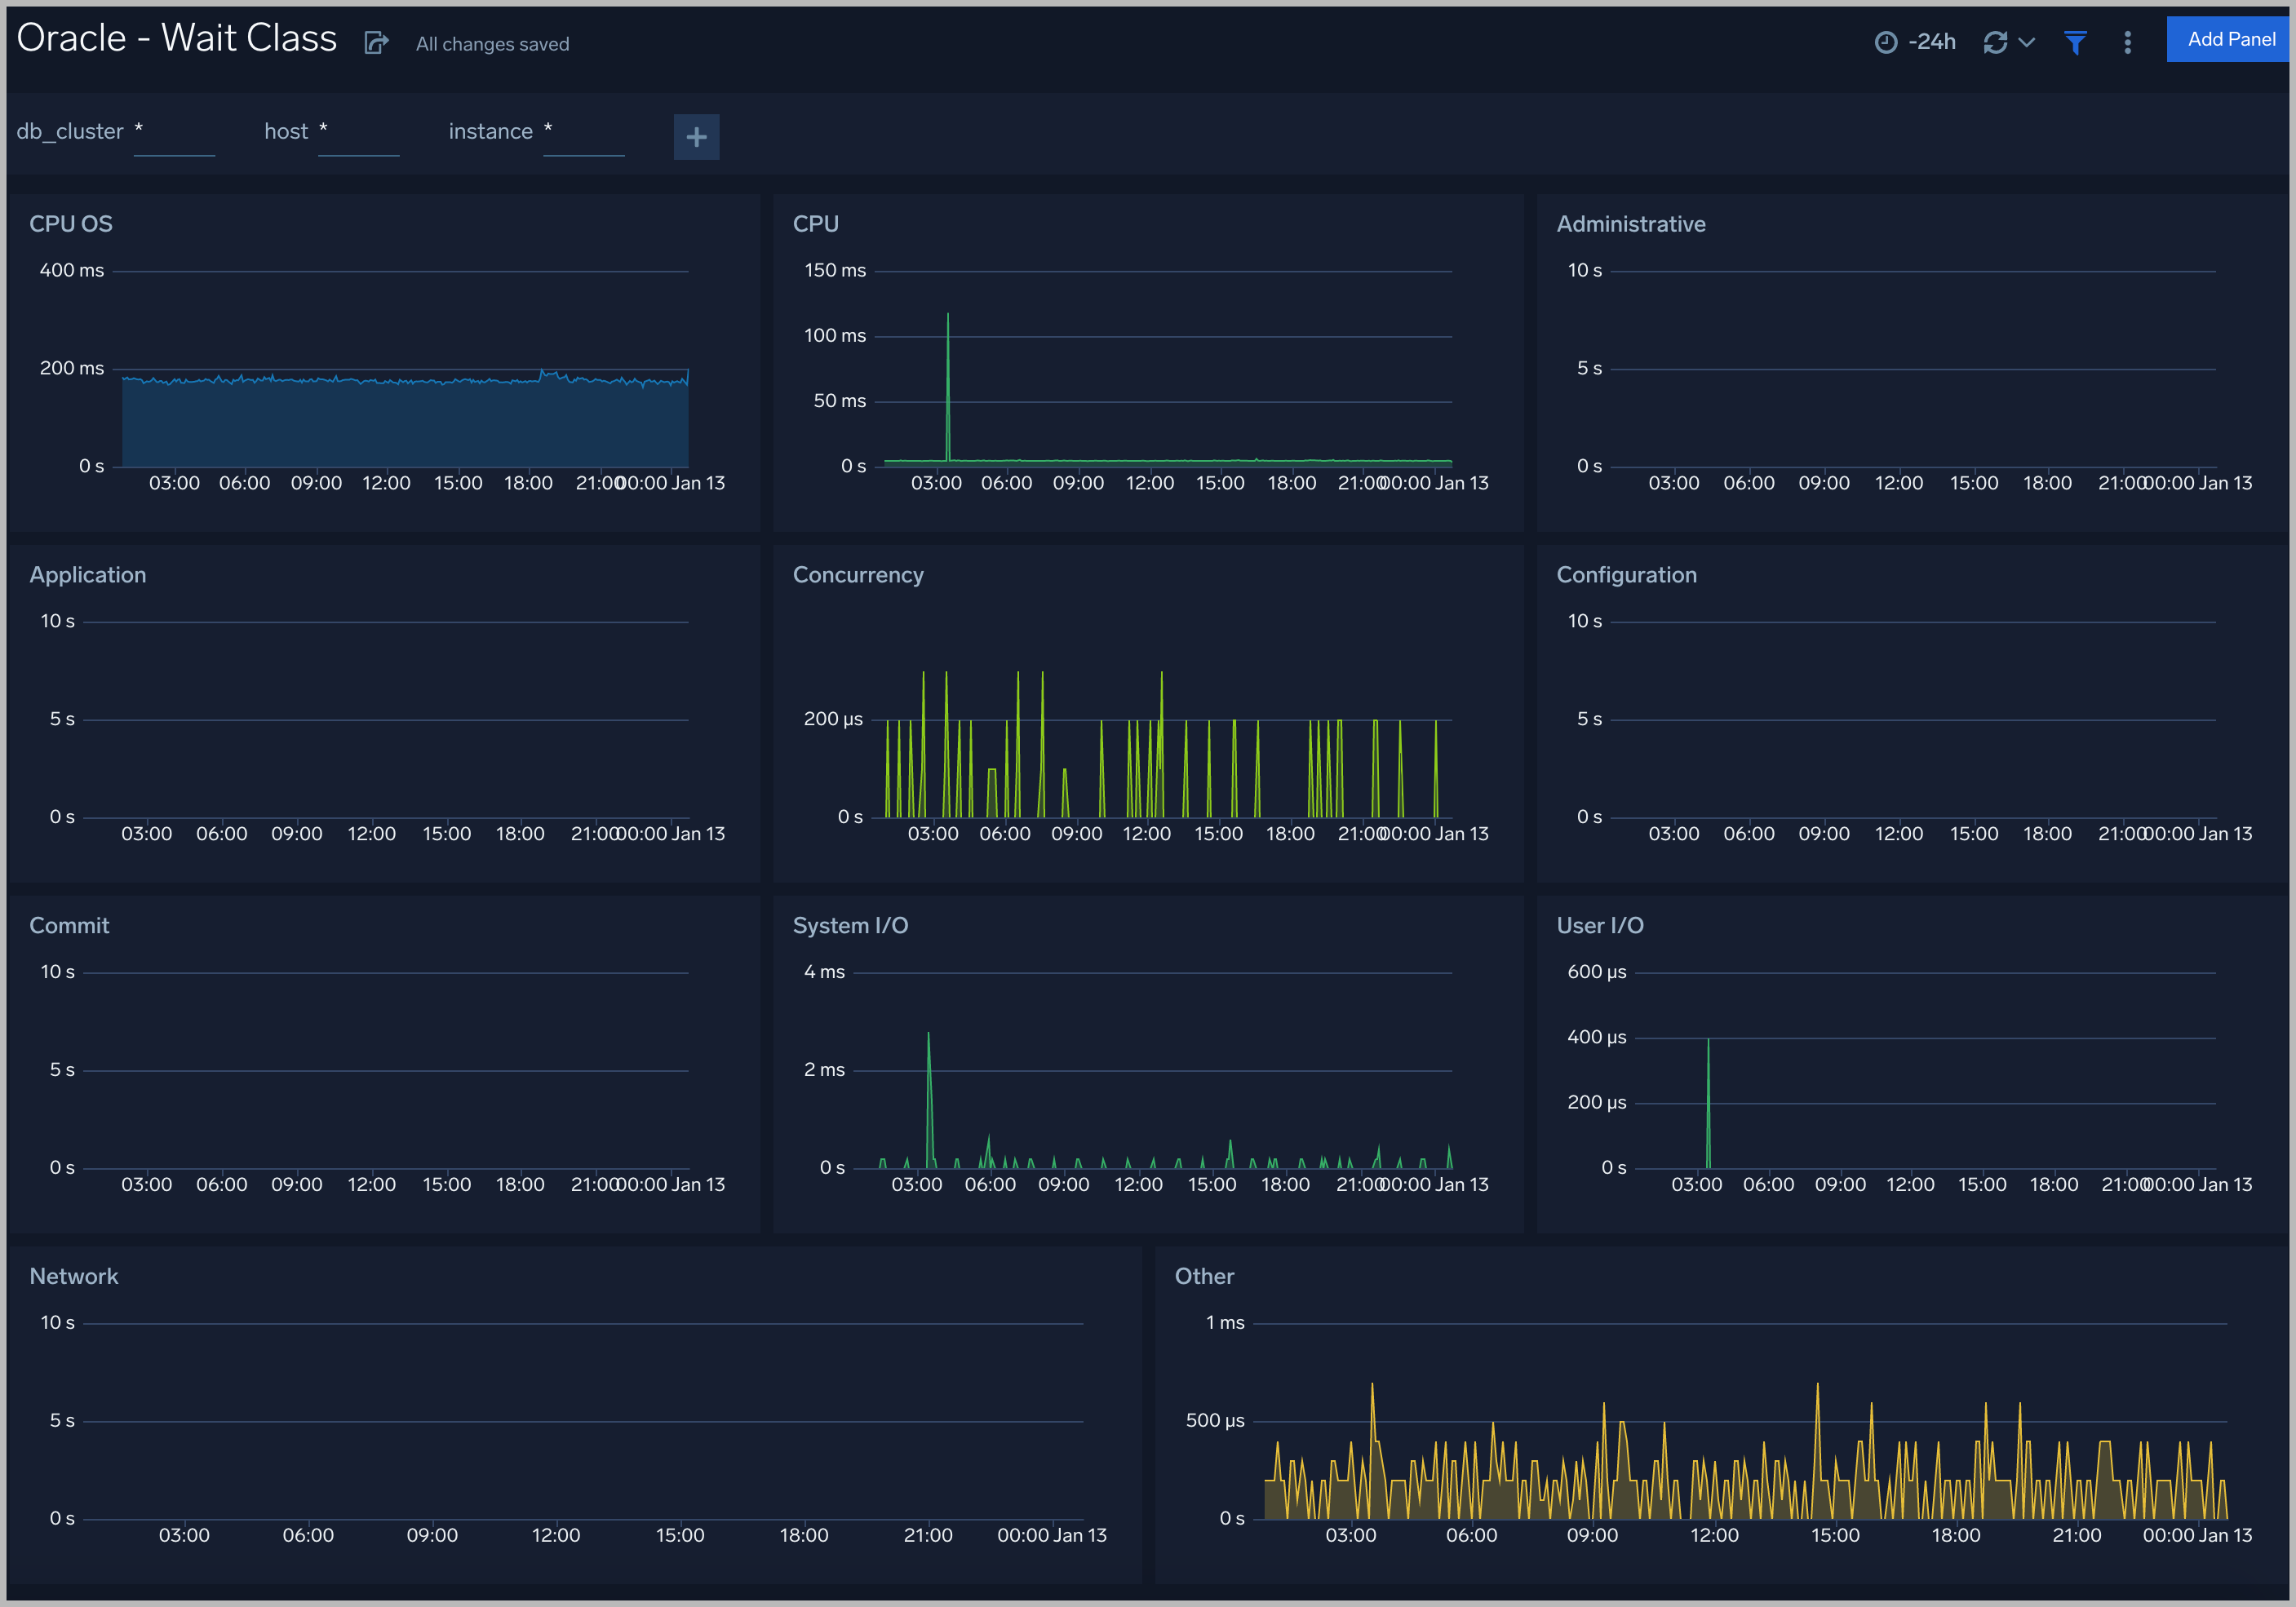
Wait Class
All the wait events are grouped under wait classes and here are the most important wait classes you must know: Administrative, Application, Commit, Concurrency, Configuration, Idle, Network, Other, System I/O, User I/O.
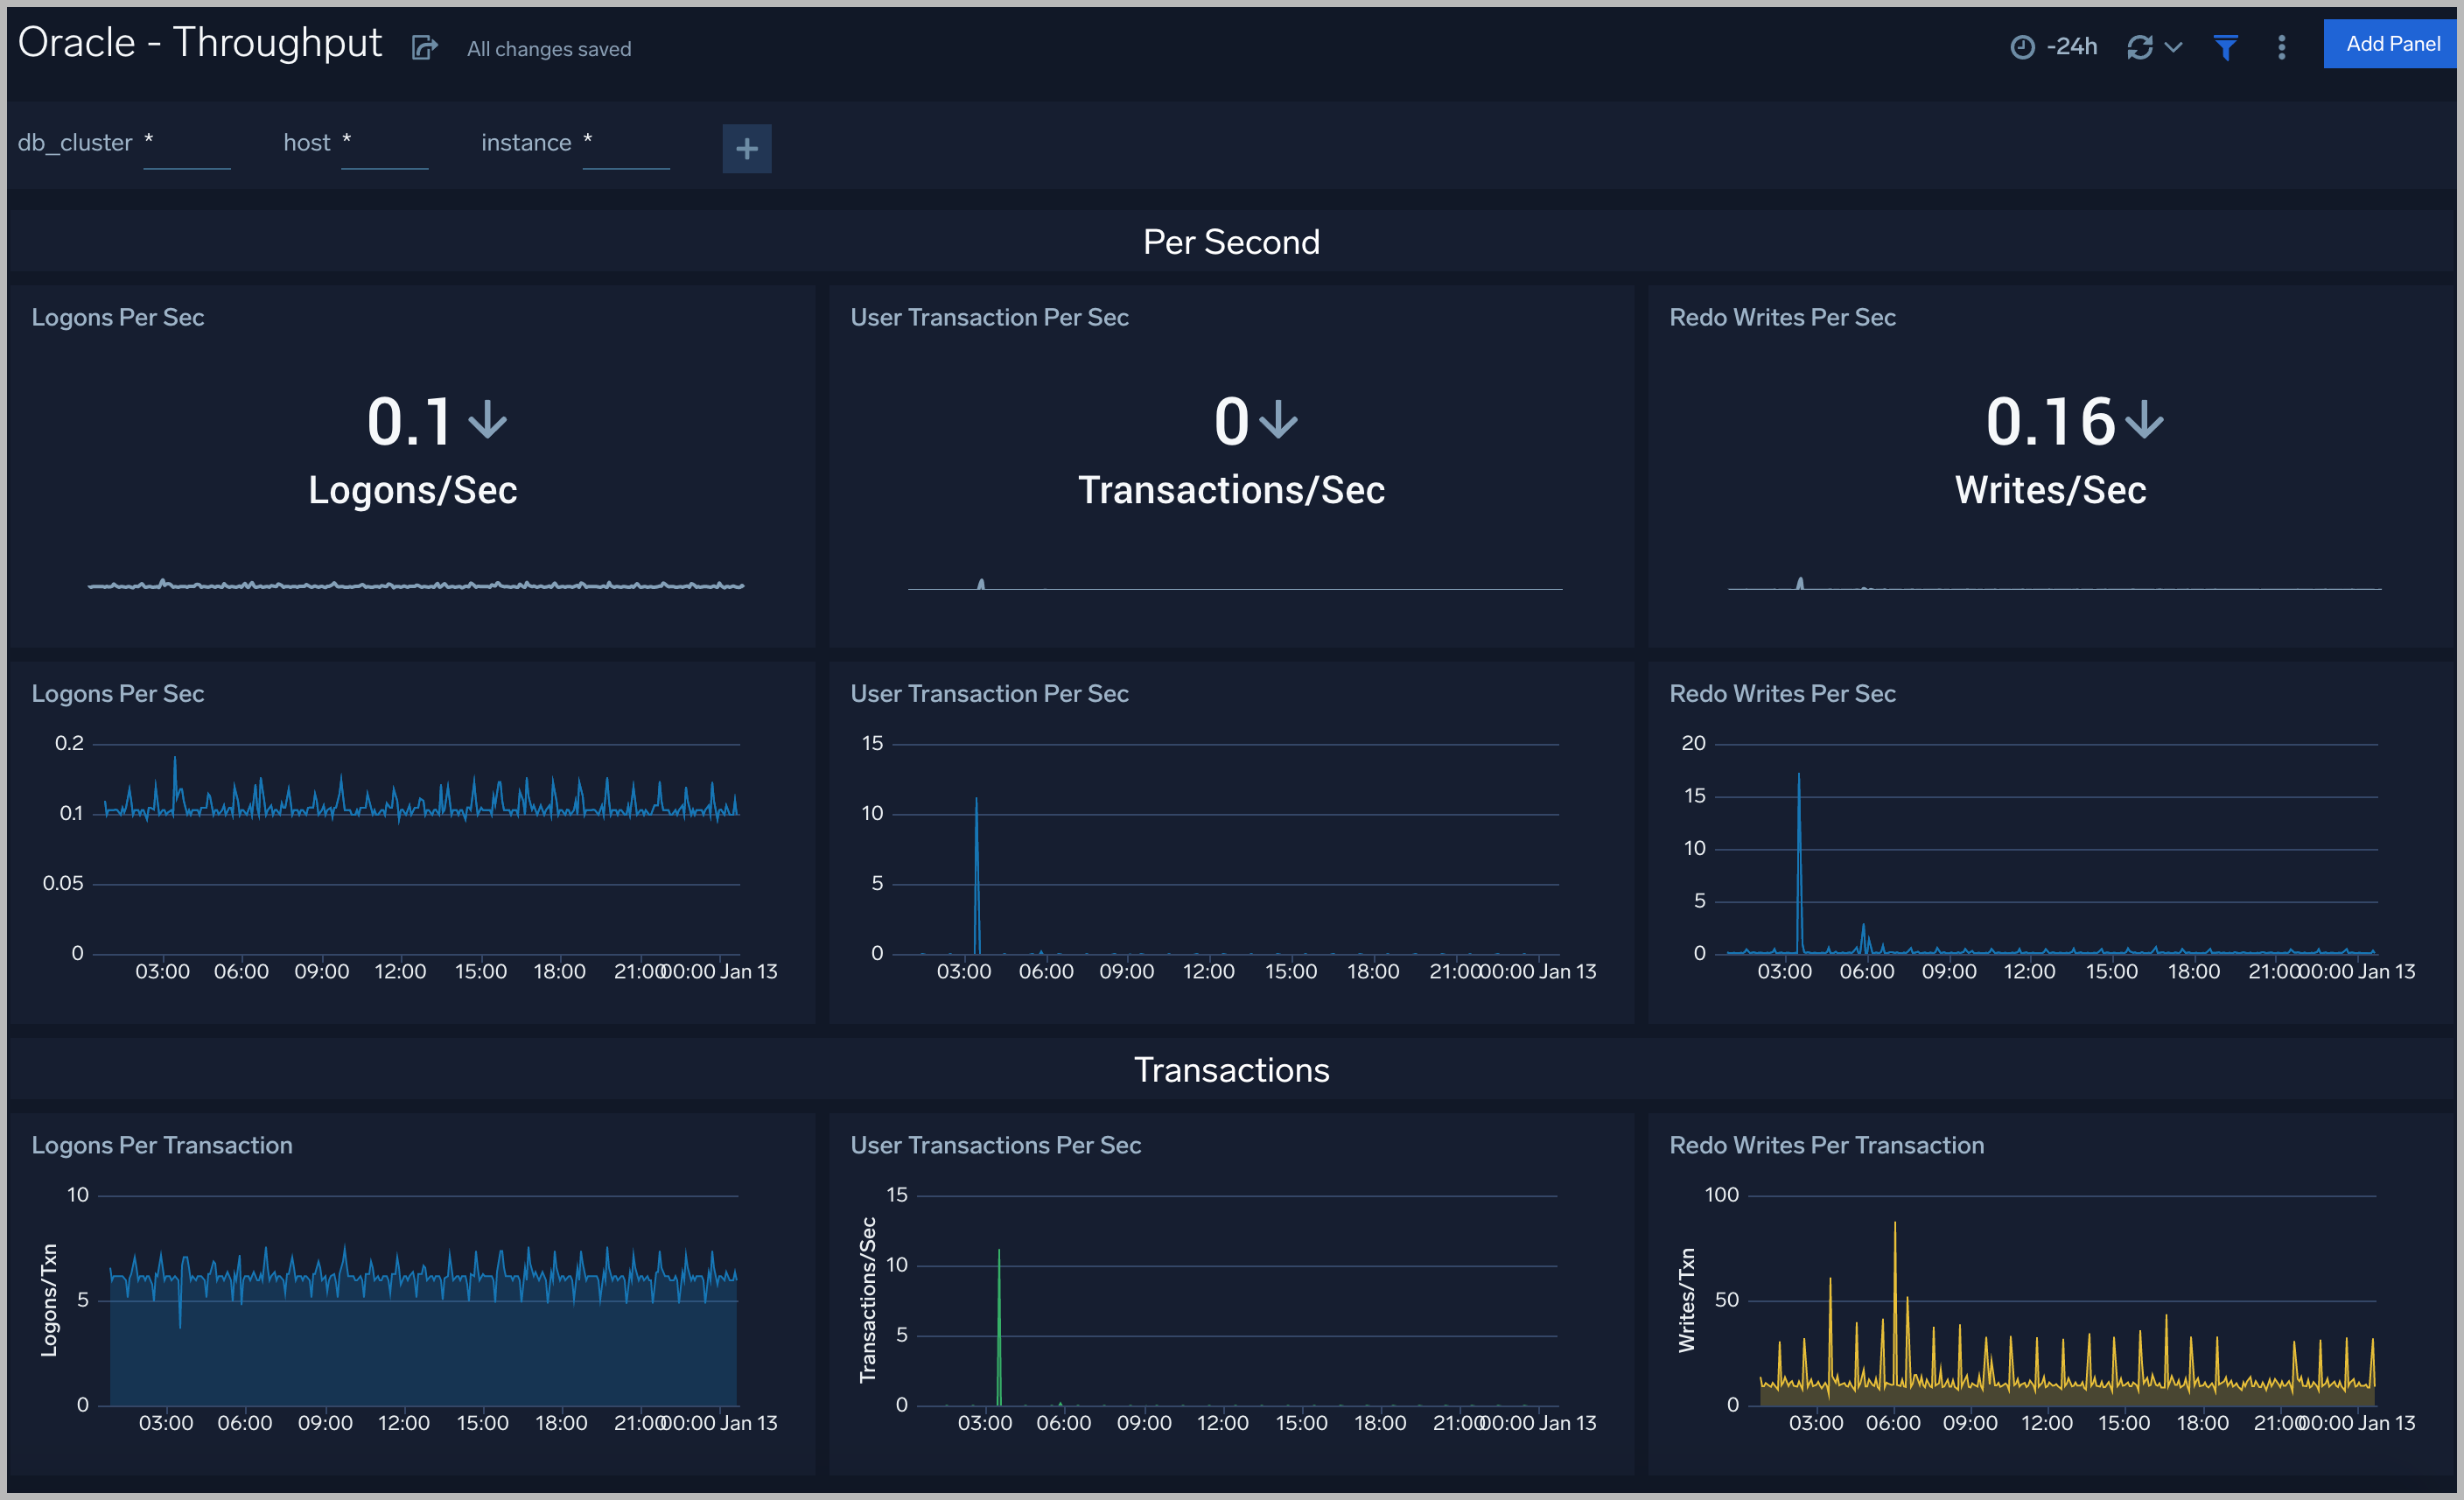
Throughput
The Oracle - Throughput dashboard provides an at-a-glance view of the state of system loads in clusters: Logon, Transaction, and Redo.
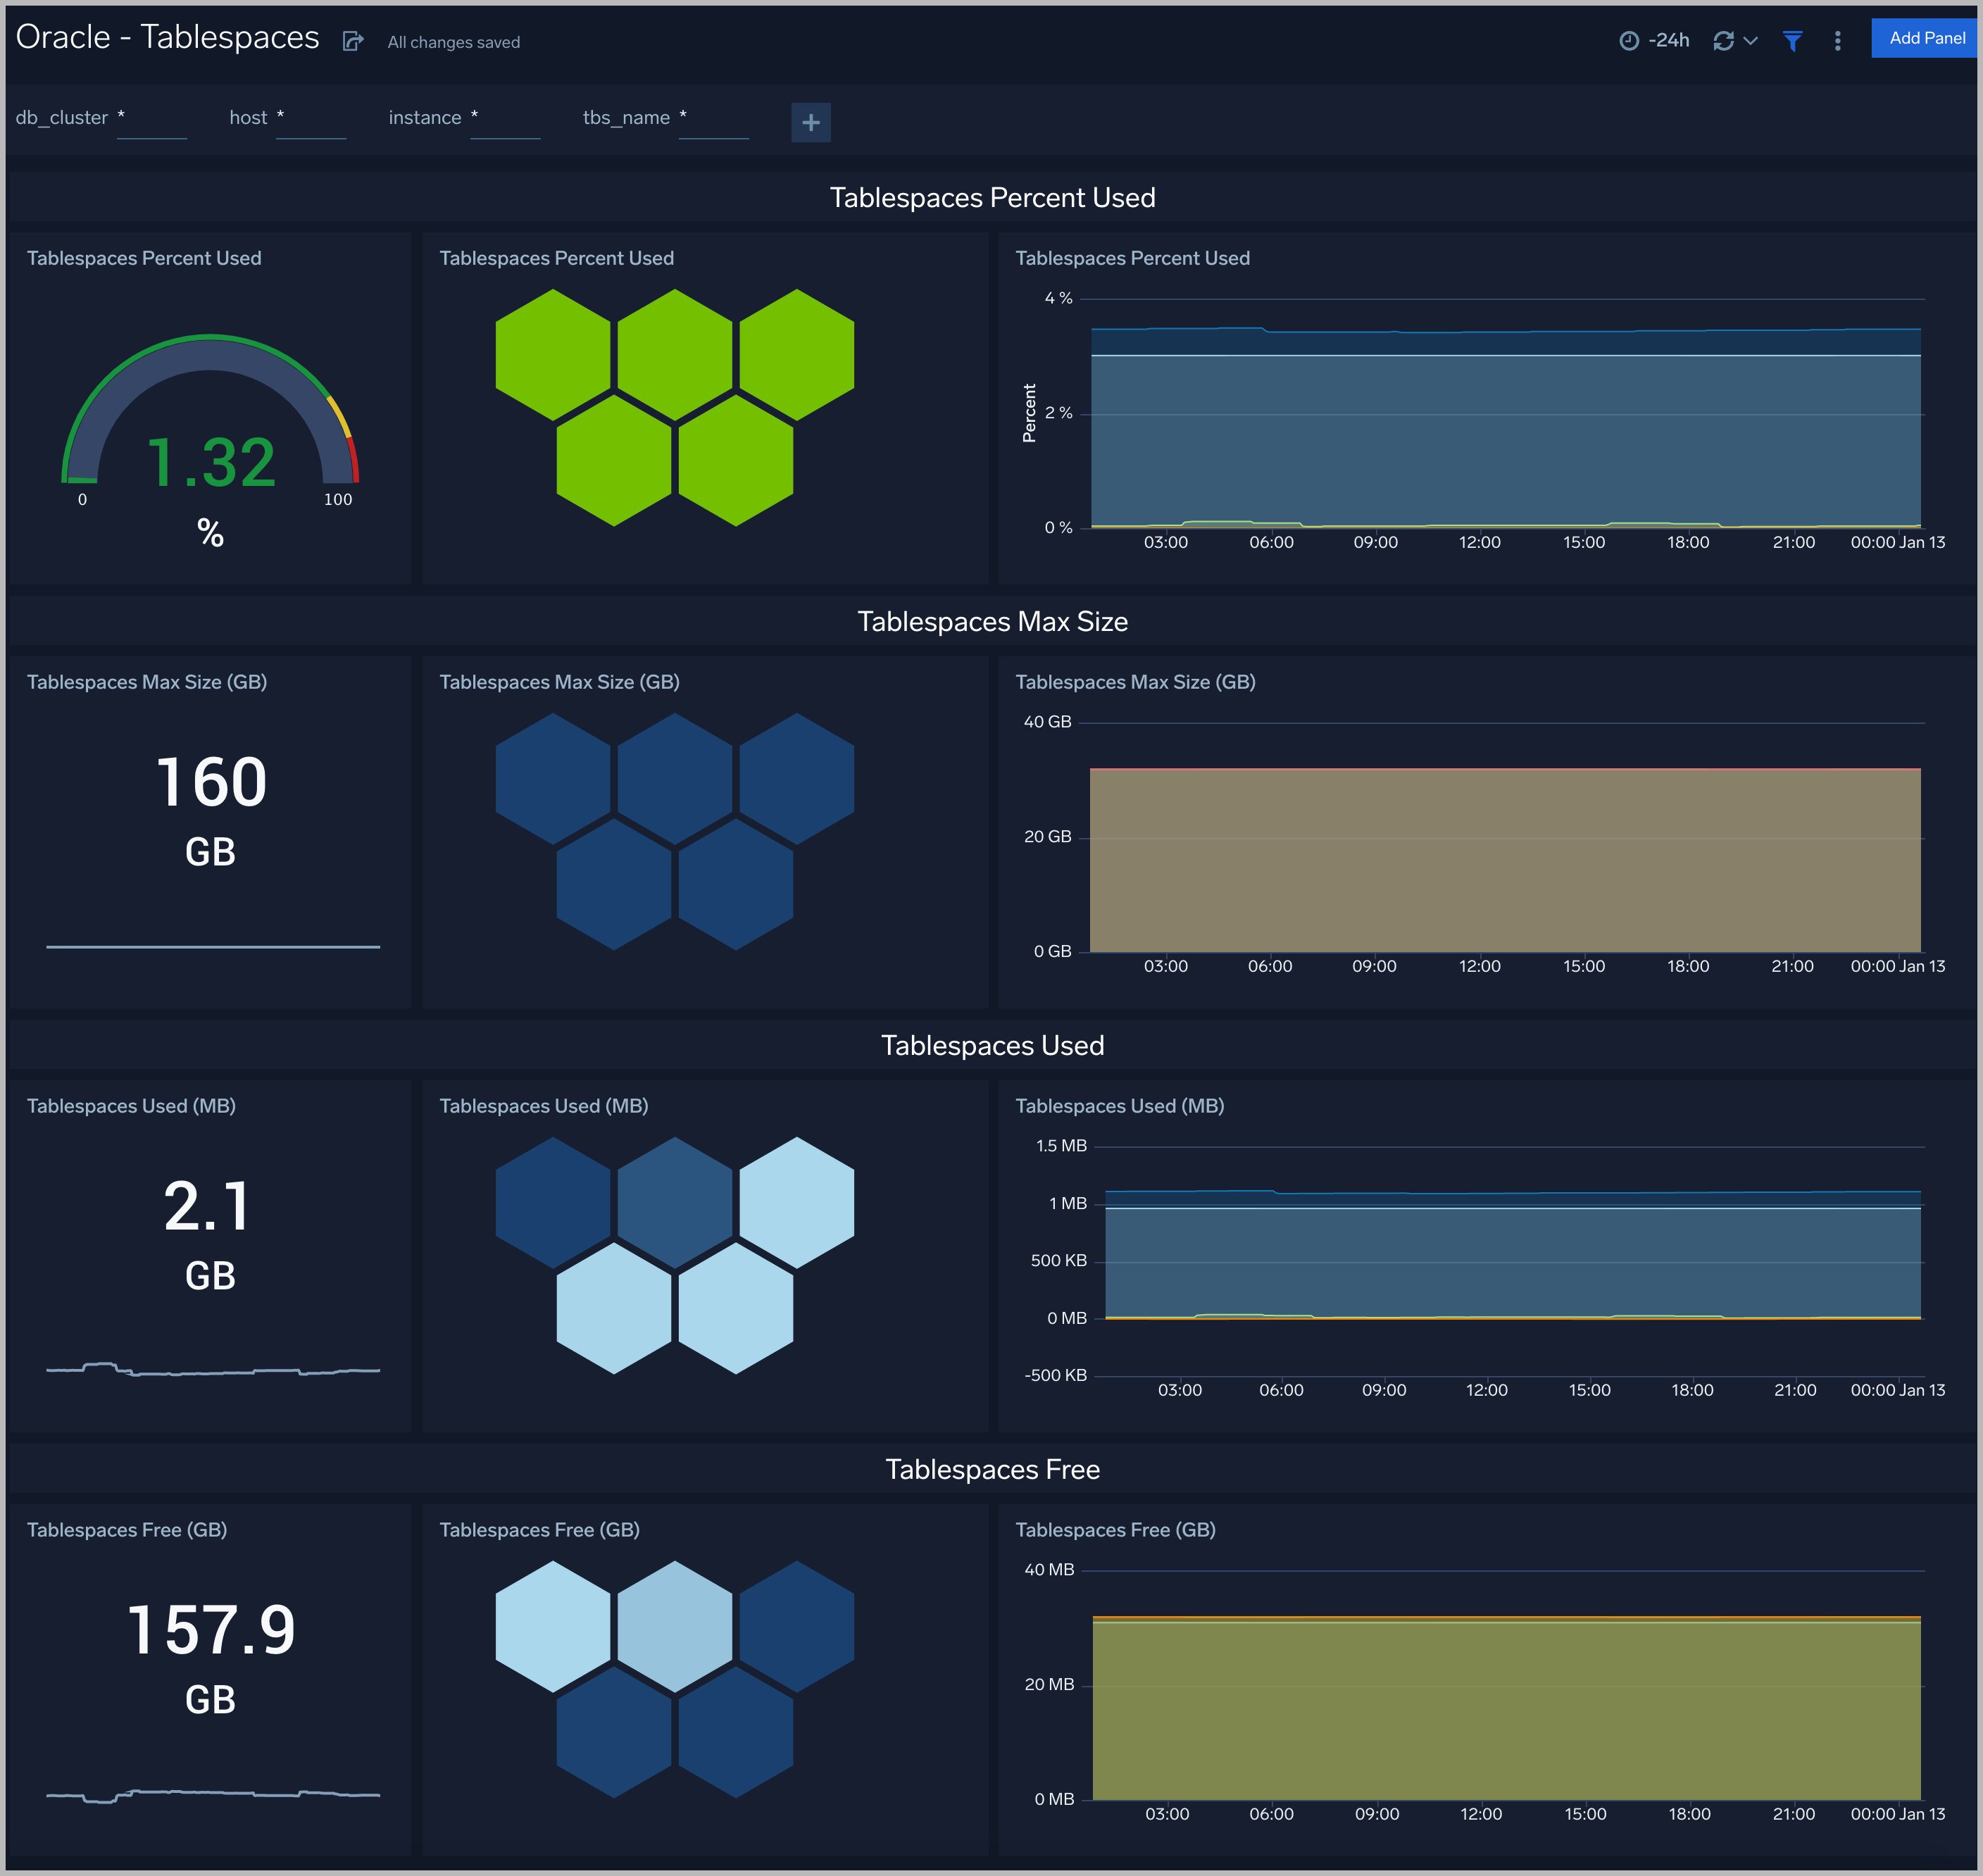
Tablespaces
The Oracle - Tablespaces dashboard provides an at-a-glance view of the tablespaces in clusters: Percent Used, Max size, Size Used, and Free.
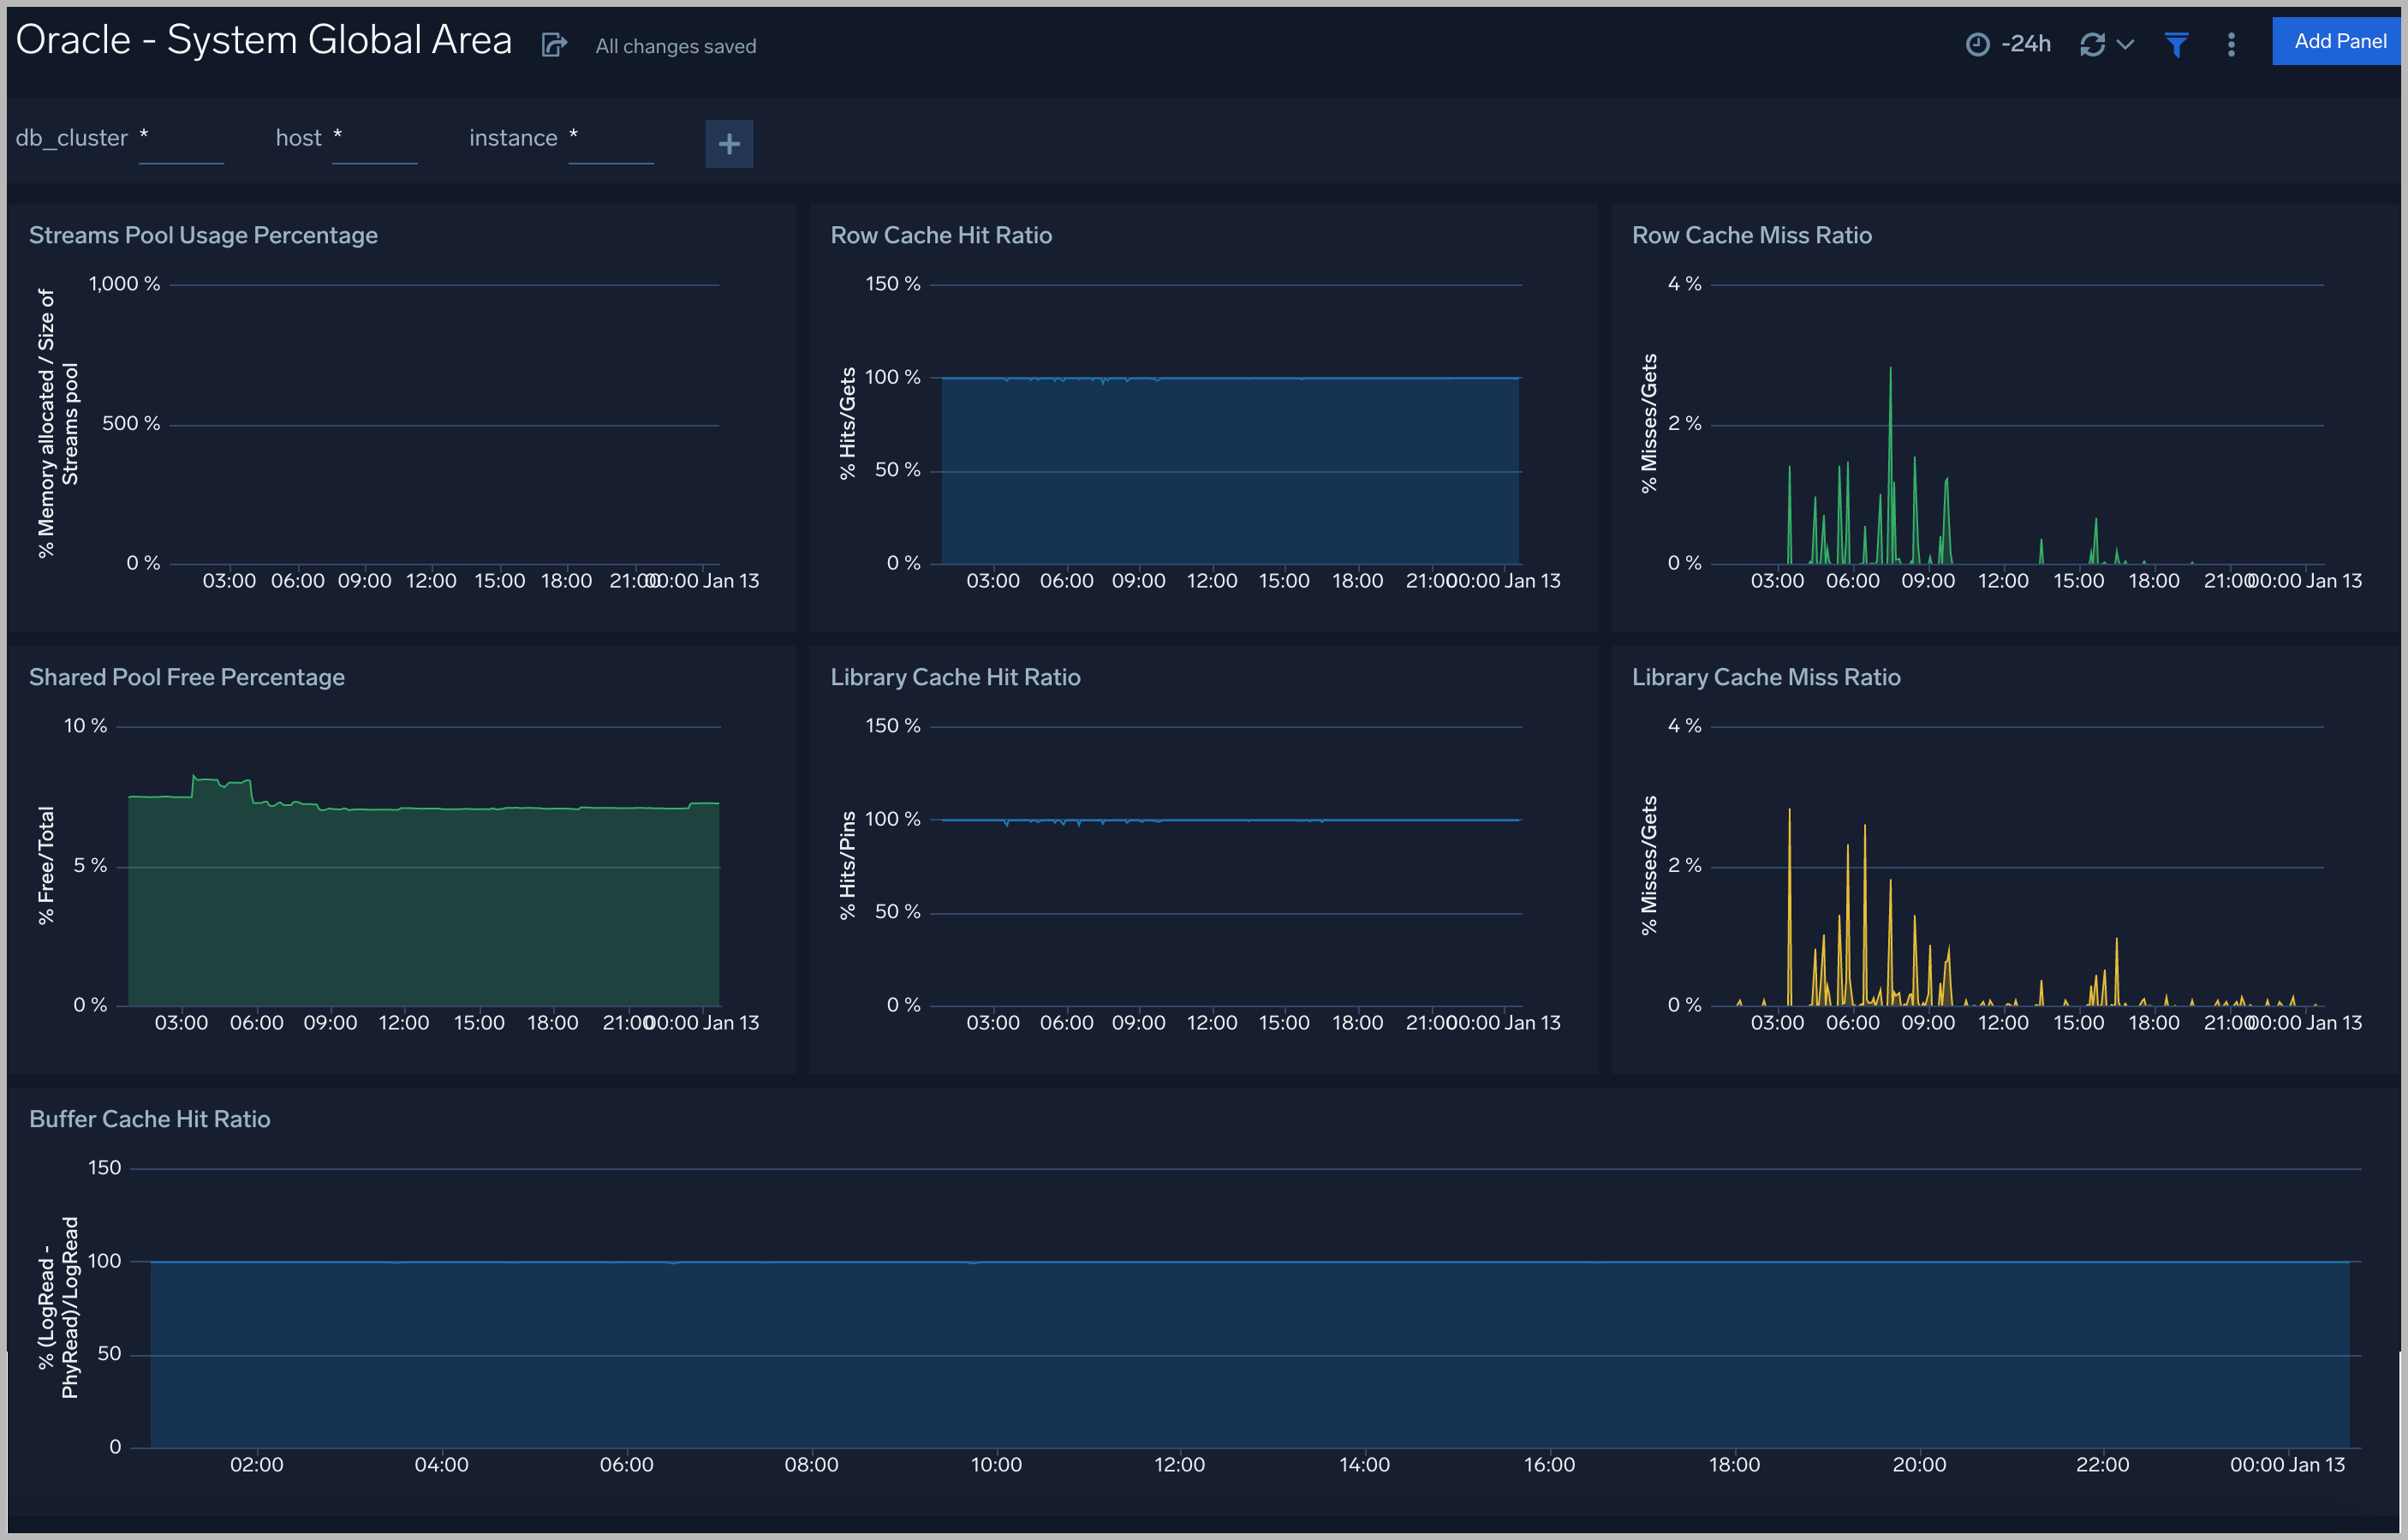
System Global Area
The Oracle - System Global Area dashboard provides an at-a-glance view of a group of shared memory structures, known as SGA components, that contain data and control information for one Oracle Database instance.
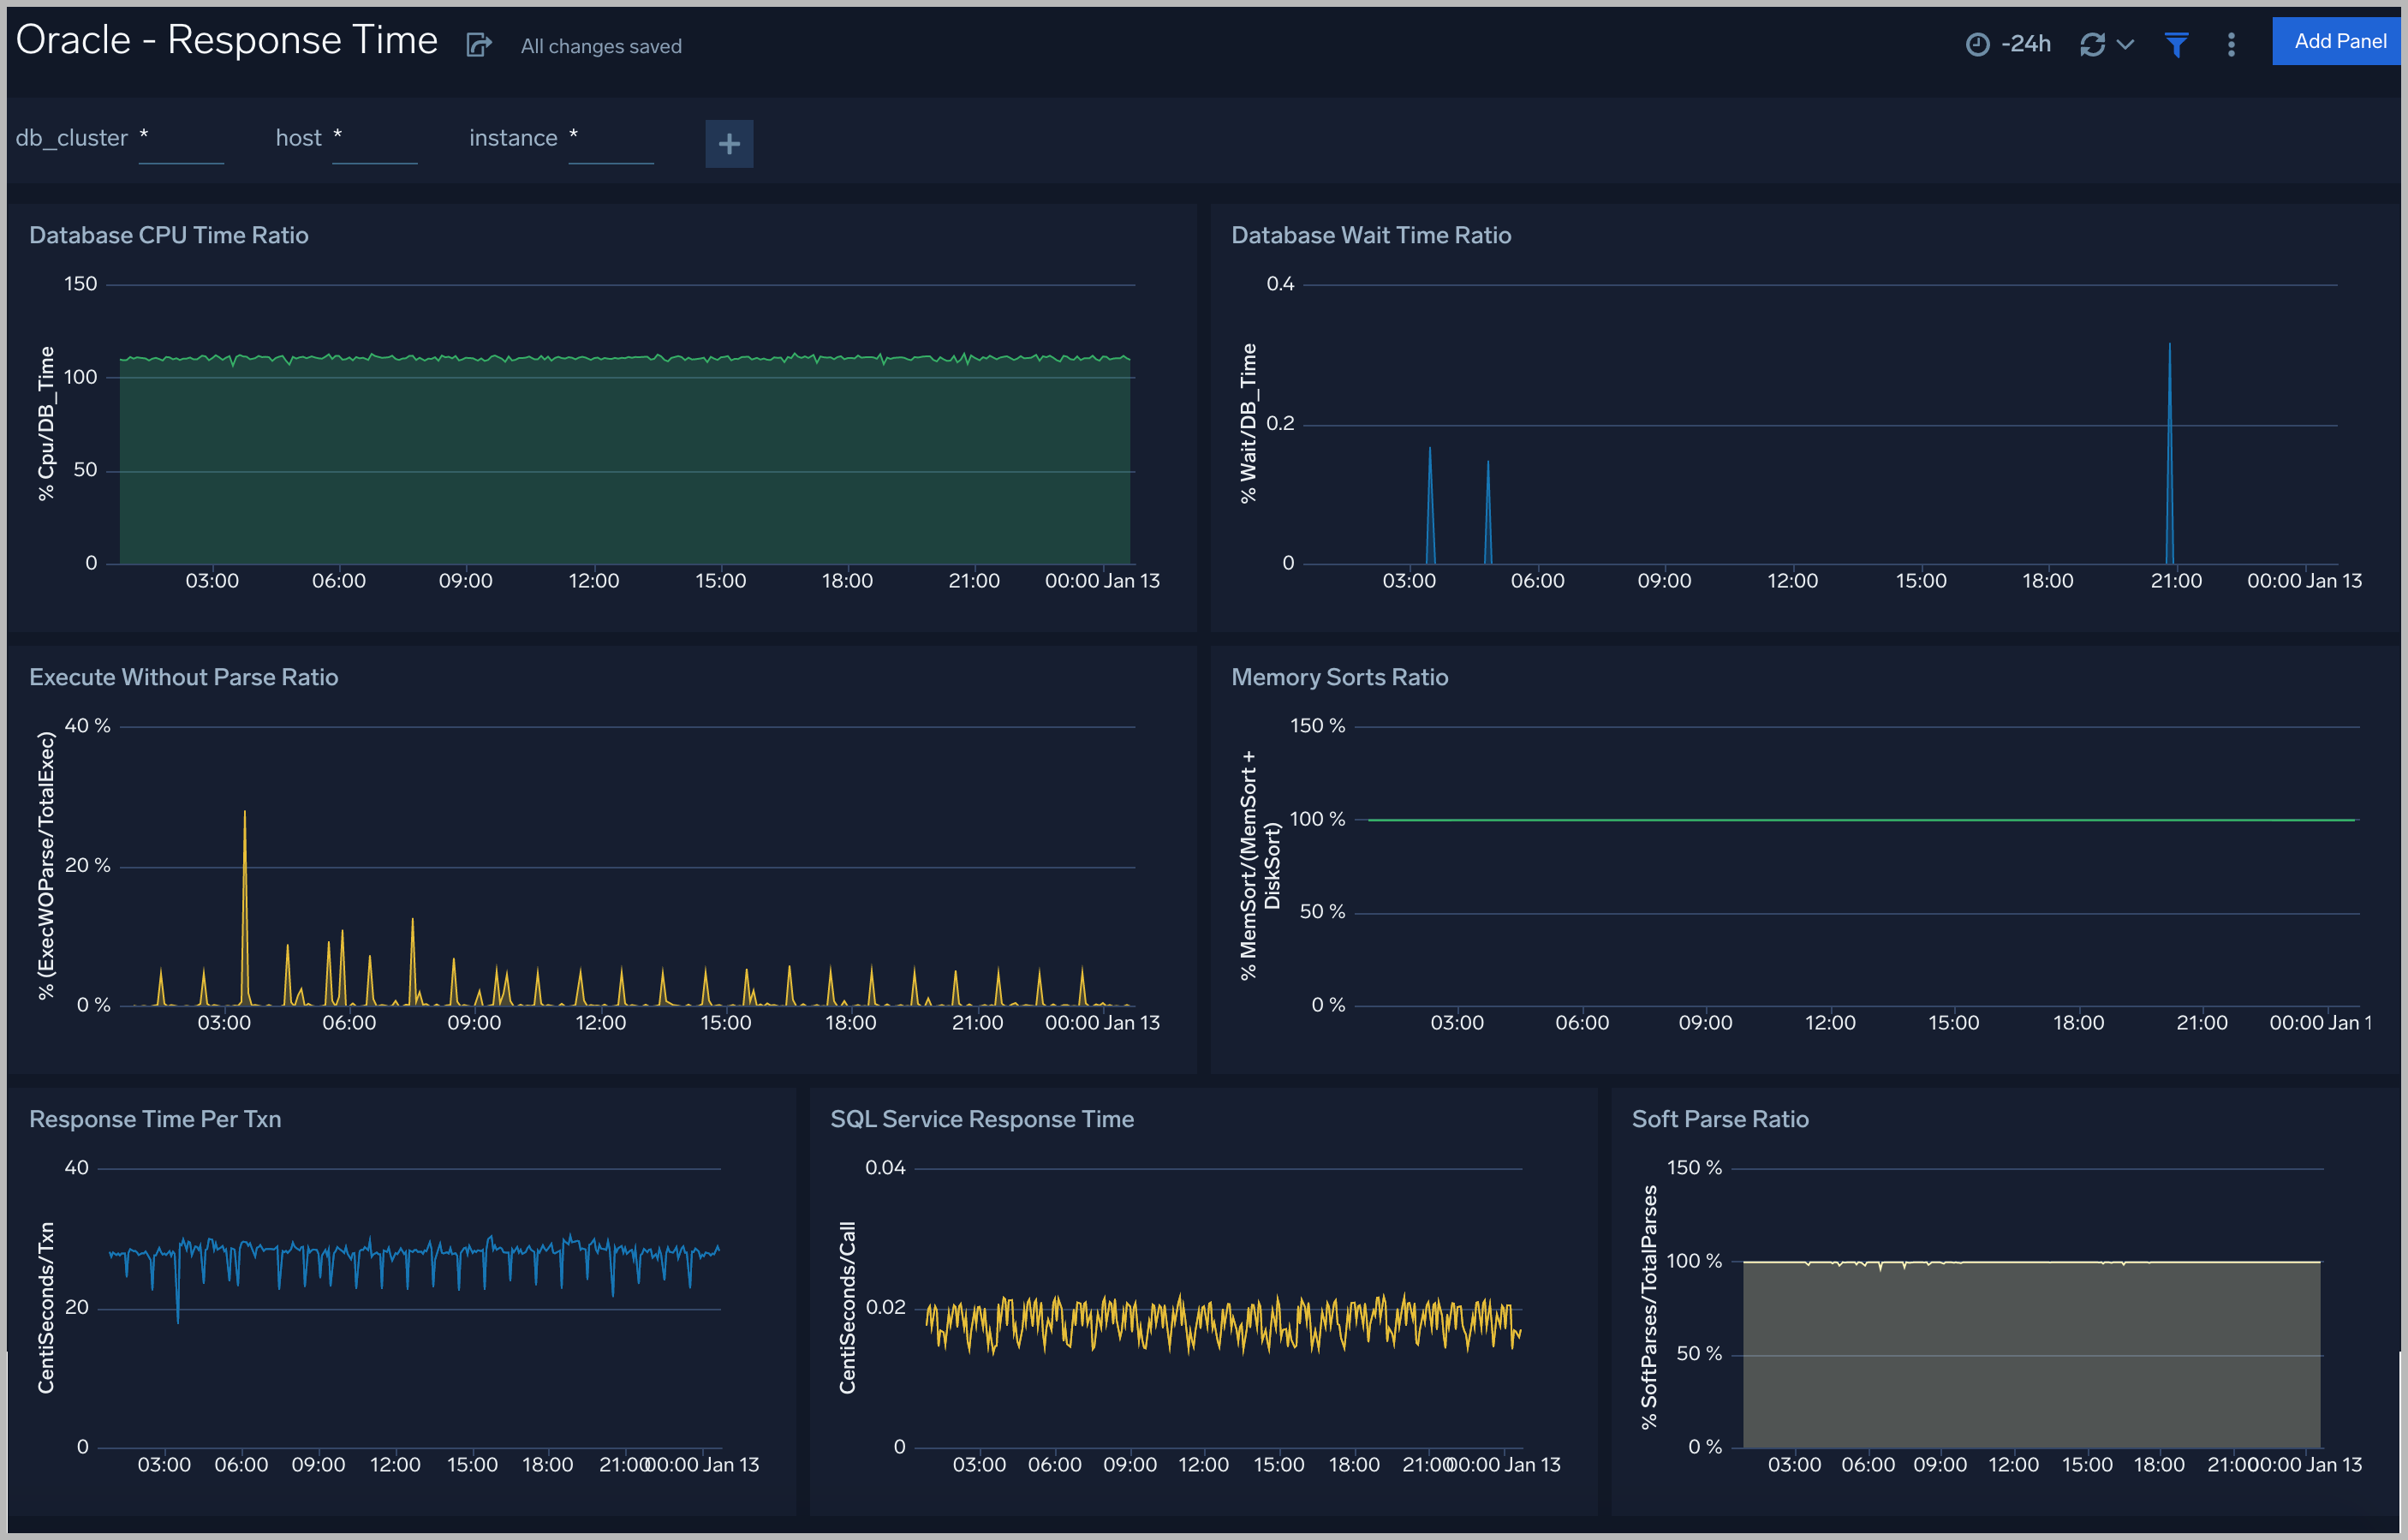
Response Time
The Oracle - Response dashboard performance statistics such as database CPU Time, Wait Time Ratio, Response time, Soft Parse Radio, and Execute
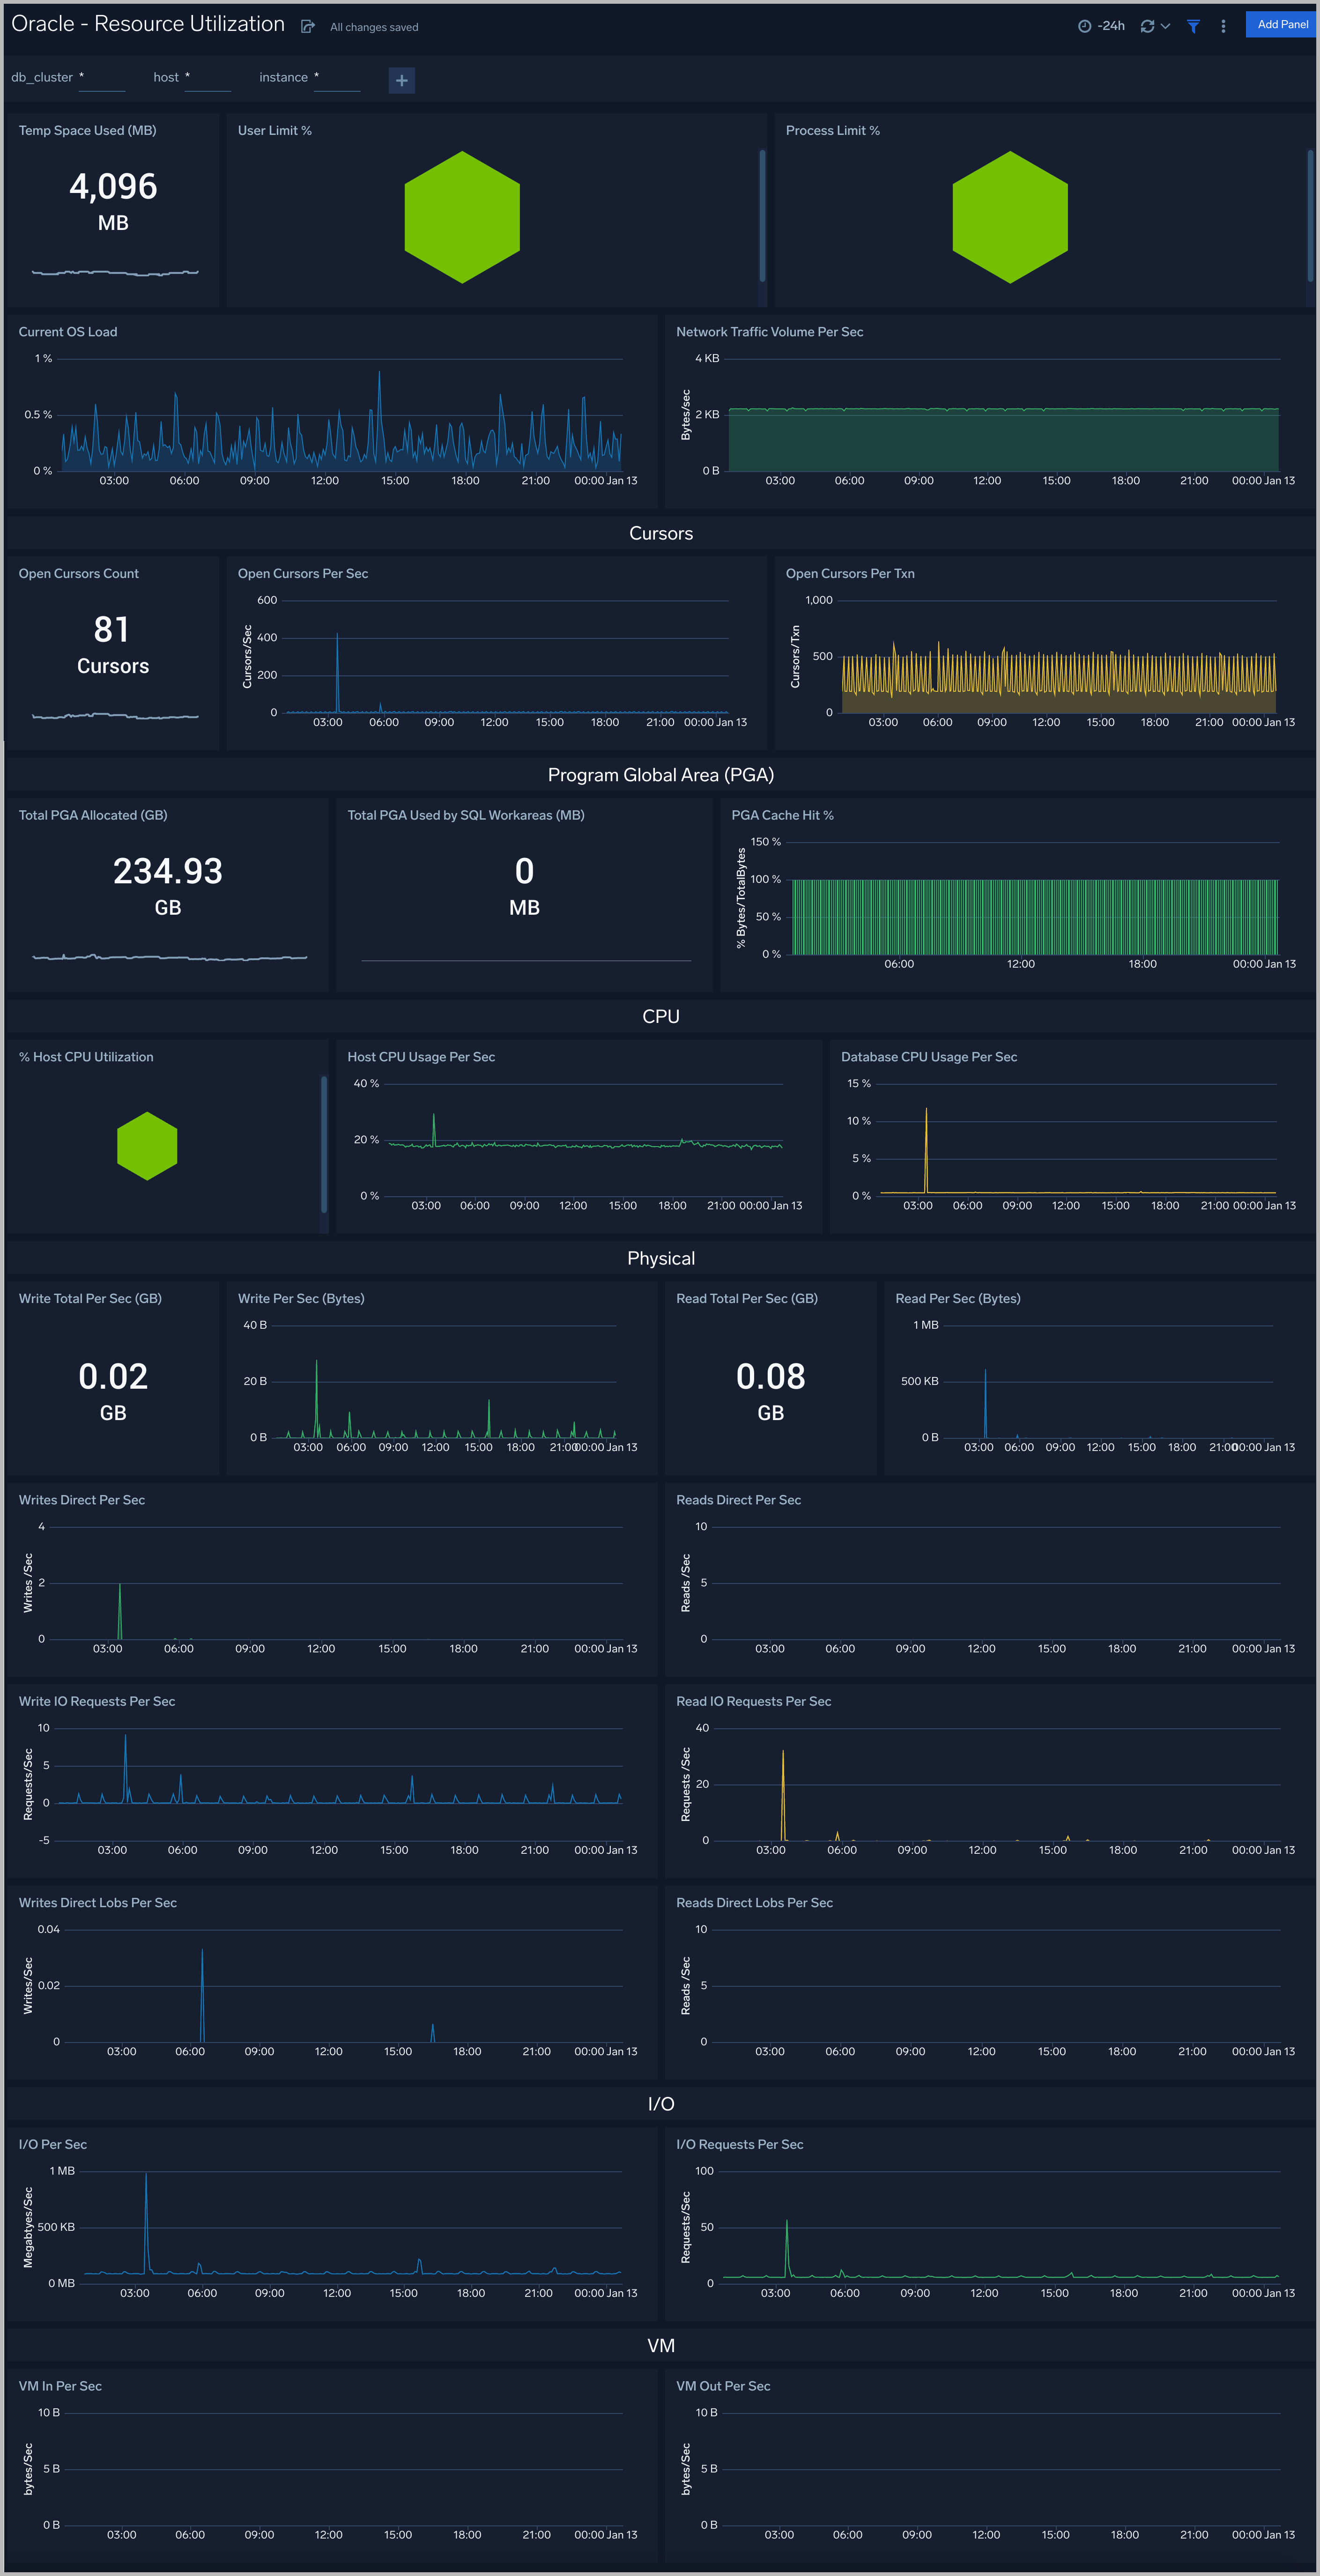
Resource Utilization
The Oracle - Resource Utilization dashboard performance statistics such as Limit, OS load, CPU, Cursors, PGA, Physical, I/O and VM
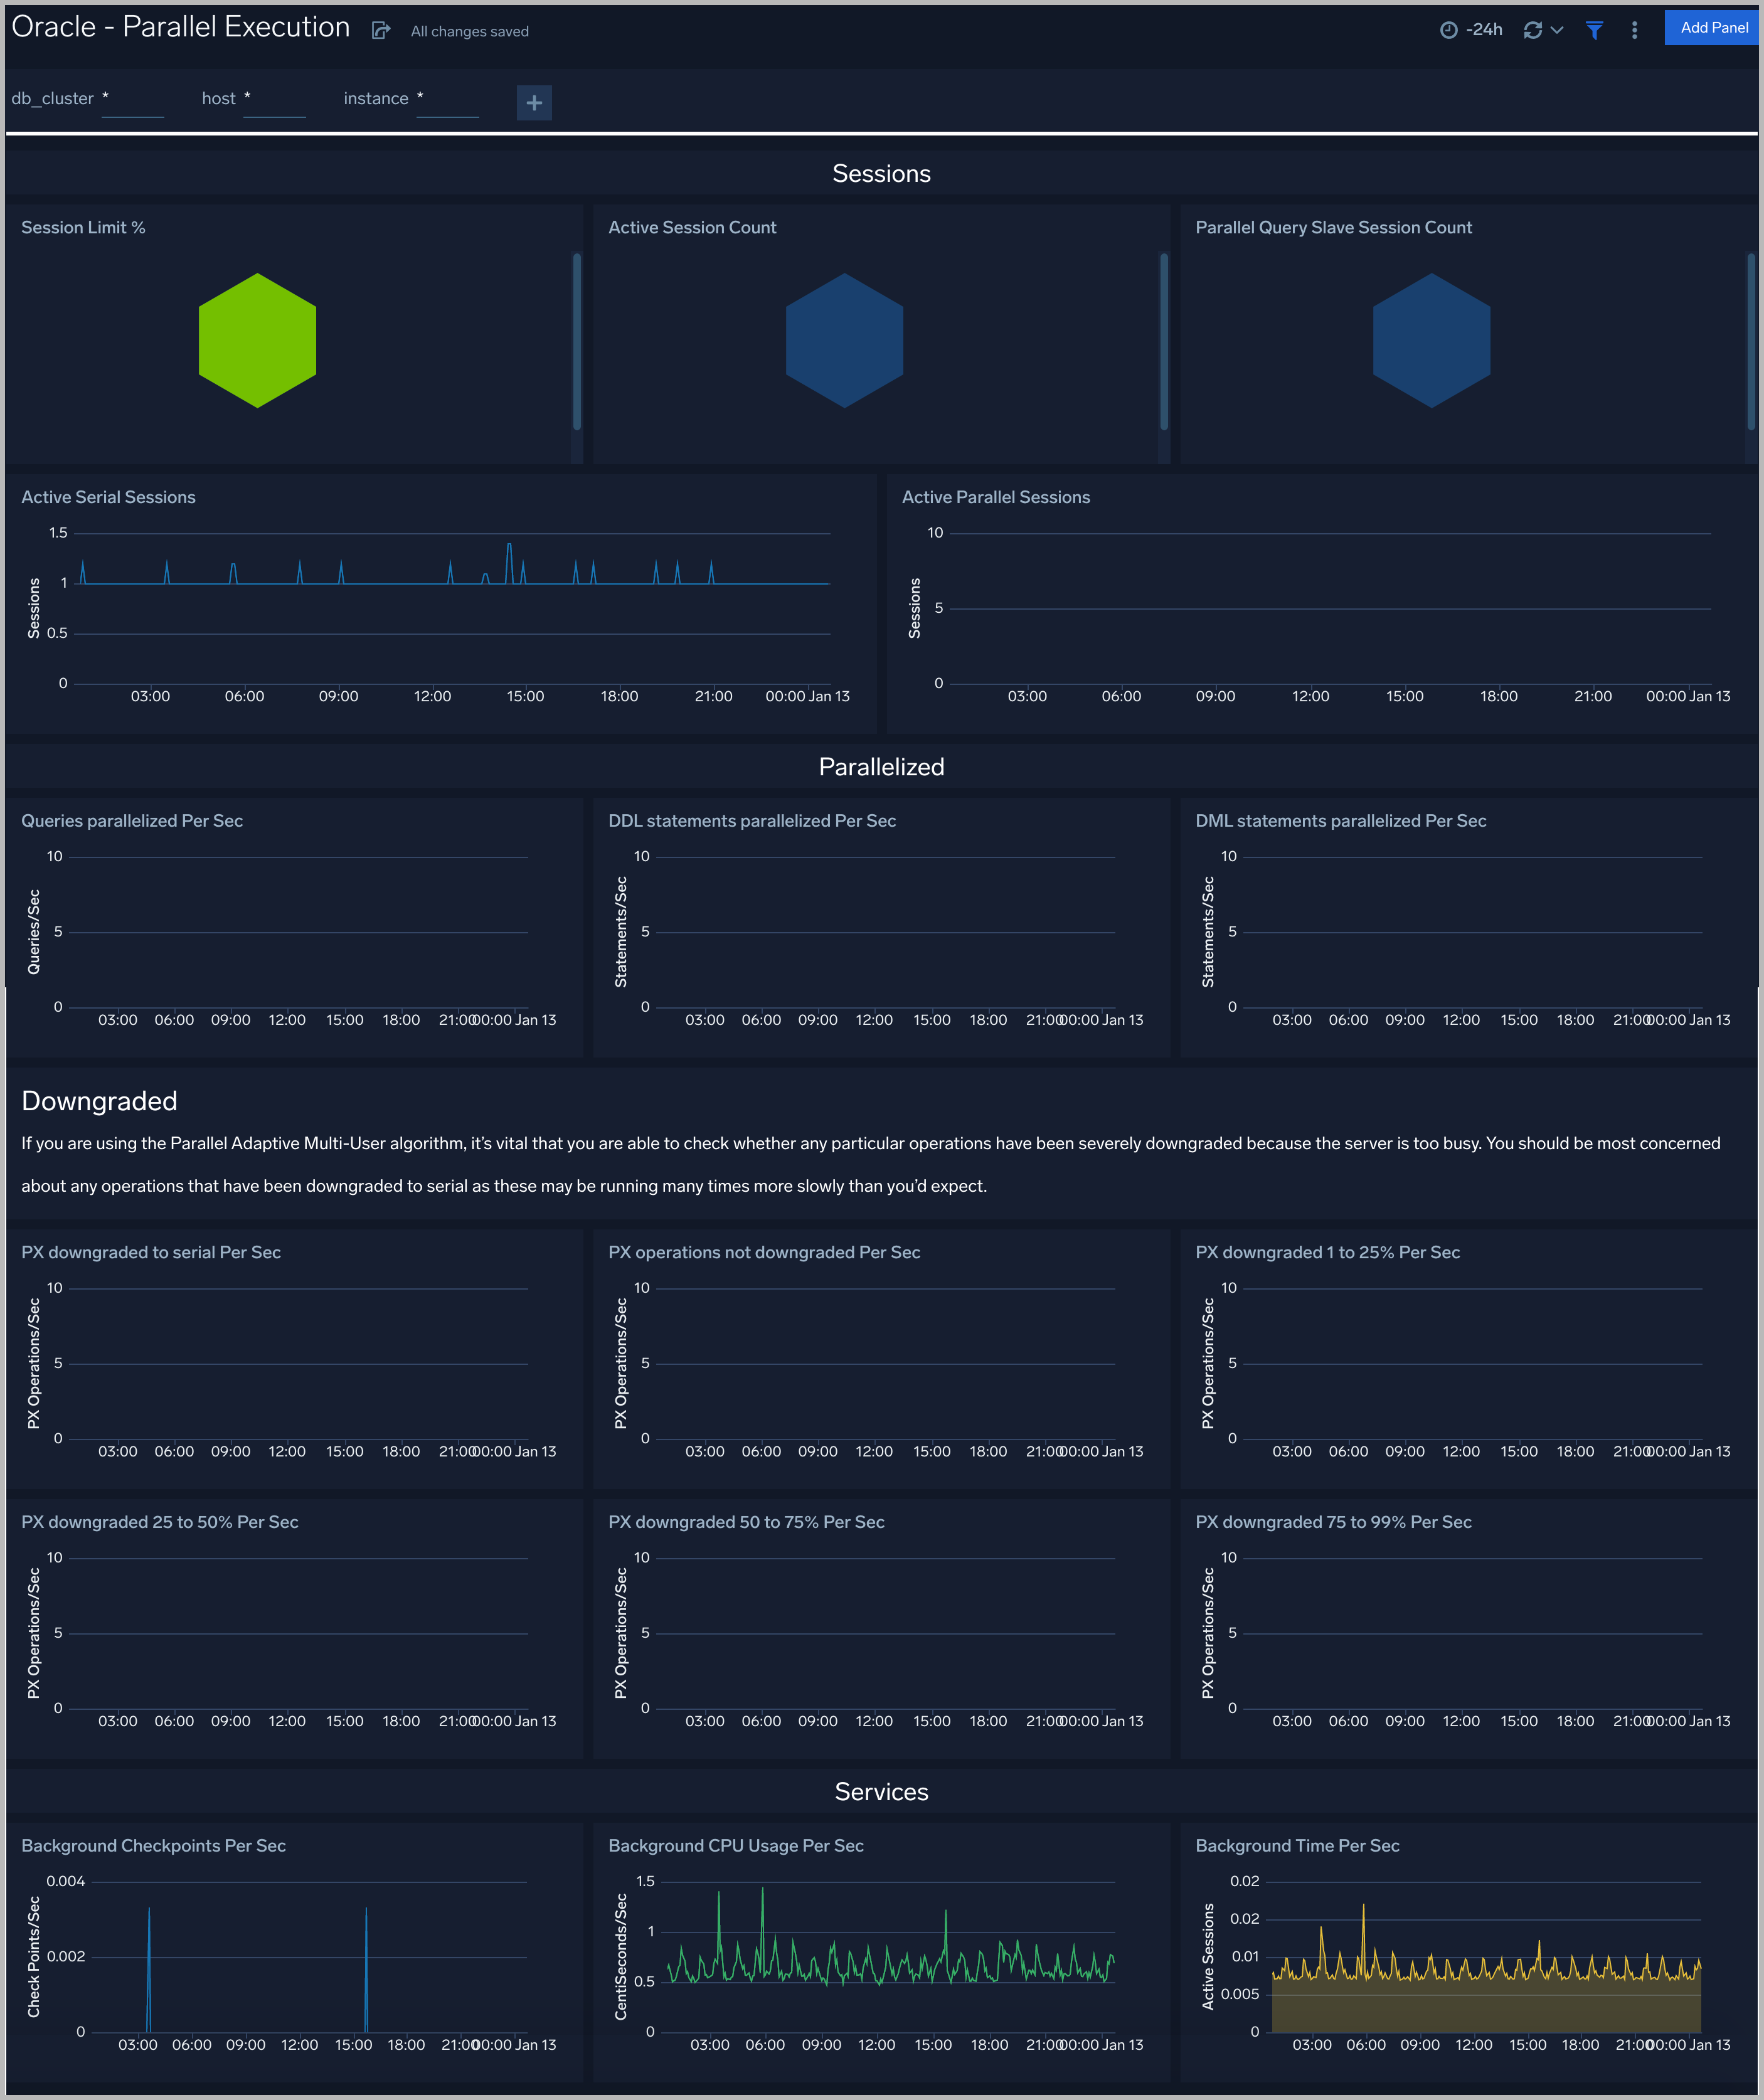
Parallel Execution
The Oracle - Parallel Execution dashboard performance statistics such as Sessions, DDL statements parallelized, PX downgraded, Background services