Sumo Logic App for Okta

Okta provides secure connections between people and your applications on any device through identity management service built for the cloud. The Sumo Logic App for Okta helps you monitor the admin actions, failed logins, successful logins, and user activities to your applications through Okta. The App consists of dashboards that give you visibility into the applications, accesses, user events, and Multi-Factor Authentication (MFA).
Log Types and Versions
The Sumo Logic Collector uses Okta System Log API to get the logs of Okta System. The log types include authentication, events, and actions. For more information on the Okta log API, see here.
Sample Log message
Click to expand
{
   "actor":{
      "id":"00u17b6c3rwVP7kqo1d8",
      "type":"User",
      "alternateId":"kyle.diedrich@company.com",
      "displayName":"Kyle Diedrich",
      "detailEntry":null
   },
   "client":{
      "userAgent":{
         "rawUserAgent":"PostmanRuntime/3.0.11-hotfix.2",
         "os":"Unknown",
         "browser":"UNKNOWN"
      },
      "zone":"null",
      "device":"Unknown",
      "id":null,
      "ipAddress":"12.97.85.90",
      "geographicalContext":{
         "city":"San Francisco",
         "state":null,
         "country":"United States",
         "postalCode":"94107",
         "geolocation":{
            "lat":37.7697,
            "lon":-122.3933
         }
      }
   },
   "authenticationContext":{
      "authenticationProvider":null,
      "credentialProvider":null,
      "credentialType":null,
      "issuer":null,
      "interface":null,
      "authenticationStep":0,
      "externalSessionId":"trsp5PU7OIoTgCOdFBgJOQWIA"
   },
   "displayMessage":"Delete application",
   "eventType":"application.lifecycle.delete",
   "outcome":{
      "result":"SUCCESS",
      "reason":null
   },
   "published":"2017-10-02T17:38:45+0000",
   "securityContext":{
      "asNumber":null,
      "asOrg":null,
      "isp":null,
      "domain":null,
      "isProxy":null
   },
   "severity":"INFO",
   "debugContext":{
      "debugData":{
         "requestUri":"/api/v1/apps/0oa1alyz0mr8M2MoG1d8"
      }
   },
   "legacyEventType":"app.generic.config.app_deleted",
   "transaction":{
      "type":"WEB",
      "id":"WRzO-wWGVlYAavrUTHqwcgAABsA",
      "detail":{ }
   },
   "uuid":"49916412-d679-4285-b3e0-d740c73e4999",
   "version":"0",
   "request":{
      "ipChain":[
         {
            "ip":"12.97.85.90",
            "geographicalContext":{
               "city":"San Francisco",
               "state":null,
               "country":"United States",
               "postalCode":"94107",
               "geolocation":{
                  "lat":37.7697,
                  "lon":-122.3933
               }
            },
            "version":"V4",
            "source":null
         },
         {
            "ip":"54.235.68.72",
            "geographicalContext":{
               "city":"Ashburn",
               "state":null,
               "country":"United States",
               "postalCode":"20149",
               "geolocation":{
                  "lat":39.0481,
                  "lon":-77.4728
               }
            },
            "version":"V4",
            "source":null
         }
      ]
   },
   "target":[
      {
         "id":"0oa1alyz0mr8M2MoG1d8",
         "type":"AppInstance",
         "alternateId":"Cisco AnyConnect VPN (2)",
         "displayName":"Cisco AnyConnect VPN",
         "detailEntry":null
      }
   ]
}
Sample Queries
_sourceCategory = "okta" "application.lifecycle.delete"
| json field=_raw "eventType" as event_type
| where event_type = "application.lifecycle.delete"
| json field=_raw "outcome.result" as outcome_result
| json field=_raw "displayMessage" as display_message
| json field=_raw "published"as published_time
| json field=_raw "actor.displayName" as okta_user_name
| json field=_raw "actor.alternateId" as okta_user_id
| json field=_raw "actor.type"
| json field=_raw "severity" as severity
| json field=_raw "target[0].displayName" as app_name
| json field=_raw "target[0].type" as app_type
| json field=_raw "client.ipAddress" as client_ip
| json field=_raw "client.geographicalContext.city" as city
| json field=_raw "client.geographicalContext.state" as state
| json field=_raw "client.geographicalContext.country" as country
| json field=_raw "client.geographicalContext.postalCode" as postal_code
| count by app_name, okta_user_id, outcome_result, display_message
_sourceCategory = "okta" "user.mfa.factor.deactivate"
| json field=_raw "eventType" as event_type
| where event_type = "user.mfa.factor.deactivate"
| json field=_raw "outcome.result" as outcome_result
| json field=_raw "published" as published_time
| json field=_raw "actor.displayName" as actor
| json field=_raw "actor.alternateId" as actor_id
| json field=_raw "actor.type"
| json field=_raw "severity" as severity
| json field=_raw "client.userAgent.os" as OS
| json field=_raw "client.userAgent.browser" as browser
| json field=_raw "client.device" as device
| json field=_raw "client.ipAddress" as client_ip
| json field=_raw "client.geographicalContext.country" as country
| json field=_raw "client.geographicalContext.state" as state
| json field=_raw "client.geographicalContext.city" as city
| json field=_raw "target[0].displayName" as okta_user_name
| json field=_raw "target[0].alternateId" as okta_user_id
| count by okta_user_id, actor, outcome_result, country, state
Configuring Okta Log Collection for Non-FedRamp Deployments
Use the new Cloud to Cloud Integration for Okta to create the source and use the same source category while installing the app.
The sections below are available for FedRamp Sumo Logic deployments to meet FedRamp's specific compliance requirements. If you're using the Sumo Logic FedRamp deployment, you must use the sections below to configure collection for this app.
Configuring Okta Log Collection for FedRamp Deployments
This section walks you through the process of setting up log collection from Okta for analysis in Sumo Logic. The steps must be performed in the order in which they are presented.
Prerequisites
Before you begin setting up log collection, review the required prerequisites and process overview described in the following sections.
- The integration between Sumo and Okta relies upon SumoJanus, a proprietary library used for script-based collection from applications such as Okta, Box, and Salesforce.
- The system where you deploy SumoJanus and configure your installed collector and script source must have Java.
To ensure that SumoJanus can find your Java installation, set your JAVA_HOME environment or absolute PATH variable.
Step 1: Generate Okta API Authentication Token
Create an Okta API token, following instructions in Okta help. You will add the token to the SumoJanus properties file, later in this procedure.
Step 2: Download SumoJanus package
The following SumoJanus file is required for authentication and to collect logs from Okta. Download the appropriate file for your system.
| Linux | Windows | |
| SumoJanus v3.0.1 package file | sumojanus-okta-dist.1.0.2.tar.gz | sumojanus-okta-dist.1.0.2.zip |
Step 3: Deploy SumoJanus package on a Local Server Running the Sumo Logic Collector
If you have not previously set up SumoJanus, follow the steps in New SumoJanus installation. If you have previously set up SumoJanus, follow the instructions in SumoJanus installation update.
New SumoJanus installation
Copy the package file you downloaded in Step 2 to the appropriate sumojanus folder, then unzip them there.
- On Linux, run the following command:
tar xzvf sumojanus-okta-dist.1.0.2.tar.gz
- On Windows, you can use Windows Explorer to open the zip package and copy it to the appropriate target folder.
sumojanus-okta-dist.1.0.2.zip
Update your SumoJanus installation
- Backup conf/sumologic.properties and the data folder.
- Setup a New SumoJanus installation
- Migrate the backed up conf/sumologic.properties and data folder to the new Janus folder
- Modify the paths in Step 6 below to point to the new folder.
Step 4: Edit the Properties File
In this step, you'll edit the local properties file with the Okta token created in step 1. The Properties file was generated in step 2 when you downloaded and deployed the SumoJanus package.
- Open the file
<sumojanus_foldername>/conf/sumologic.propertiesin a text editor and add the following lines to the end of the file. You will replace the<variables>with information (including the brackets) you enter in the following steps.
# provide the parameters for a bundle via a unique section after this
[oktacollector]
# required, your Okta API token
api_token = <generated_Okta_api_token>
# required, your okta account URL, e.g: https://acme.okta.com
okta_org_url = https://<company.okta.com>
# required, file to keep track of the okta event stream
stream_pos_path = <${path}/data/okta_checkpoint.dat>
#  maximum pagination limit is 1000
pagination_limit = 1000
# optional, start time window to query, in epoch milliseconds. Default is 7 days ago.
start_time = 1435709058000
# optional, end time window to query, in epoch milliseconds. Default is 1 minute ago
end_time = 1436377600000
- api_token. Enter the Okta API token that you created in the Generate the Okta API token step.
- okta_org_url. Enter your Okta URL. Note that the URL starts with https, and not http.
- stream_pos_path. Replace the
${path}variable with the actual path on the server where SumoJanus is installed. For example: "/home/sumojanus" - Save your changes. Your
sumojanus/conf/sumologic.propertiesfile should look similar to this example:
Step 5: Configure an Installed Collector
To avoid errors, use the latest bundled JRE version listed in the Collector Release Notes. Since the JRE folder can change with collector upgrades, we strongly recommend copying this JRE folder to a separate place and pointing the JAVAPATH to that folder. To check the current JRE folder the collector is using, go to the collector folder under config/wrapper.conf, and look for the variable wrapper.java.command.
Configure an Installed Collector on a Linux or Windows machine. By default the Collector will come with a Java Runtime Environment. To ensure that SumoJanus can locate Java, you may need to update the .bat or .bash file, as described below.
- On Windows, update
SumoJanus_Okta.bat
Navigate to the folder where you installed SumoJanus, and open SumoJanus_Okta.bat in a text editor. Line 3 of the script sets JAVAPATH to C:\Program Files\Sumo Logic Collector\jre\bin as shown below:
set JAVAPATH="C:\Program Files\Sumo Logic Collector\jre\bin"
If your collector JRE is in a different location, update Line 3 accordingly.
On Linux, update SumoJanus_Okta.bash
Navigate to the folder where you installed SumoJanus, and open SumoJanus_Okta.bash in a text editor. Update the script as follows:
- Add a line that sets
JAVA_HOMEto point to the location of your JRE, just before the last line of the script. For example, if your collector's JRE is in/opt/SumoCollector/jre/bin, insert this line:
JAVA_HOME=/opt/SumoCollector/jre/bin
- The last line of the script is:
java -jar ${SUMOJANUS_JAR_FILE} ${runMode} OktaCollector-1.0.2.jar -e 1800
Prefix the line with $JAVA_HOME/, like this:
$JAVA_HOME/java -jar ${SUMOJANUS_JAR_FILE} ${runMode} OktaCollector-1.0.2.jar -e 1800
Step 6: Configure a Script Source
In this step, you'll configure a Script Source in Sumo Logic to send the data from Okta to Sumo Logic.
For guidance creating your Source Category naming convention, see Best Practices: Good Source Category, Bad Source Category.
To configure a Script Source, do the following:
- Configure a Script Source. Collectors using version 19.245-4 and later do not allow Script Sources to run by default.
To allow Script Sources you need to set the Collector parameter enableScriptSource in user.properties to true and restart the Collector.
Linux
Windows
- Configure the Source fields:
- Name. OktaCollector.
- (Optional) Description.
- Source Category. okta
- Frequency. Every 5 Minutes
- Specify a timeout for your command. Activate the checkbox and select 60 Minutes
- Command. For Linux, use
/bin/bash.. For windows, use Windows Script. (Specify the correct path on your system). - Script. Use the absolute path to sumojanus that you created in the Deploy the Packages step, such as
/home/ubuntu/sumojanus/bin/SumoJanus_Okta.bash.(Do not select "Type the script to execute.") - Working Directory.
$path/sumojanus,where $path is the absolute path of SumoJanus that you created in the Deploy the Packages step.
- Click Save.
Installing the Okta App
Now that you have set up collection for Okta, install the Sumo Logic App for Okta to use the preconfigured searches and dashboards that provide insight into your data.
To install the app:
Locate and install the app you need from the App Catalog. If you want to see a preview of the dashboards included with the app before installing, click Preview Dashboards.
- From the App Catalog, search for and select the app.
- Select the version of the service you're using and click Add to Library.
Version selection is applicable only to a few apps currently. For more information, see the Install the Apps from the Library.
- To install the app, complete the following fields.
- App Name. You can retain the existing name, or enter a name of your choice for the app.
- Data Source. Select either of these options for the data source.
- Choose Source Category, and select a source category from the list.
- Choose Enter a Custom Data Filter, and enter a custom source category beginning with an underscore. Example: (
_sourceCategory=MyCategory).
- Advanced. Select the Location in Library (the default is the Personal folder in the library), or click New Folder to add a new folder.
- Click Add to Library.
Once an app is installed, it will appear in your Personal folder, or other folder that you specified. From here, you can share it with your organization.
Panels will start to fill automatically. It's important to note that each panel slowly fills with data matching the time range query and received since the panel was created. Results won't immediately be available, but with a bit of time, you'll see full graphs and maps.
Viewing Okta Dashboards
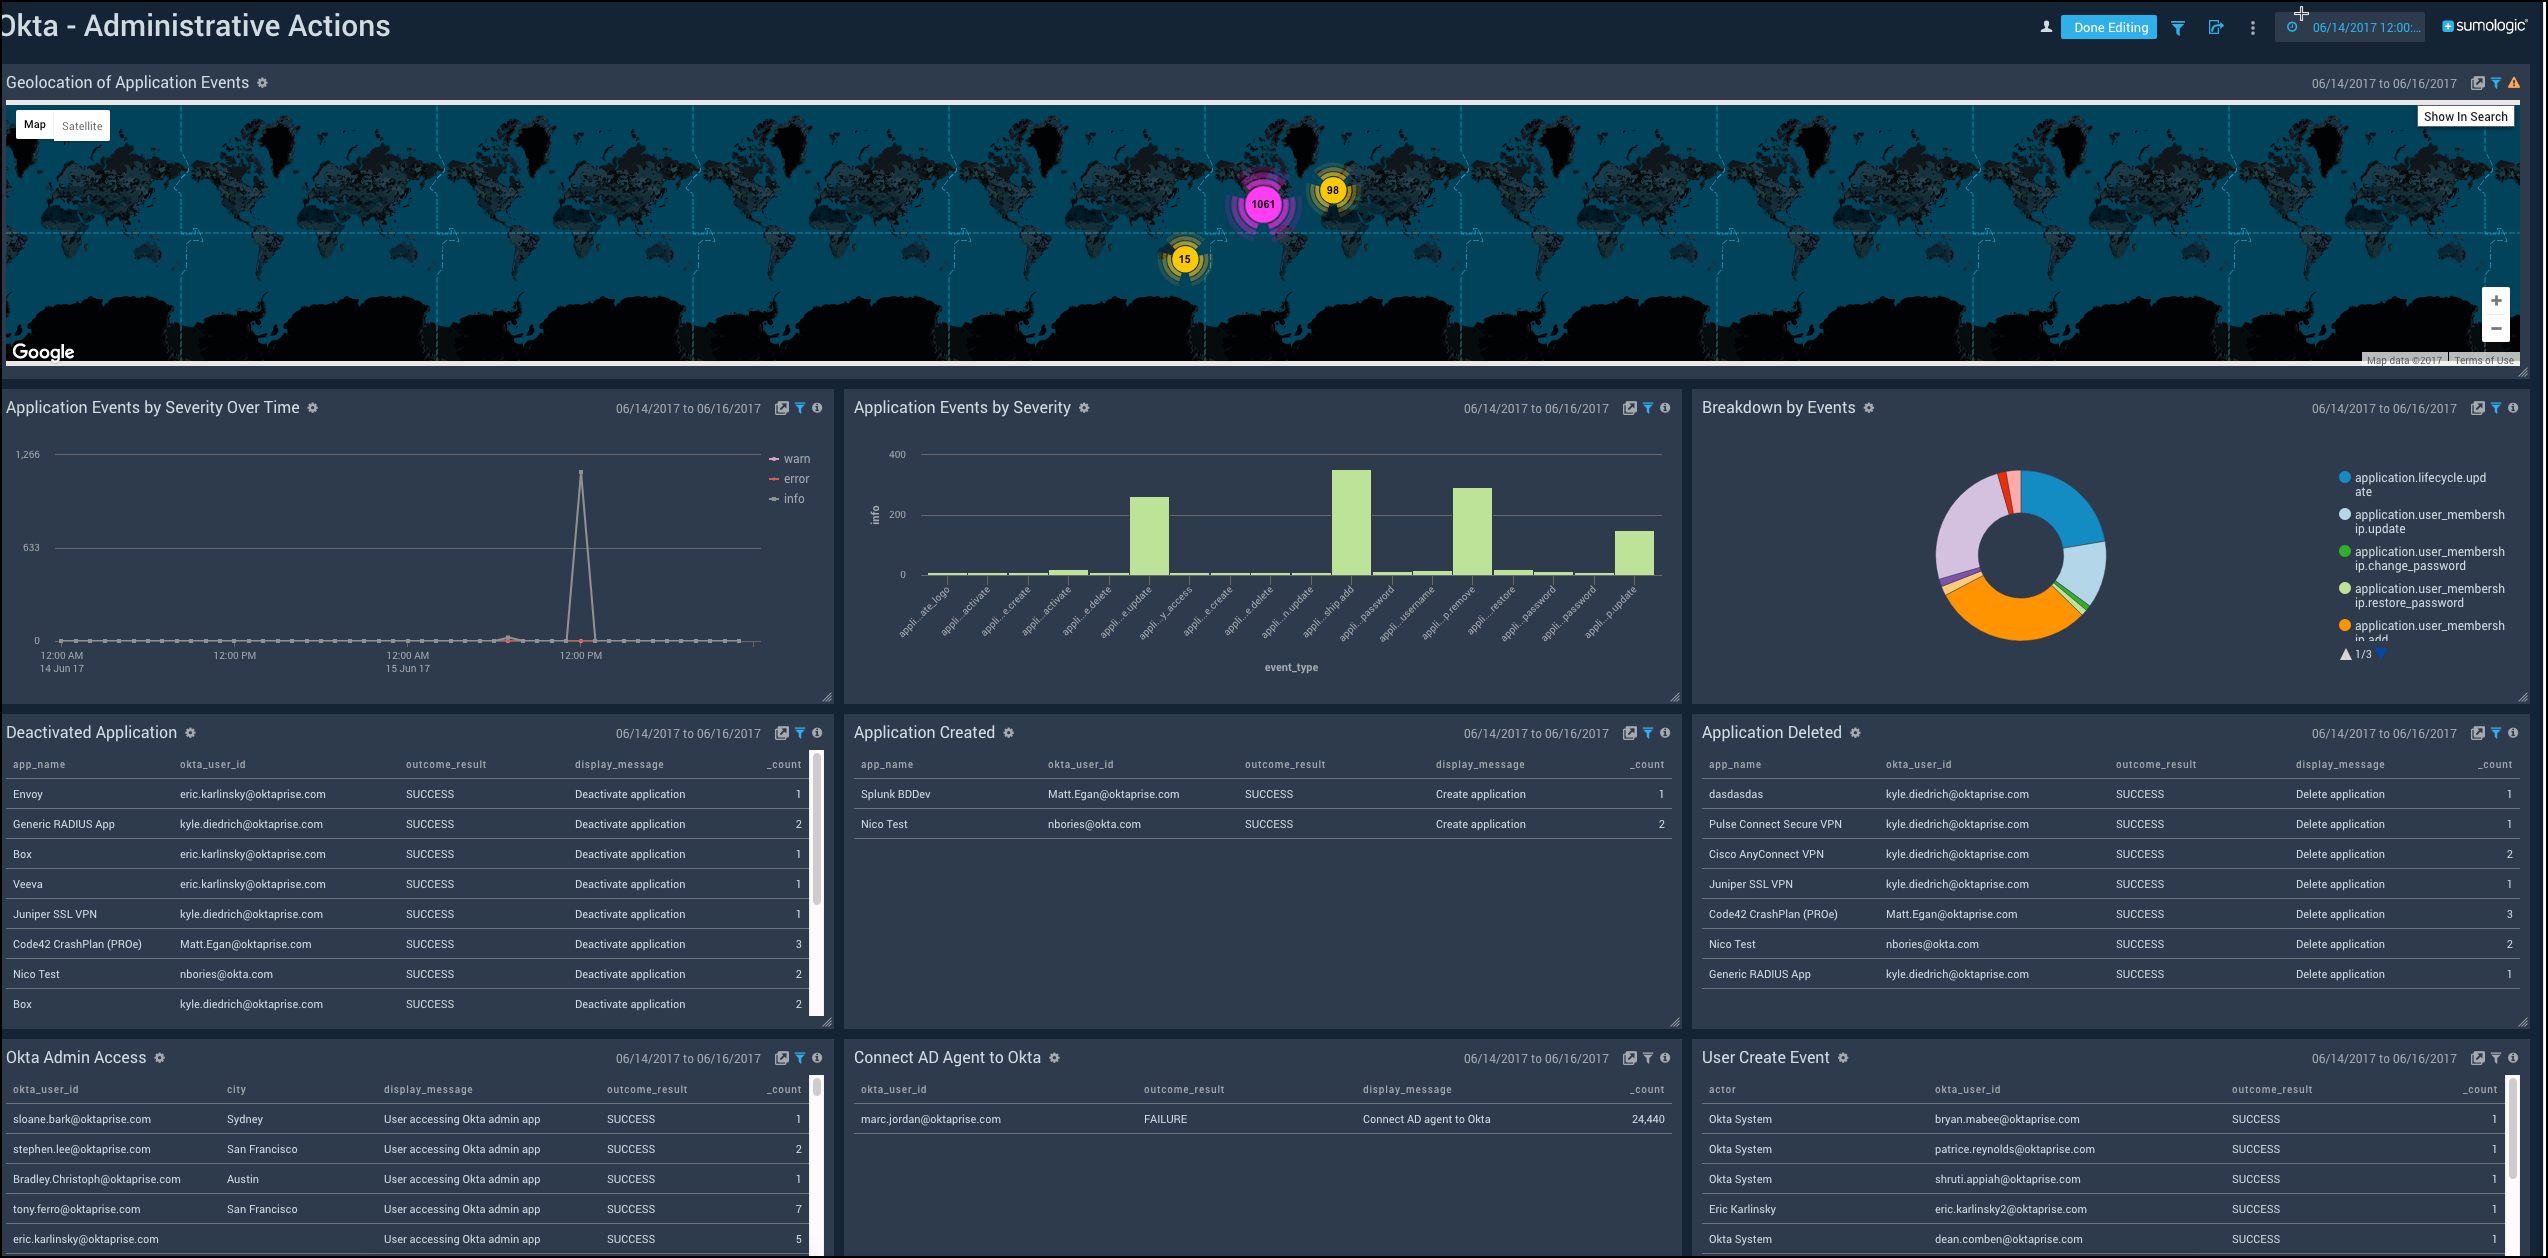
Administrative Actions
Shows the details of administrative actions such as the geolocation of application events, severity of events over time, application events, deactivated applications, application creation and deletion, admin accesses, and AD agent connection to Okta.
Geolocation of Application Events. See the number of application events across the world on a map in the last 24 hours.
Application Events by Severity Over Time. See the count of application events by severity in the last 24 hours on a line chart.
Application Events by Severity. See the count of application events by severity in the last 24 hours on a column chart.
Breakdown by Events. See the breakdown of administrative actions by events in the last 24 hours on a pie chart.
Deactivated Application. See the app name, user ID, outcome of access attempt, display message, and count of the deactivated applications in the last 24 hours displayed in a table.
Application Created. See the count of applications created in the last 24 hours along with the application name, user ID, message displayed, and the outcome result shown in a table.
Application Deleted. See the count of applications deleted in the last 24 hours along with the application name, user ID, message displayed, and the outcome result shown in a table.
Okta Admin Access. See the user ID, city, display message, outcome result, and count of the Okta Admin Access in the last 24 hours displayed in a table.
Connect AD Agent to Okta. See the details of connect AD agent to Okta such as the Okta user ID, outcome result, display message, and count, in the last 24 hours.
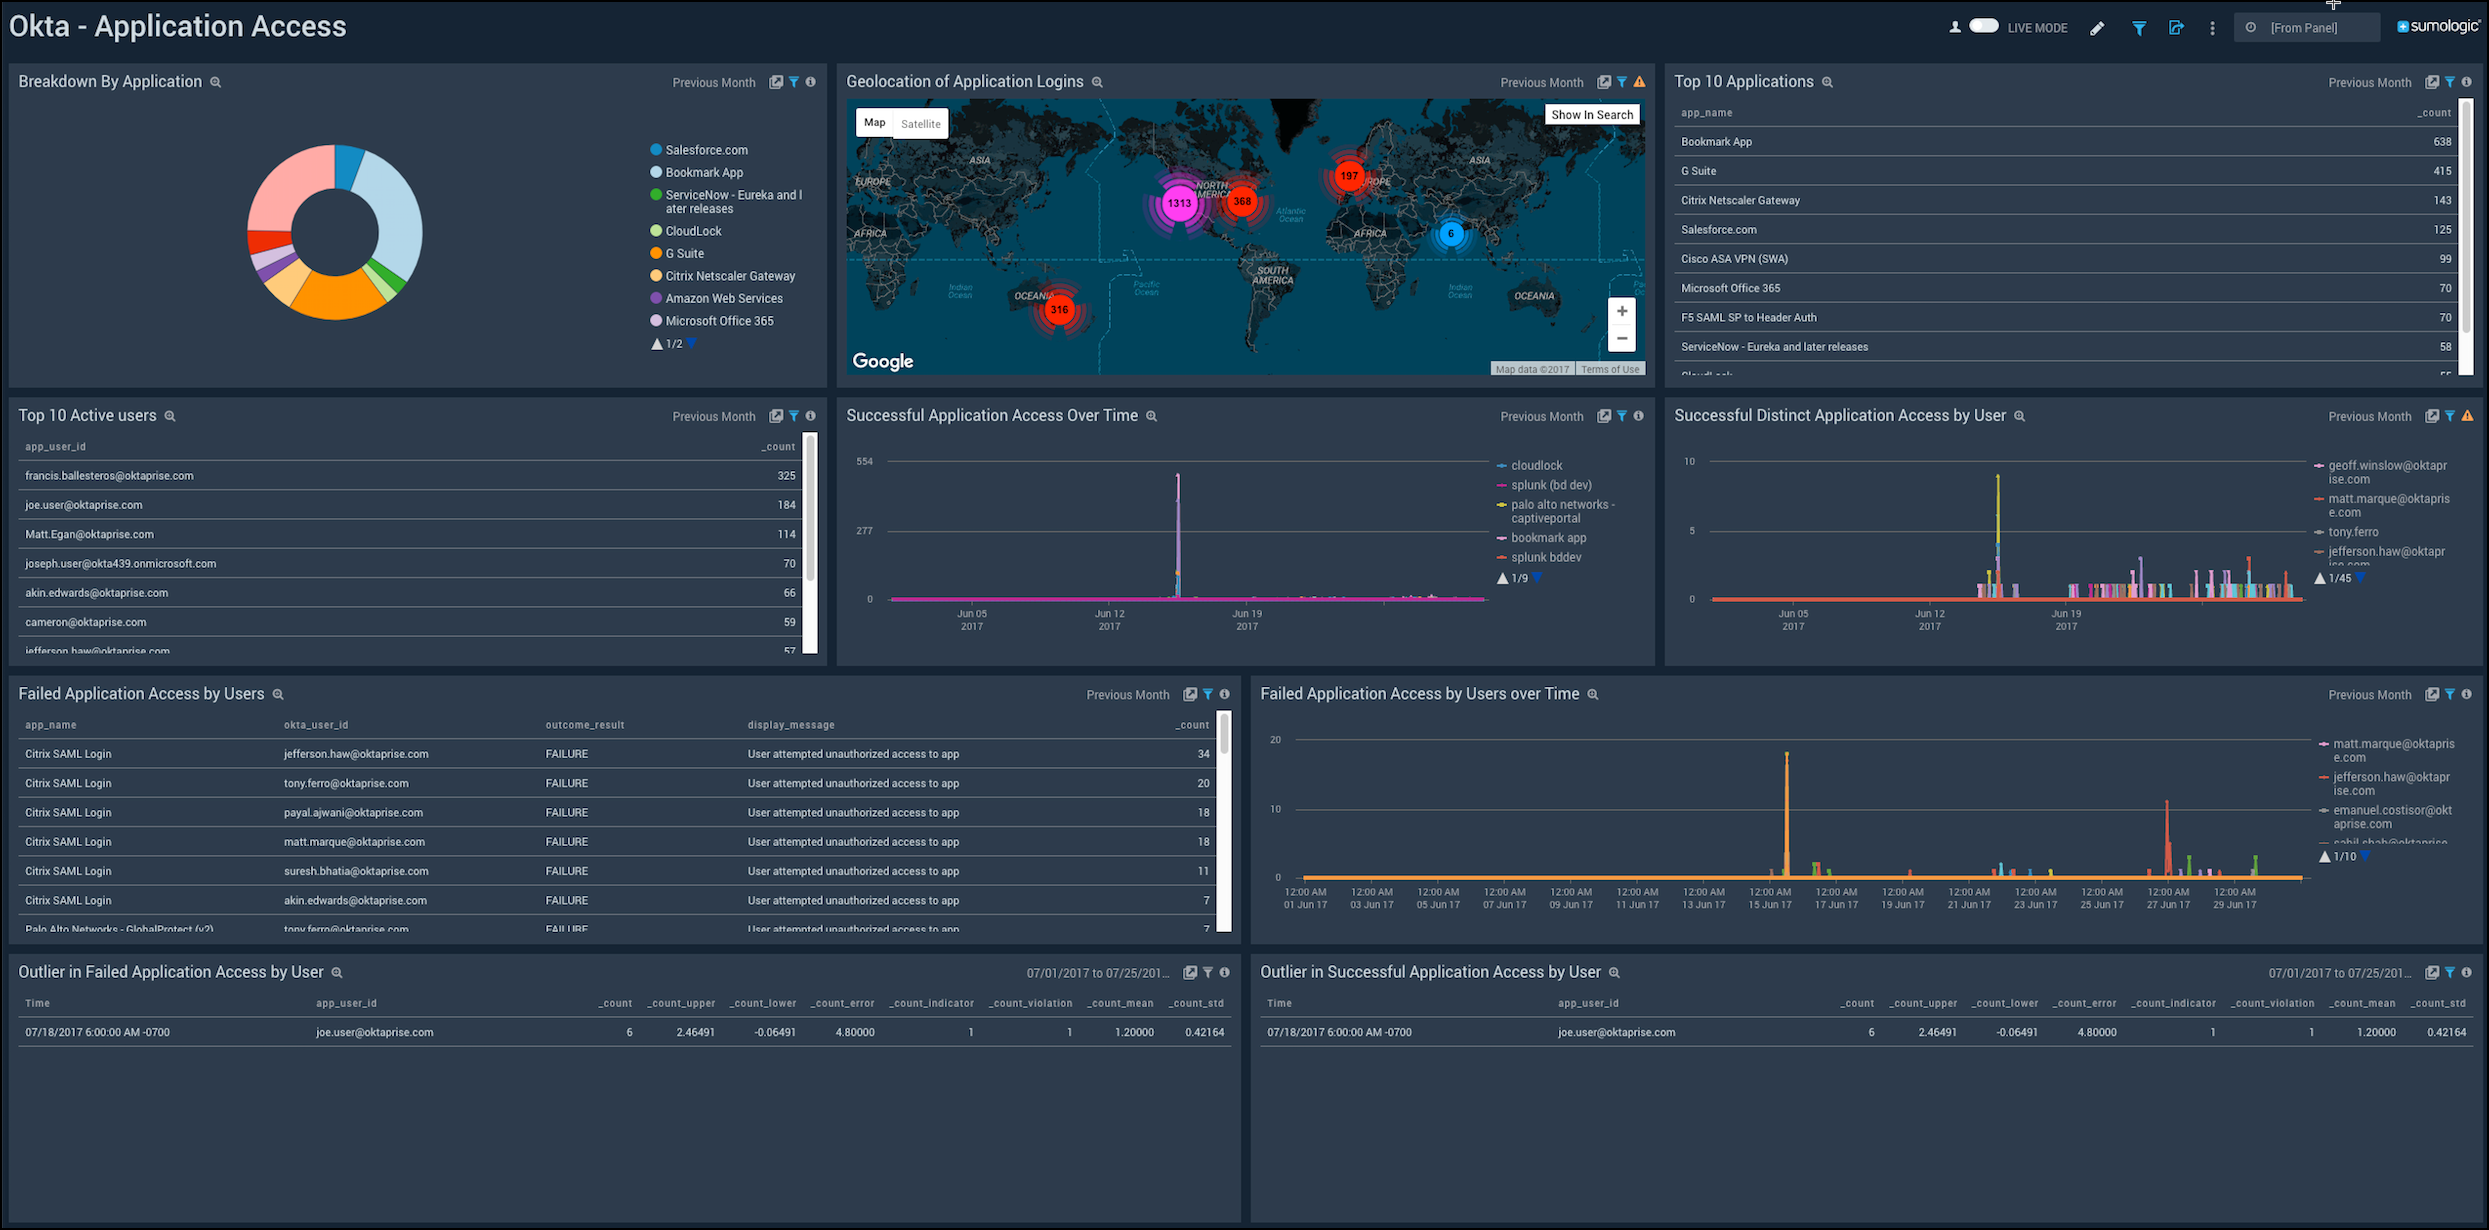
Application Access
Shows the details of accesses by different applications, the location of logins, top 10 active users, successful and failed accesses by applications.
Breakdown By Application. See the Okta access broken down by application in a pie chart for the last three days.
Geolocation of Application Logins. See the number of logins to the application across the world on a map for the last three days.
Top 10 Applications. See the name and count of the top 10 applications accessing Okta in the last three days in a table.
Top 10 Active users. See the name and count of the top 10 users accessing Okta the last three days displayed in a table.
Successful Application Access Over Time. See the successful application accesses over the last three days in a line chart.
Successful Distinct Application Access by User. See the successful application accesses by users over the last three days in a line chart.
Failed Application Access by Users. See the app name, user ID, outcome of access attempt, display message, and count of the failed access by users in the last three days displayed in a table.
Failed Application Access by Users over Time. See the failed accesses by users in the last three days on a line chart.
Outlier in Successful Application Access by User. See the outlier in the successful accesses in the last three days by user ID and count statistics displayed in a table.
Outlier in Failed Application Access by User. See the outlier in the failed accesses in the last three days by user ID and count statistics displayed in a table.
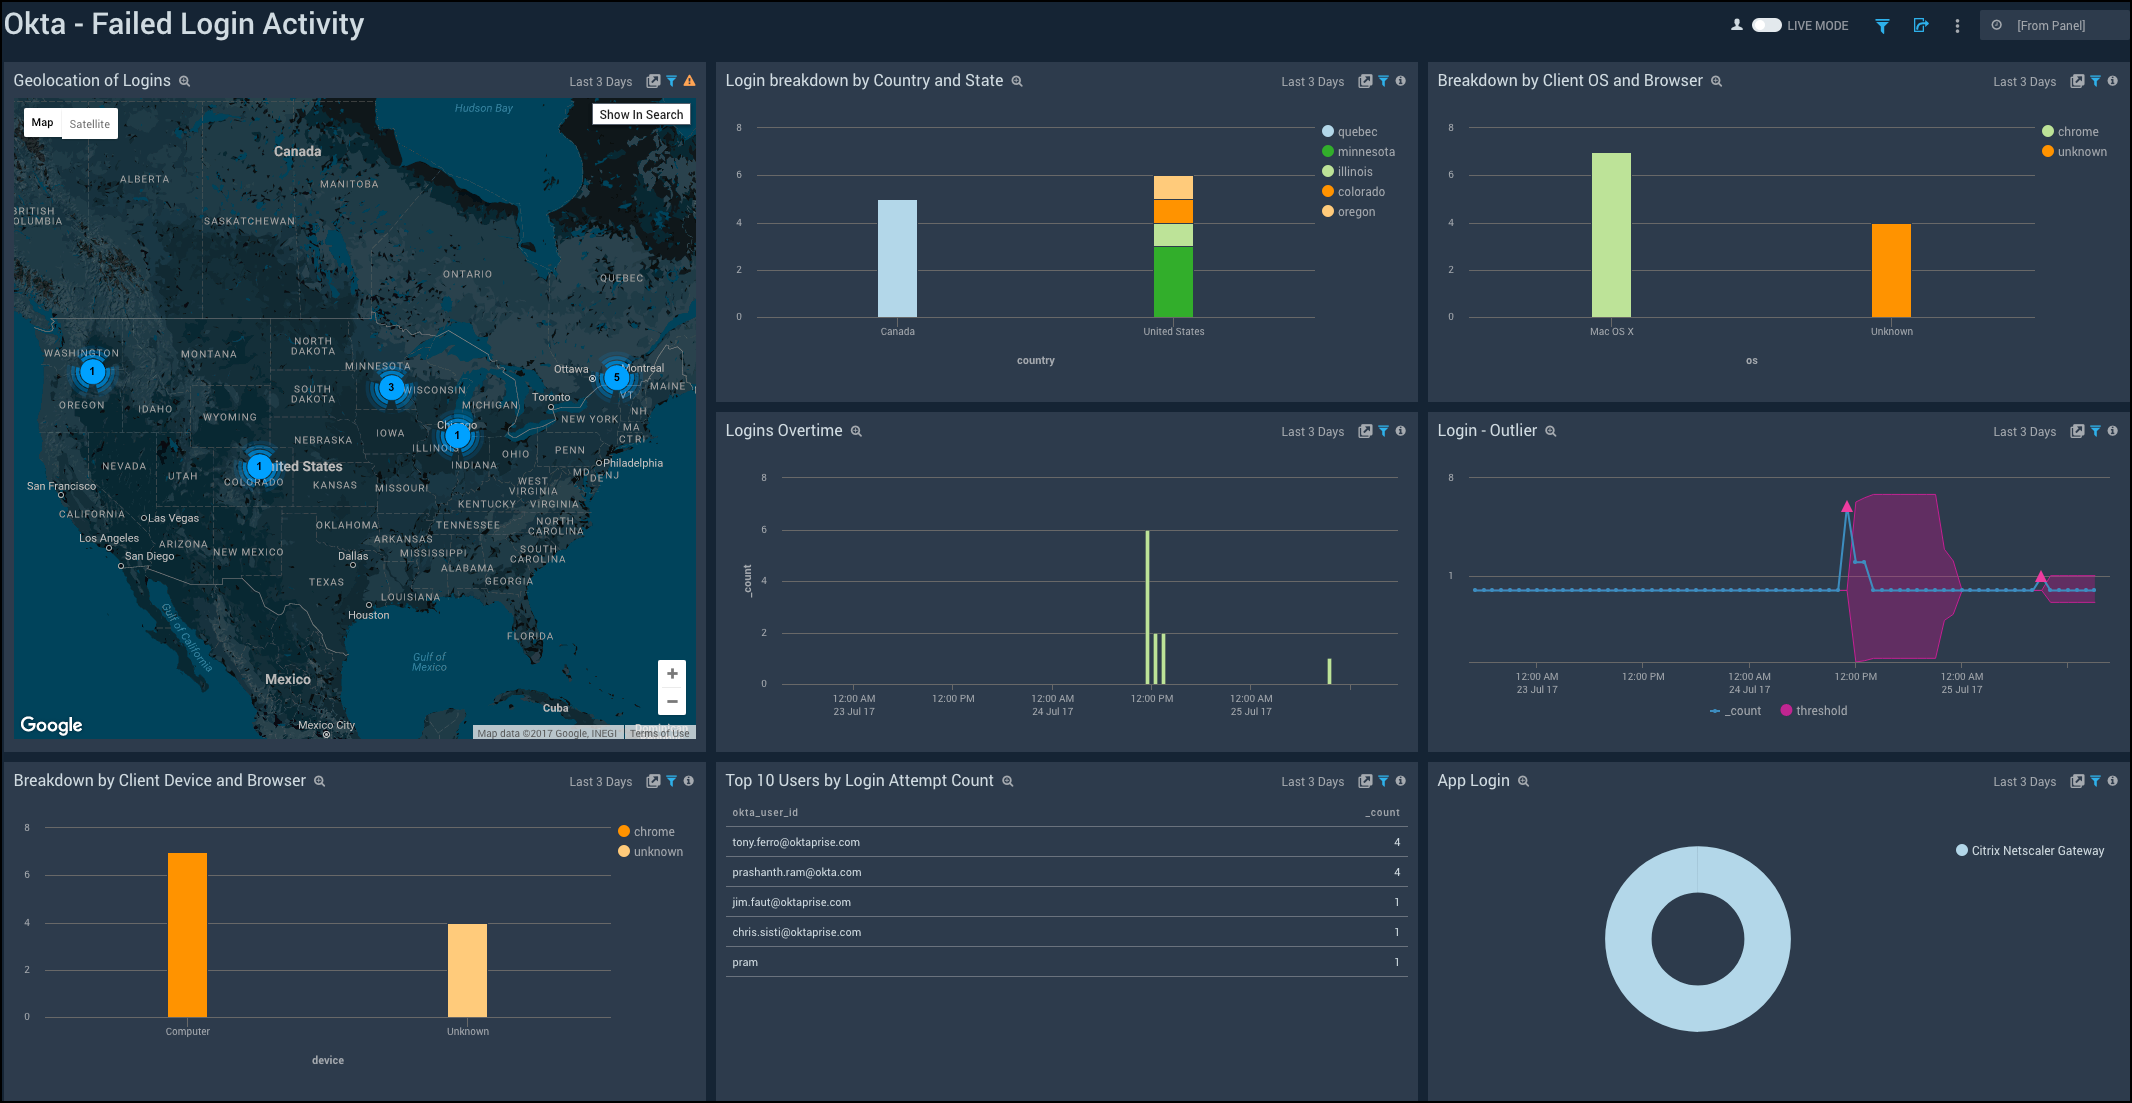
Failed Login Activity
Shows the details of failed logins to Okta such as the geolocation, country, state, OS, browser, device, top 10 users, and application.
Geolocation of Logins. See the number of failed logins across the world on a map for the last three days.
Login breakdown by Country and State. See the count of failed logins broken down by country and state in a stacked column chart on a timeline for the last three days.
Breakdown by Client OS and Browser. See the count of failed logins by browsers broken down by OS in a stacked column chart on a timeline for the last three days.
Logins Overtime. See the count of failed logins over time in the last three days on a column chart.
Login - Outlier. See the failed logins in an outlier chart on a timeline for the last three days.
Breakdown by Client Device and Browser. See the count of failed logins by browsers broken down by devices in a stacked column chart on a timeline for the last three days.
Top 10 Users by Login Attempt Count. See the top 10 users with the count of failed login attempts for the last three days in a table.
App Login. See the breakdown of failed logins by applications for the last three days on a pie chart.
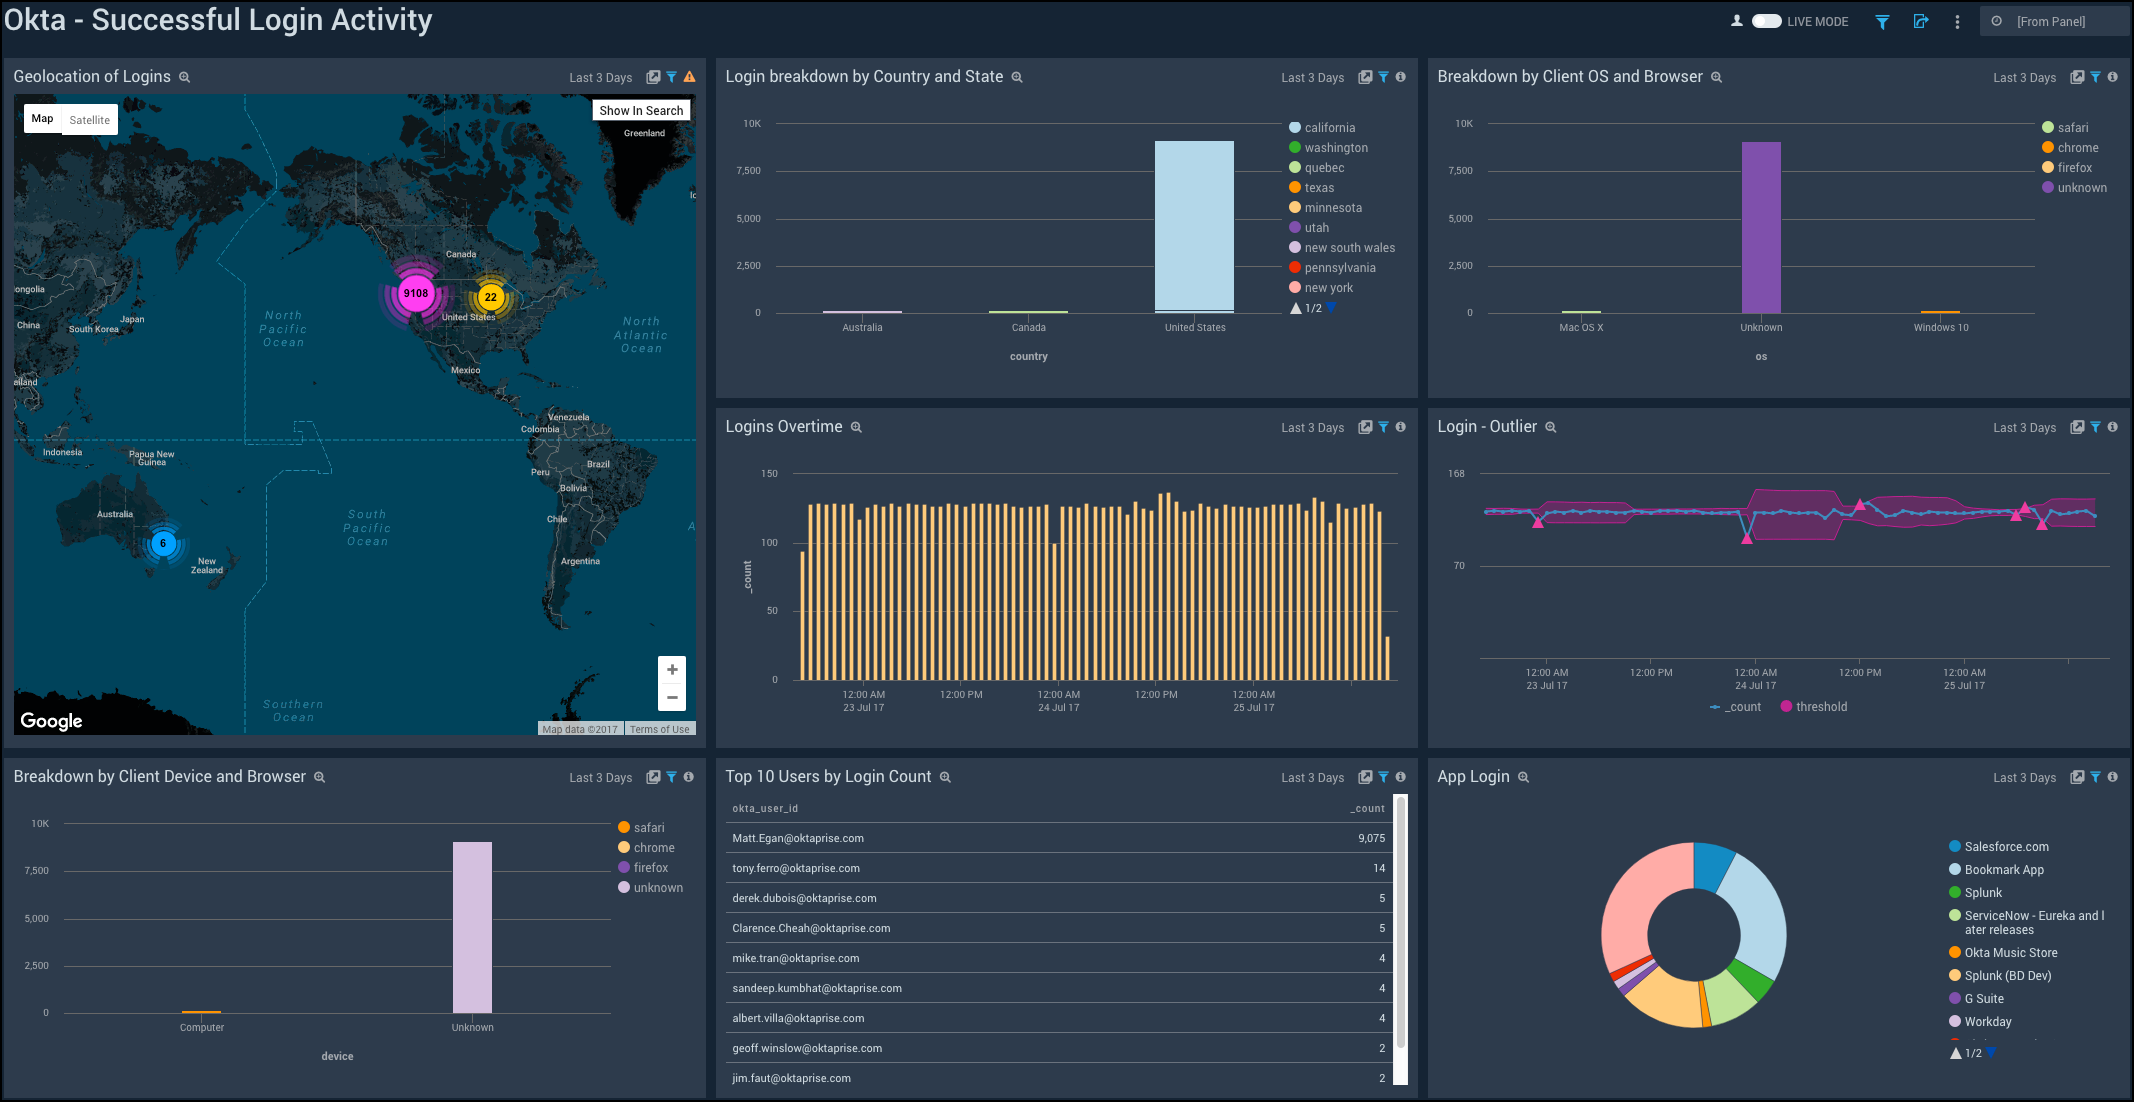
Successful Login Activity
Shows the details of successful logins to Okta such as the device, browser, country, state, OS, geolocation, logins overtime, outlier, top 10 users, and application.
Geolocation of Logins. See the number of successful logins across the world on a map for the last three days.
Login breakdown by Country and State. See the count of successful logins broken down by country and state in a stacked column chart on a timeline for the last three days.
Breakdown by Client OS and Browser. See the count of successful logins by browsers broken down by OS in a stacked column chart on a timeline for the last three days.
Logins Overtime. See the count of successful logins over time in the last three days on a column chart.
Login - Outlier. See the successful logins in an outlier chart on a timeline for the last three days.
Breakdown by Client Device and Browser. See the count of successful logins by browsers broken down by devices in a stacked column chart on a timeline for the last three days.
Top 10 Users by Login Count. See the top 10 users with the count of successful logins for the last three days in a table.
App Login. See the breakdown of successful logins by applications for the last three days on a pie chart.
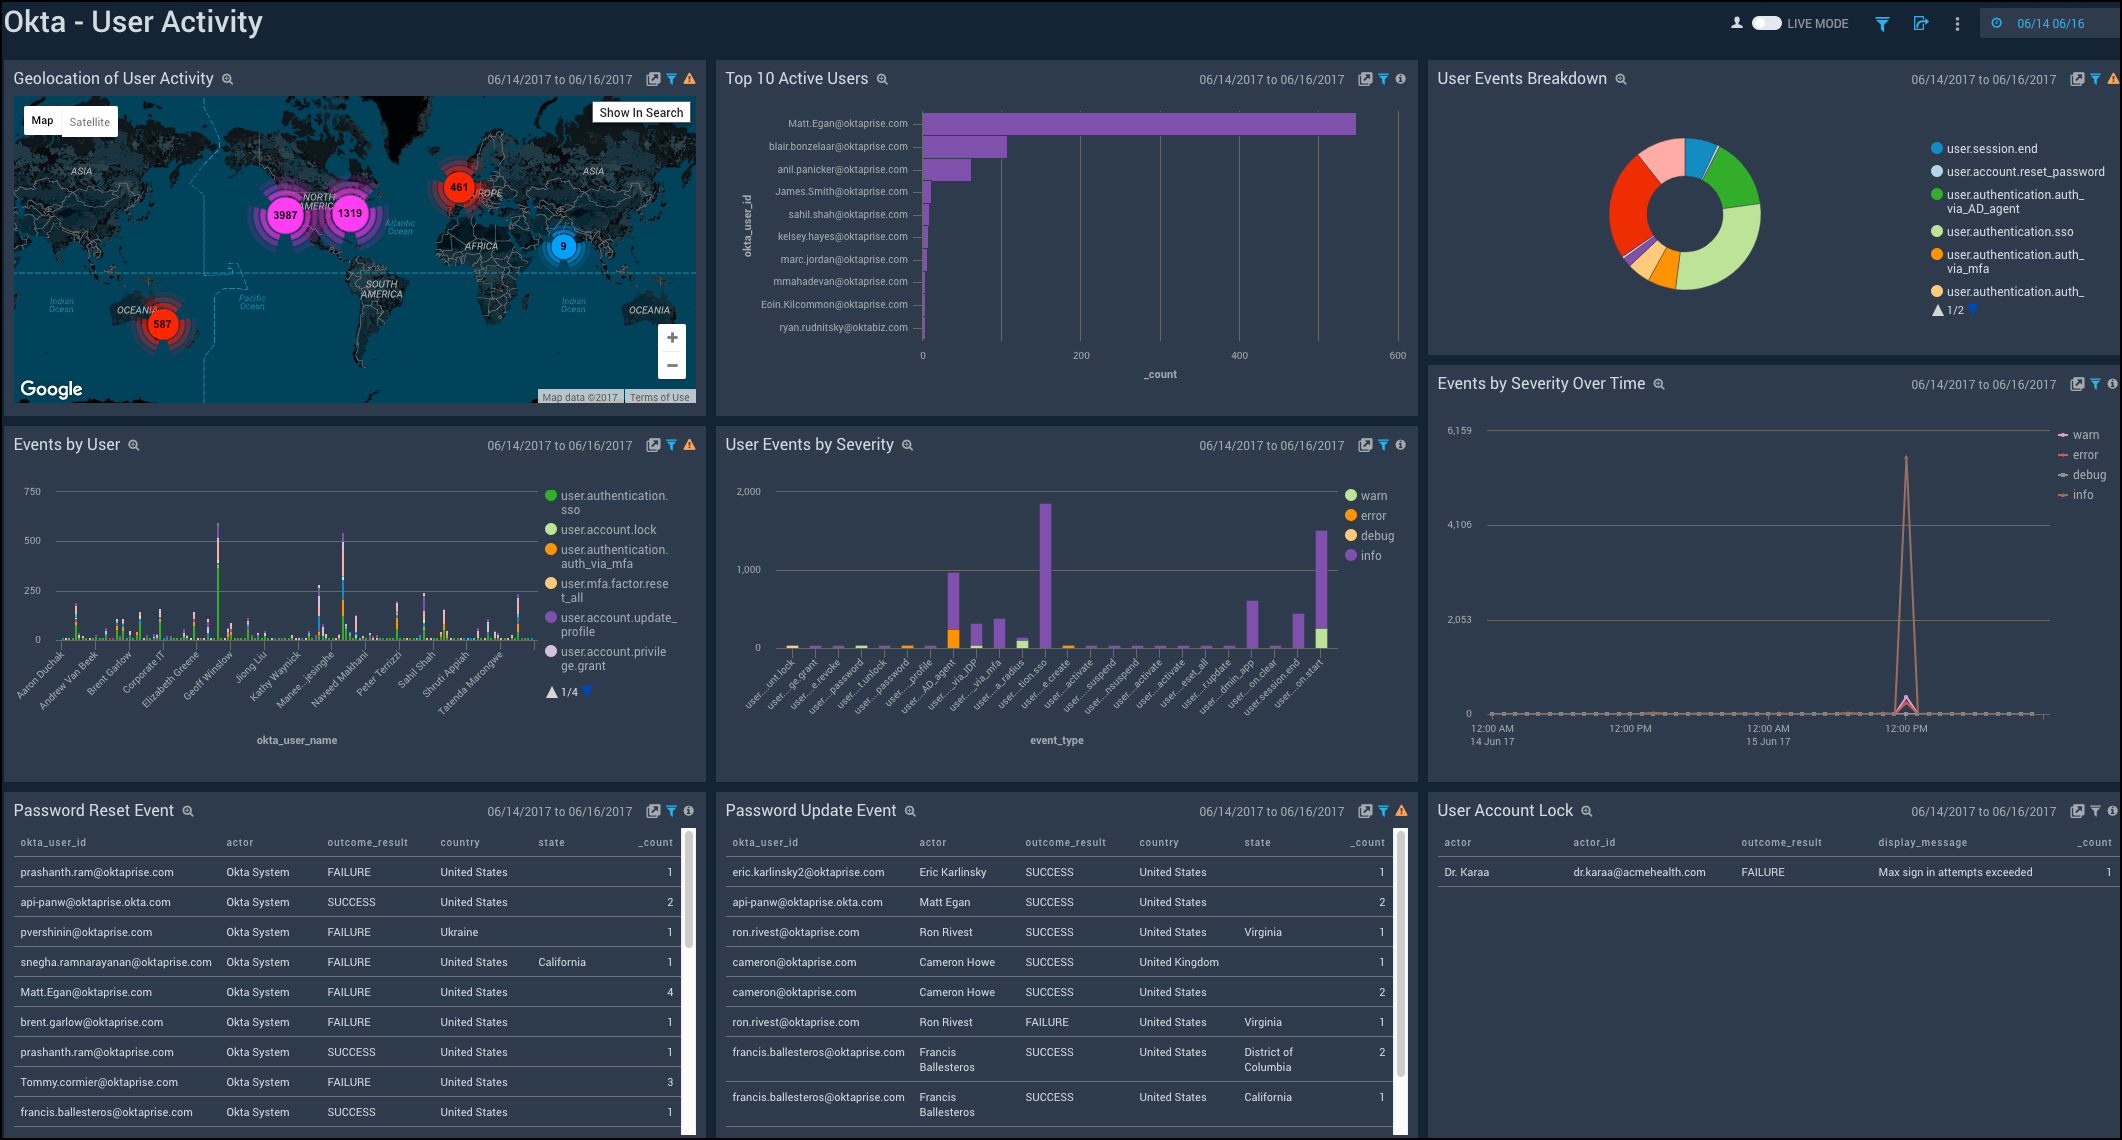
User Activity
Shows the details of user activity such as the geolocation, top 10 users, user events, events by users, events by severity, password resets, password updates, and user account locks.
Geolocation of User Activity. See the number of user activities across the world on a map for the last 24 hours.
Top 10 Active Users. See the top 10 active users in the last 24 hours displayed on a bar chart.
User Events Breakdown. See the breakdown of user events in the last 24 hours on a pie chart.
Events by User. See the count of events per user in the last 24 hours on a column chart.
User Events by Severity. See the count of user events by severity for the last 24 hours on a column chart.
Events by Severity Over Time. See the count of events by severity for the last 24 hours on a line chart.
Password Reset Event. See the details of password reset events such as the username, actor, outcome result, country, state, and count, in the last 24 hours displayed in a table.
Password Update Event. See the details of password update events such as the username, actor, outcome result, country, state, and count, in the last 24 hours displayed in a table.
User Account Lock. See the details of locked user accounts in the last 24 hours such as the actor, actor ID, outcome result, displayed message, and count, shown in a table.
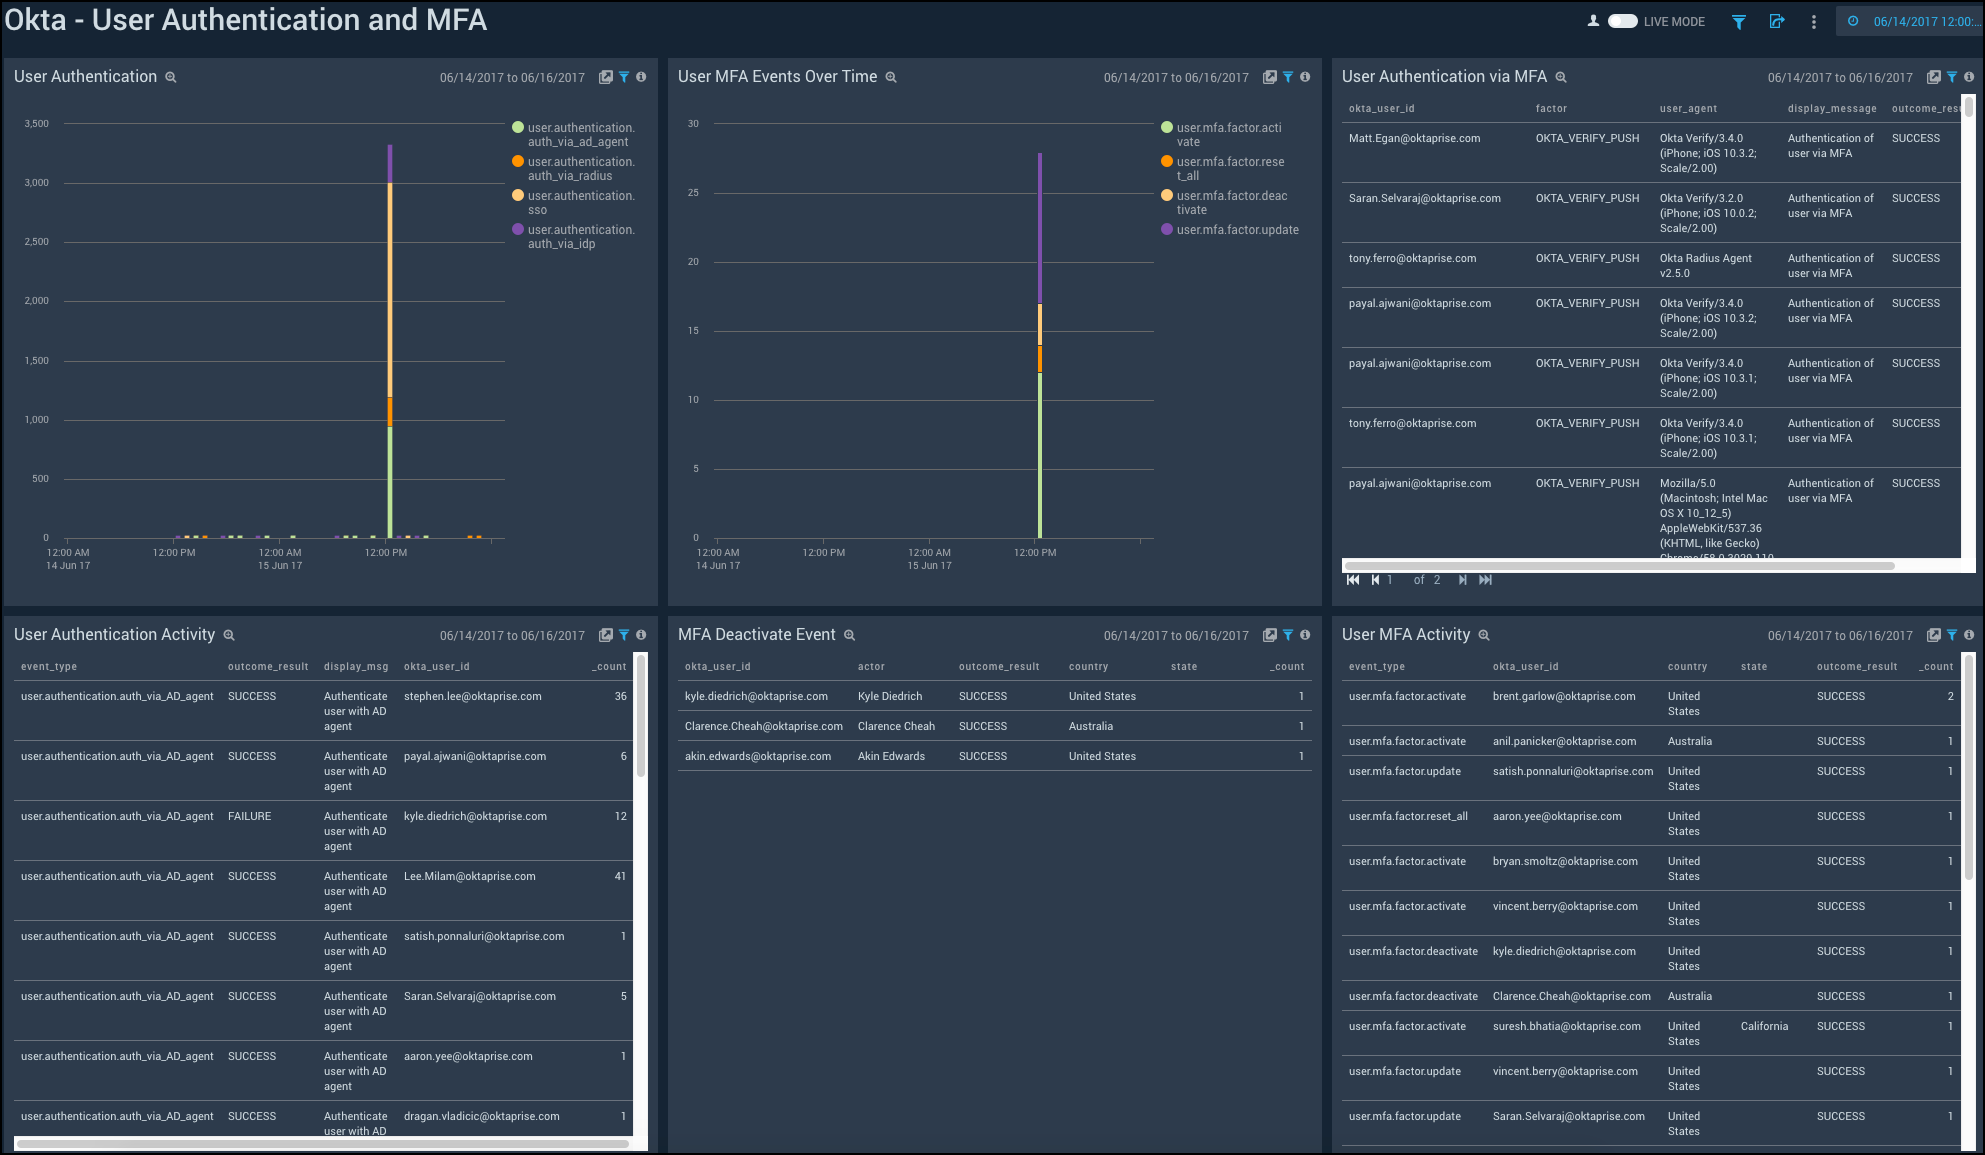
User Authentication and MFA
Shows the details of user authentication and Multi-Factor Authentication (MFA) activities such as the user authentication over time, MFA events, MFA deactivation, and user authentication using MFA.
User Authentication. See the count of user authentication in the last 24 hours on a column chart.
User MFA Events Over Time. See the count of user MFA events in the last 24 hours on a column chart.
User Authentication via MFA. See the details of user authentication using MFA such as the user ID, factor, user agent, display message, outcome result, and count, in the last 24 hours displayed in a table.
User Authentication Activity. See the count of user authentication activities in the last 24 hours on a stacked column chart.
MFA Deactivate Event. See the details of MFA deactivate event in the last 24 hours such as the user ID, actor, outcome result, country, state, and count, shown in a table.
User MFA Activity. See the details of user MFA activities such as the event type, result, reason, user ID, username, and count, in the last 24 hours, displayed in a table.