Metrics Engine Updates
This page describes updates to the Sumo Logic Metrics Engine, and how your existing metrics queries might be affected by the changes.
Change to metadata in aggregate query results
The first change affects how the metric dimension is labeled in the results of queries that perform an aggregation function, such as avg, count, sum, min, max, pct.
Current behavior
Currently, the metric dimension shown in aggregate query results depends on whether the query returns one or multiple values for the metric dimension.
- If query results include only one value for the
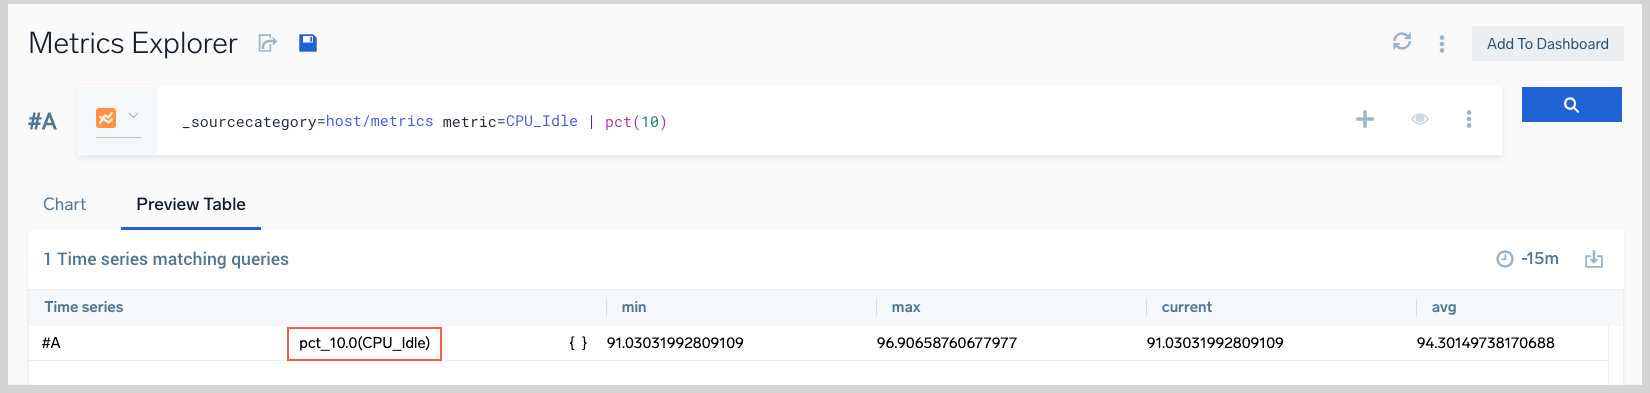
metricdimension, the resultingmetricdimension includes the aggregation function (in the case ofpct, suffixed with its parameter) and the originalmetricdimension. For example, given the query:
_sourceCategory=host/metrics metric=CPU_Idle | pct(10)
In the time series returned, the metric dimension is labeled:
pct_10.0(CPU_Idle)
- If query results include multiple values of the
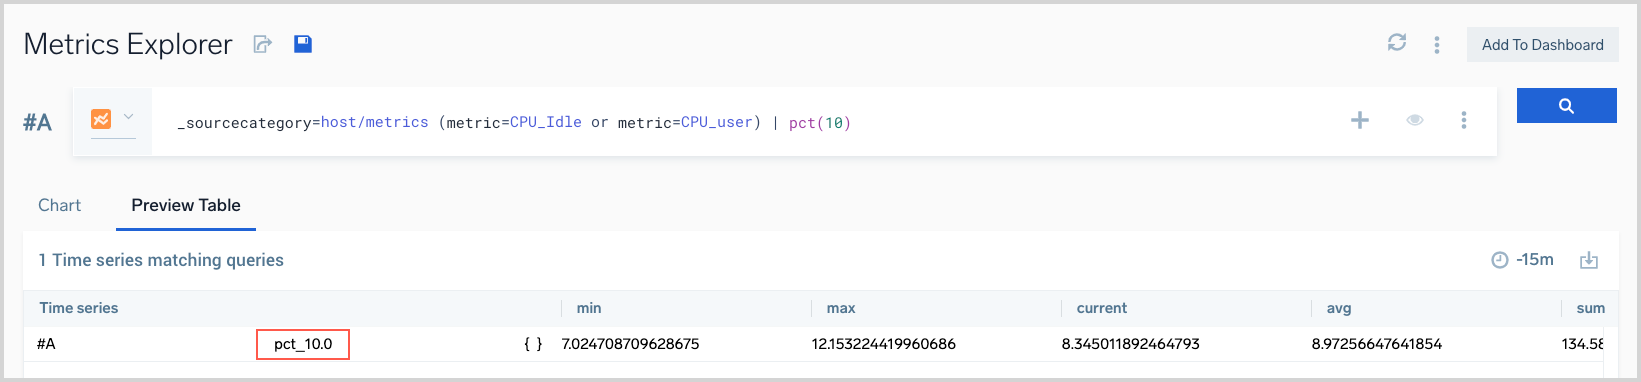
metricdimension, the resultingmetricdimension is just the name of the aggregation function, for examplemax. If the aggregation function ispct, will be suffixed with its parameter. For example, given the query:
_sourceCategory=host/metrics (metric=CPU_Idle or metric=CPU_user) | pct(10)
In the time series returned, the metric dimension would be labeled:
pct_10.0
New behavior
With this change, the output metric dimension will always contain just the name of the aggregation function (or in the case of pct, the name of the aggregation function, suffixed by its parameter), regardless of the number of unique metric dimensions returned by the query. If you want to include the name of the input metric as well, you must append by metric to the query. (Note that if there are multiple metric values in the input time series, more groups will be created).
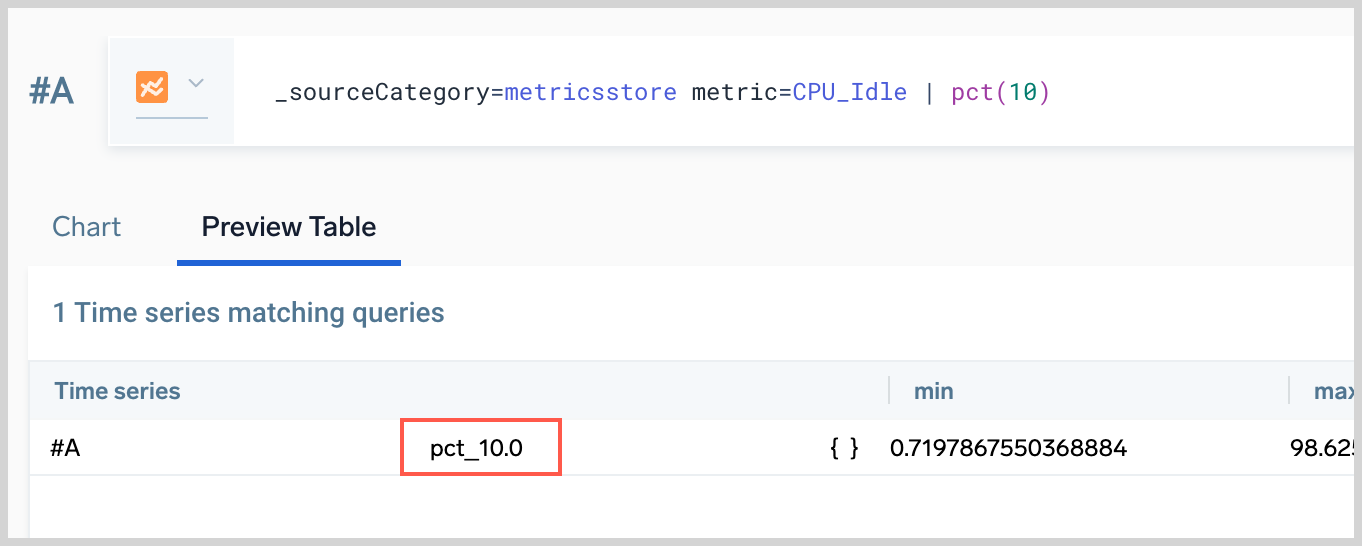
Given the query:
_sourceCategory=host/metrics metric=CPU_Idle | pct(10)
In the time series returned, the metric dimension would be labeled, like this, without the input metric:
pct_10.0
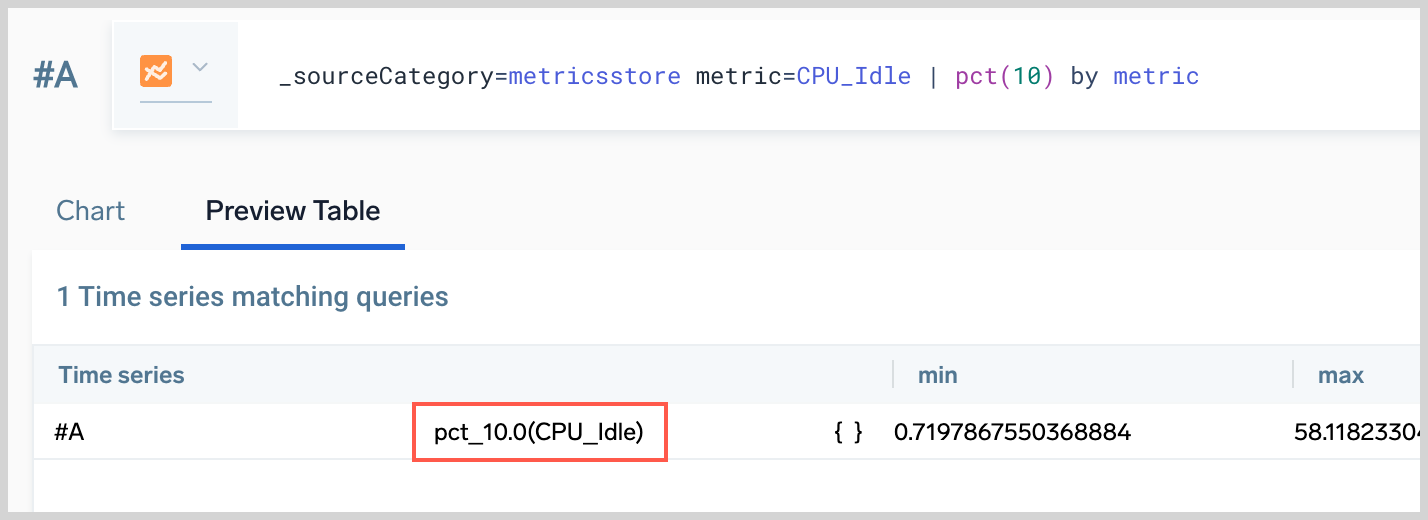
With the by metric clause added to the query:
_sourceCategory=host/metrics metric=CPU_Idle | pct(10) by metric
In the time series returned, the metric dimension would be labeled:
pct_10.0(CPU_Idle)
How to change queries to ensure metadata is unchanged in results
- If a metric query returns only a single value of a
metricdimension – for example, justCPU_Idle– you must appendby metricto the query to ensure that the metric dimension will still be labeled with the aggregation function and the metric name, for examplepct_10.0(CPU_Idle). - If a metric query returns multiple values of a metric dimension–for example,
CPU_Idle and CPU_User– no change to the query is required.
Changes to reducer functions
The Sumo Logic metric query language supports the following reducer functions: eval, filter, topk, bottomk.
Queries that meet all the following conditions will be affected by this change.
- Don’t contain an explicit
quantize using <agg>statement (where<agg>is a quantization method). - Do contain a reducer function that uses at least one of these aggregation functions:
min,max,sum,count. - The quantization used on the selector level (implicitly or explicitly) is less granular than the reporting interval. Of course, it depends on the underlying data, but typically, the quantization must be bigger than 1 minute so that a query can be affected.
For example, this query meets the conditions above, and so would be affected by the v2 change (typically, as stated above, it depends on the underlying data):
metric=CPU_Idle | quantize to 15m | filter min > 20 and max < 50
Current behavior
In the example query above, we use the filter qualifiers from the query (min and max) as the quantization method, and hence do two quantizations (min and max) on all raw data points. The filter function is applied across those results. In other words the reducing function operates on “real” minimum and maximum values (in this example) across all raw data points.
The query results that appear on the chart view are based upon quantizing the data using avg.
New behavior
We use avg as the quantization method:
- if the query does not contain using
<agg>(becauseavgis the default when method is not specified), or - if the query does contain
using avg.
If another quantization method is explicitly specified in the query, for example using sum, we use that method.
The example query is effectively rewritten from:
metric=CPU_Idle | quantize to 15m | filter min > 20 and max < 50
to
metric=CPU_Idle | quantize to 15m using avg | filter min > 20 and max < 50
As a result, the minimum and maximum values used for filtering will be the minimum and maximum values of the averages of 15 minute buckets.
How to change existing queries to ensure quantization behavior is unchanged
To preserve the previous behavior, you can rewrite the query to use a join. For example:
You could rewrite this query:
metric=CPU_Idle | quantize to 15m | filter min > 20
as the three queries shown below. (The third query, #C, joins the two queries above it.)
#A metric=CPU_Idle | quantize to 15m using min | filter min > 20 | eval 1
#B metric=CPU_Idle | quantize to 15m
#C #A * #B along <dimensions>
Where <dimensions> is the dimension (or dimensions) that uniquely identifies the time series in the results. Which dimensions uniquely identify your time series depends on your underlying data. Keep in mind that because metrics are typically generated by an entity–a particular host, Kubernetes pod, cluster, and so on–the dimension(s) that identify the entity that generates a metric should also identify the metrics it generates. For metrics generated by a Sumo Logic Host Metrics Source, the _sourceHost metadata field is a unique identifier. For metrics generated by Kubernetes pods, pod should do the trick.