AWS API Gateway
Amazon API Gateway service allows you to create RESTful APIs and WebSocket APIs for real-time two-way communication applications in containerized and serverless environments, as well as web applications.
The Sumo Logic AWS API Gateway ULM app provides insights into API Gateway tasks while accepting and processing concurrent API calls throughout your infrastructure, including traffic management, CORS support, authorization and access control, throttling, monitoring, and API version management.
Log and Metric Types
The AWS API Gateway ULM app uses the following logs and metrics:
Sample CloudTrail Log Message
{"eventVersion":"1.05","userIdentity":{"type":"IAMUser","principalId":"A12445W32RZN24HABCD12",
"arn":"arn:aws:iam::123408221234:user/bob","accountId":"123408221234","accessKeyId":
"ASIAZ123456Y3IMWK7X5","userName":"bob","sessionContext":{"sessionIssuer":{},"webIdFederationData":
{},"attributes":{"mfaAuthenticated":"true","creationDate":"2020-02-17T08:08:01Z"}},"invokedBy":
"signin.amazonaws.com"},"eventTime":"2020-02-17T08:08:01Z","eventSource":"apigateway.amazonaws.com",
"eventName":"GetRestApi","awsRegion":"us-east-1","sourceIPAddress":"149.236.17.11","userAgent":
"signin.amazonaws.com","requestParameters":{"restApiId":"w1234nsgjxf","template":false},
"responseElements":null,"requestID":"1234169e-e70a-44a1-a691-3cd3f857092a","eventID":
"051572b0-83ef-49a3-82f6-bbef1ac8c488","readOnly":true,"eventType":"AwsApiCall","recipientAccountId":
"123408221234"}
Sample Query (Metric based)
Average Latency by API Name:
_sourceCategory=Labs/AWS/APIGateway/Metric Namespace=aws/apigateway metric=Latency statistic=Average
account=* region=* entity=* | avg by region, entity
Sample Query (CloudTrail Log based)
_sourceCategory=Labs/AWS/CloudTrail/APIGateway "apigateway.amazonaws.com" Namespace={{namespace}}
| json "awsRegion", "eventSource", "eventName" nodrop
| json "requestParameters.basePath" as basePath nodrop
| json "requestParameters.domainName" as domainName nodrop
| json "responseElements.name" as ApiName nodrop // CreateRestApi, ImportRestApi, UpdateRestApi provides ApiName
| json "recipientAccountId" as accountId2 nodrop | json "userIdentity.accountId" as accountId1 nodrop
| if (!isEmpty(accountId1), accountId1, accountId2) as accountId
| where eventSource = "apigateway.amazonaws.com"
| where account matches "{{account}}" and awsRegion matches "{{region}}" and Namespace matches "{{namespace}}"
| count by eventName
| sort by _count, eventName asc
Collect Metrics for AWS API Gateway
- Configure a Hosted Collector.
- Configure an Amazon CloudWatch Source for Metrics.
- Name. Enter a name to display for the new Source.
- Description. Enter an optional description.
- Regions. Select your Amazon Regions for DynamoDB.
- Namespaces. Select AWS/DynamoDB.
- Source Category. Enter dynamodb_metrics.
- Access Key ID and Secret Access Key. Enter your Amazon Access Key ID and Secret Access Key.
- Scan Interval. Use the default of 5 minutes, or enter the frequency Sumo Logic will scan your CloudWatch Sources for new data.
- Click Save.
Collect AWS API Gateway Events using CloudTrail
- To your Hosted Collector, add an AWS CloudTrail Source.
- Name. Enter a name to display for the new Source.
- Description. Enter an optional description.
- S3 Region. Select the Amazon Region for your DynamoDB S3 bucket.
- Bucket Name. Enter the exact name of your DynamoDB S3 bucket.
- Path Expression. Enter the string that matches the S3 objects you'd like to collect. You can use a wildcard (
*) in this string. (DO NOT use a leading forward slash. See Amazon Path Expressions.) The S3 bucket name is not part of the path. Don’t include the bucket name when you are setting the Path Expression. - Source Category. Enter
dynamodb_event. - Access Key ID and Secret Access Key. Enter your Amazon Access Key ID and Secret Access Key.
- Scan Interval. Use the default of 5 minutes. Alternately, enter the frequency Sumo Logic will scan your S3 bucket for new data.
- Enable Timestamp Parsing. Select the check box.
- Time Zone. Select Ignore time zone from log file and instead use, and select UTC.
- Timestamp Format. Select Automatically detect the format.
- Enable Multiline Processing. Select the check box, and select Infer Boundaries.
- Click Save.
AWS API Gateway Dashboards
This page provides examples and descriptions for each of the AWS Observability API Gateway pre-configured dashboards.
The Amazon API Gateway service allows you to create RESTful APIs and WebSocket APIs for real-time two-way communication applications in containerized and serverless environments, as well as web applications.
The Sumo Logic AWS Observability API Gateway dashboards provide insights into API Gateway tasks while accepting and processing concurrent API calls throughout your infrastructure, including traffic management, CORS support, authorization, and access control, throttling, monitoring, and API version management.
We highly recommend you view these dashboards in the Explore View of the AWS Observability solution.
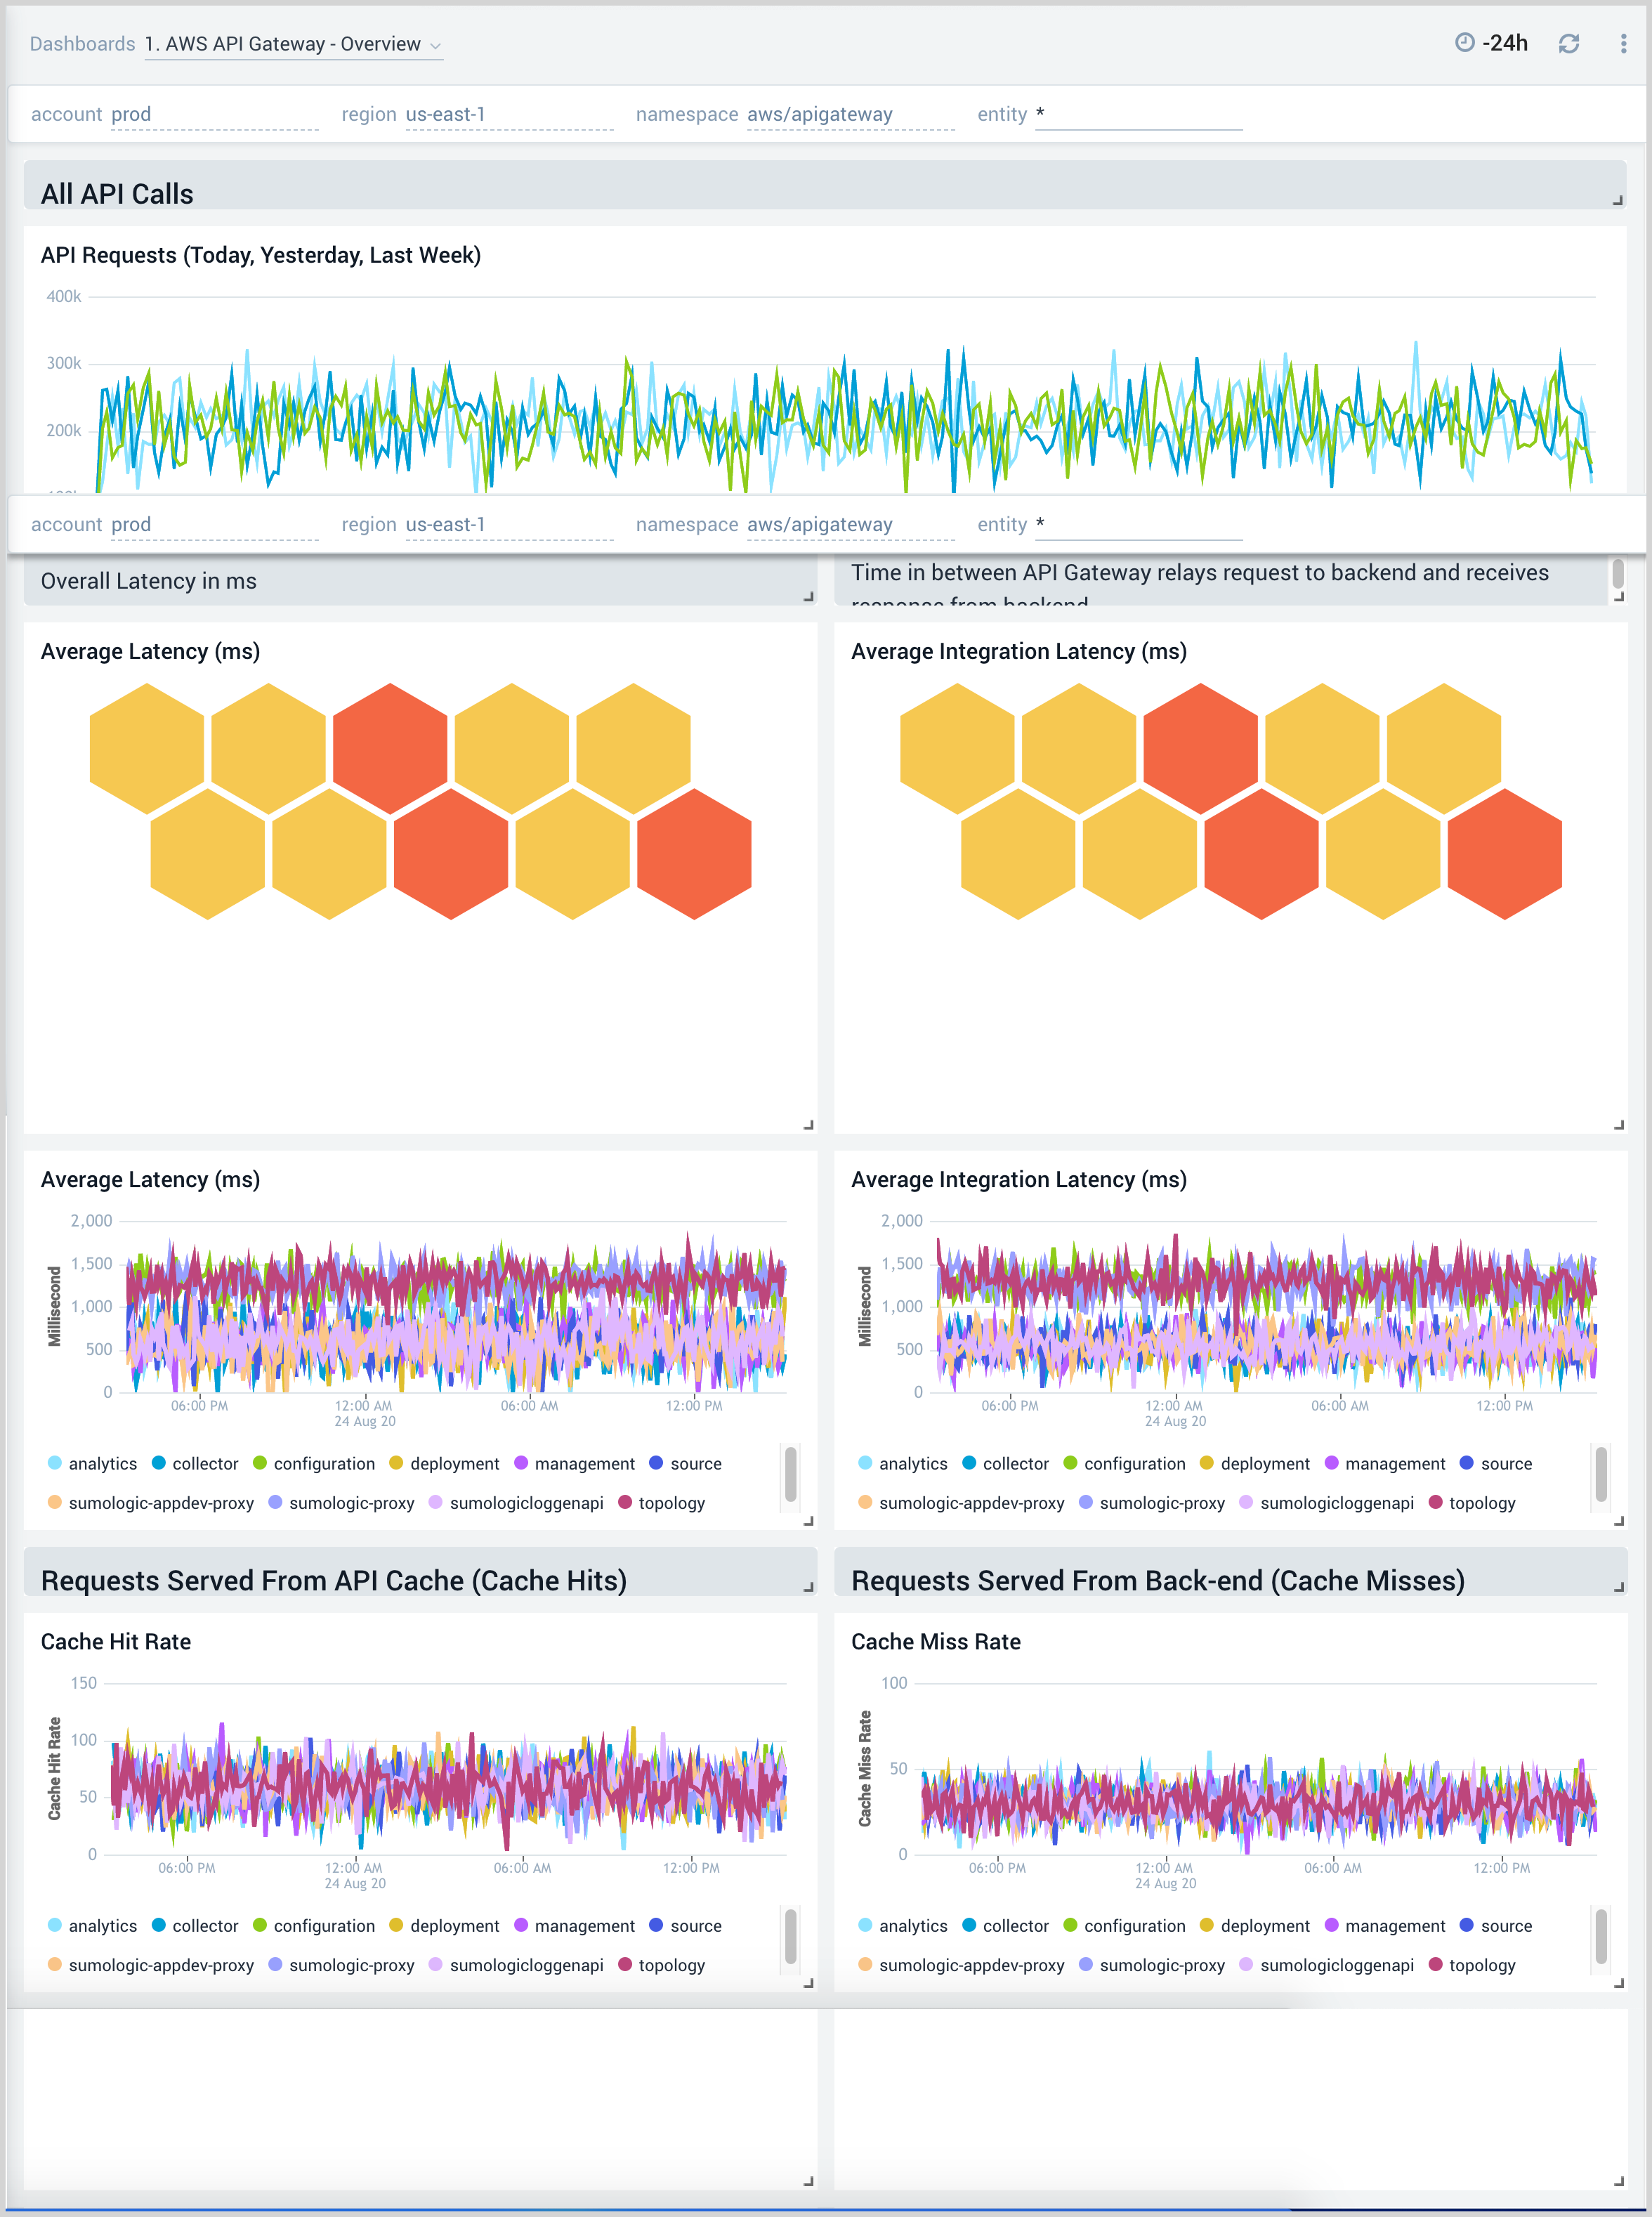
Overview
AWS API Gateway - Overview dashboard provides insights into API Gateway performance throughout your infrastructure, including API calls, latency, client and server-side errors, API cache hits, and back-end cache misses.
To collect CacheHitCount and CacheMissCount metrics, the API cache should be enabled. Follow the steps below to check if your API cache is enabled:
- On AWS console, Go to API Gateway Service and select Specific API > Stages.
- Select the Specific Stage and go to the Settings tab.
- The API should have the "Enable API Cache" checkbox enabled to enable API caching and to collect the CacheHitCount and CacheMissCount metrics.
Use this dashboard to:
- Get a high-level overview of your API Gateway infrastructure.
- Compare API requests made today, yesterday, and last week to identify any abnormal deviations in load.
- Get quick statistics on the number of requests and frequently used APIs.
- Monitor the number of client-side and server-side errors processed by API Gateway instances.
- Monitor relative, backend, and overall API responsiveness.
- Monitor API cache hits and misses by API Gateway across your infrastructure to optimize cache capacities and achieve the desired performance.
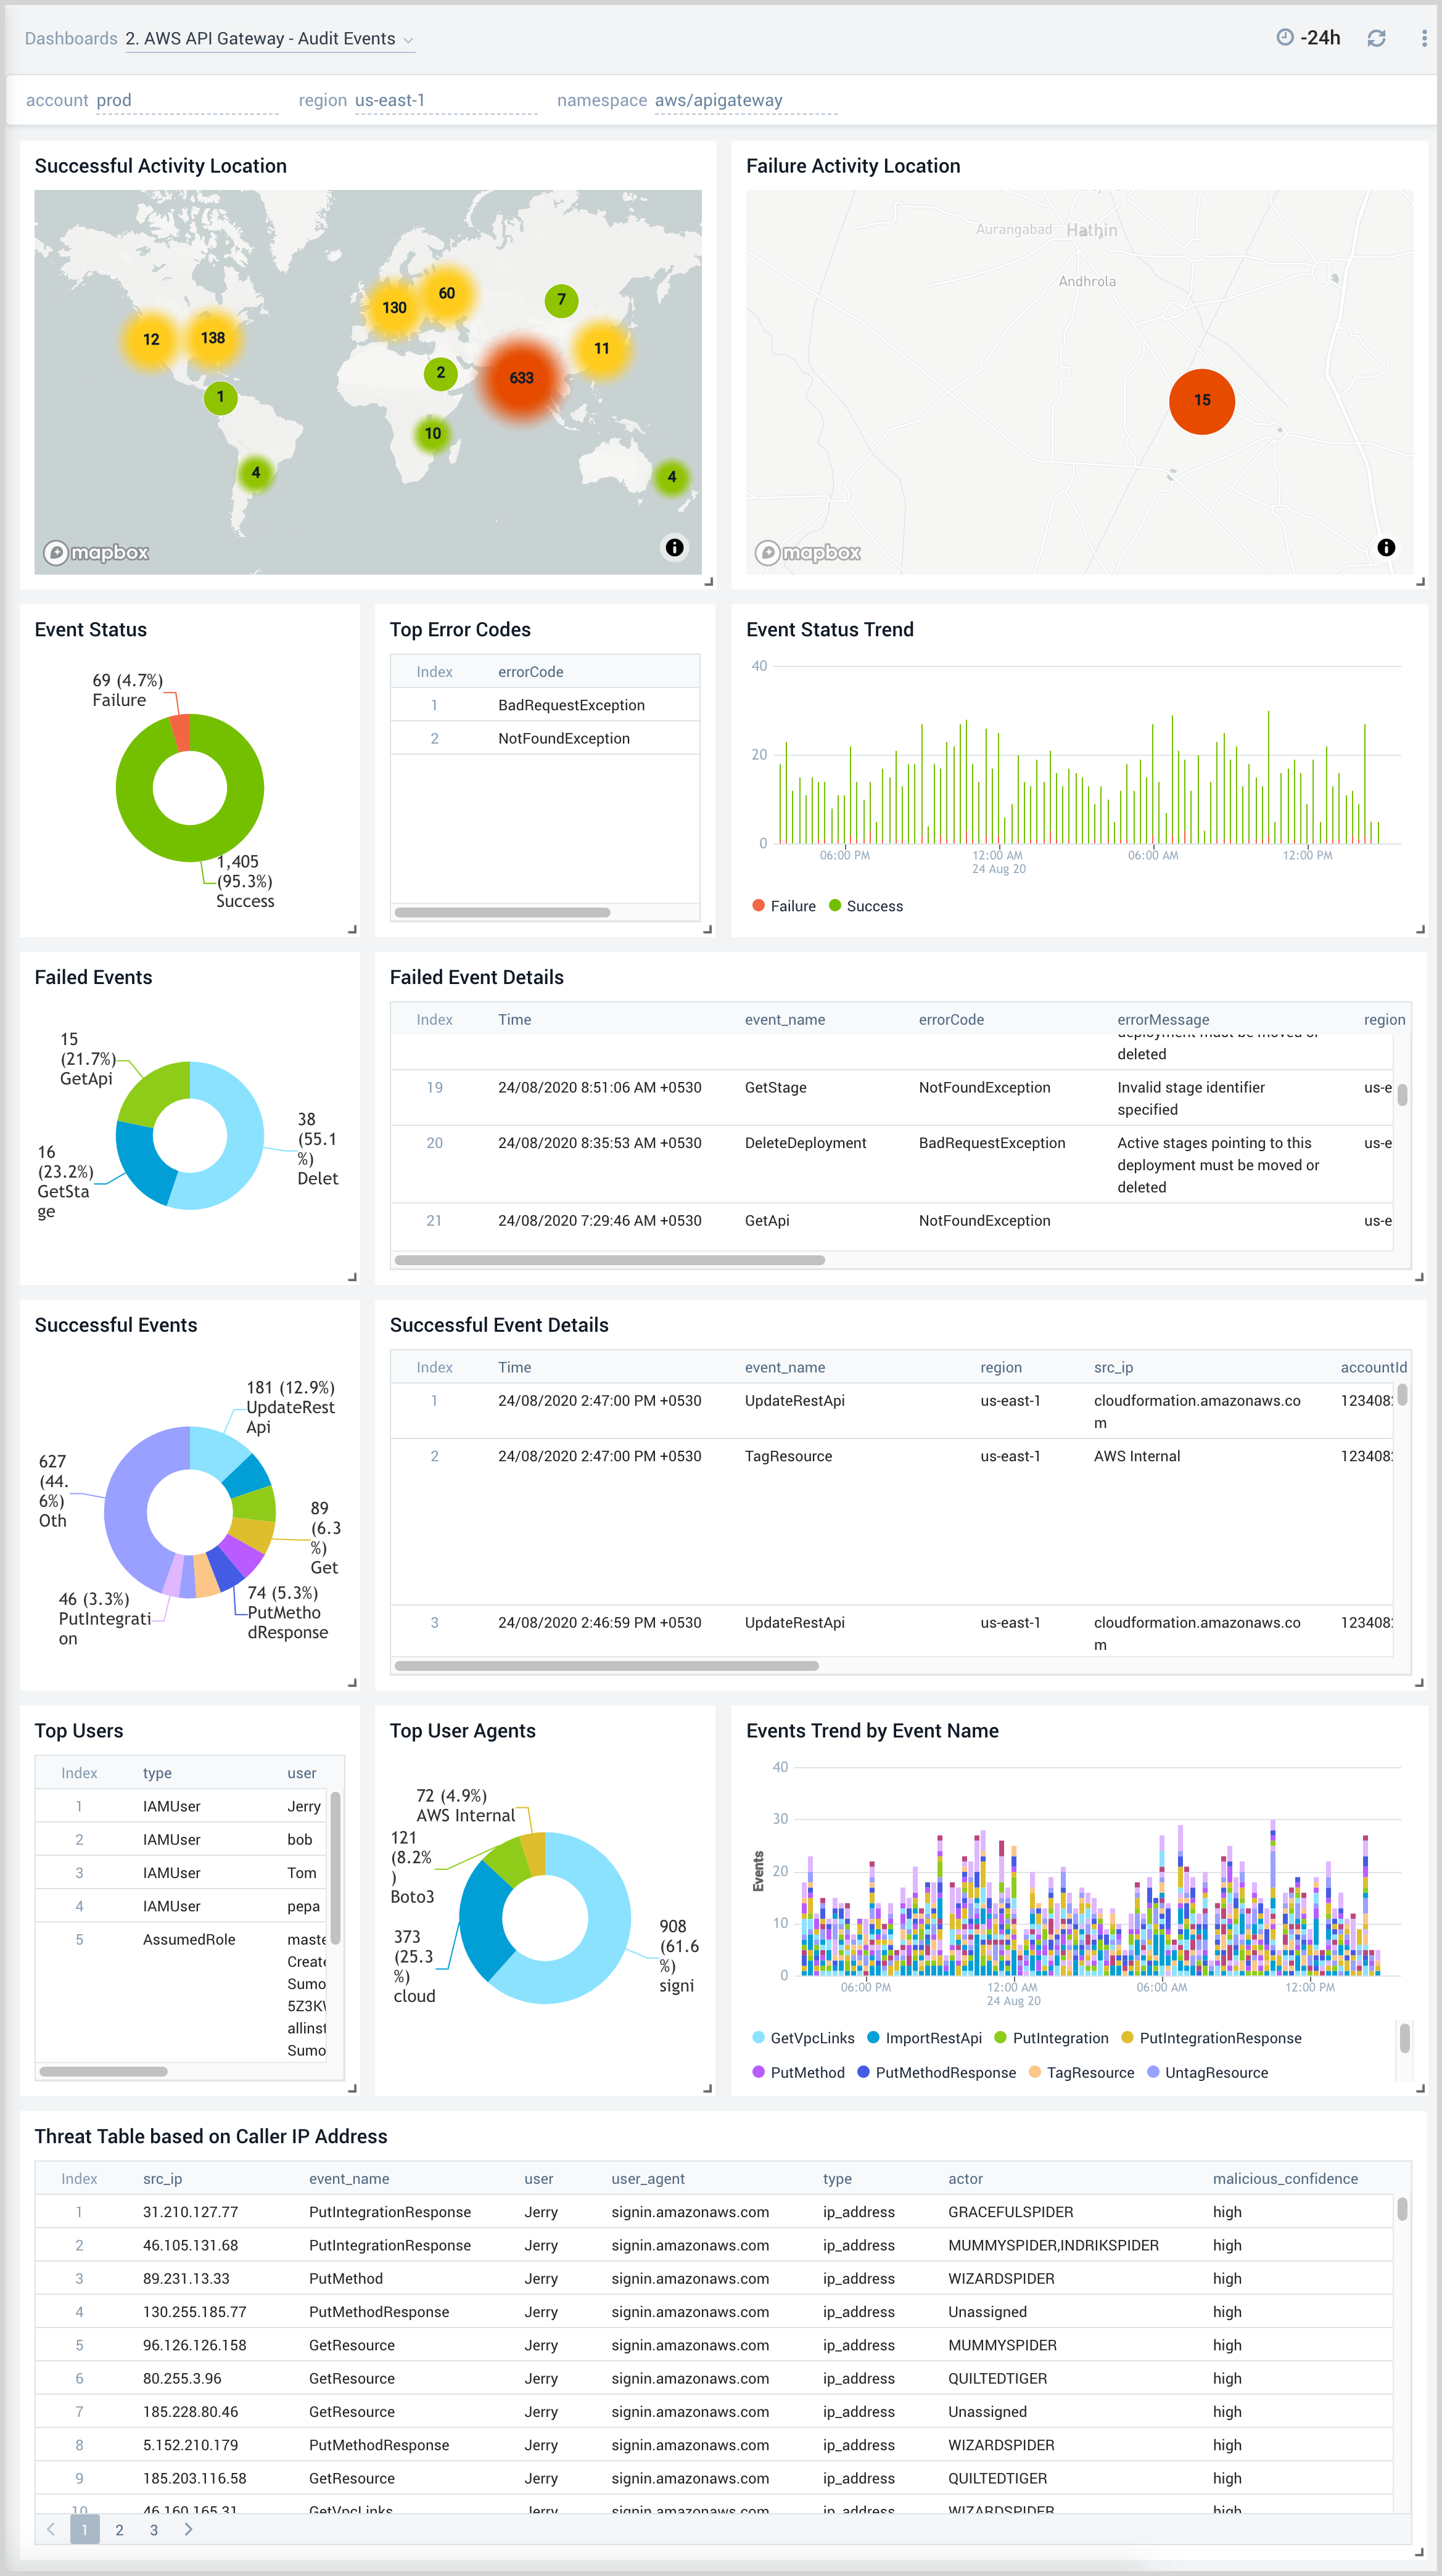
Audit Events
AWS API Gateway - Audit Events dashboard provides detailed audit insights into API Gateway events by various dimensions including event names, trends, regions, user agents, and recipient account IDs.
Use this dashboard to:
- Monitor all API Gateway related audit logs available via CloudTrail events.
- Monitor incoming user activity locations for both successful and failed events to ensure the activity matches expectations.
- Monitor successful and failed API Gateway events, users, and user agents / fail activities and failure reasons.
- Monitor requests coming in from known malicious IP addresses detected via Sumo Logic Threat Intel.
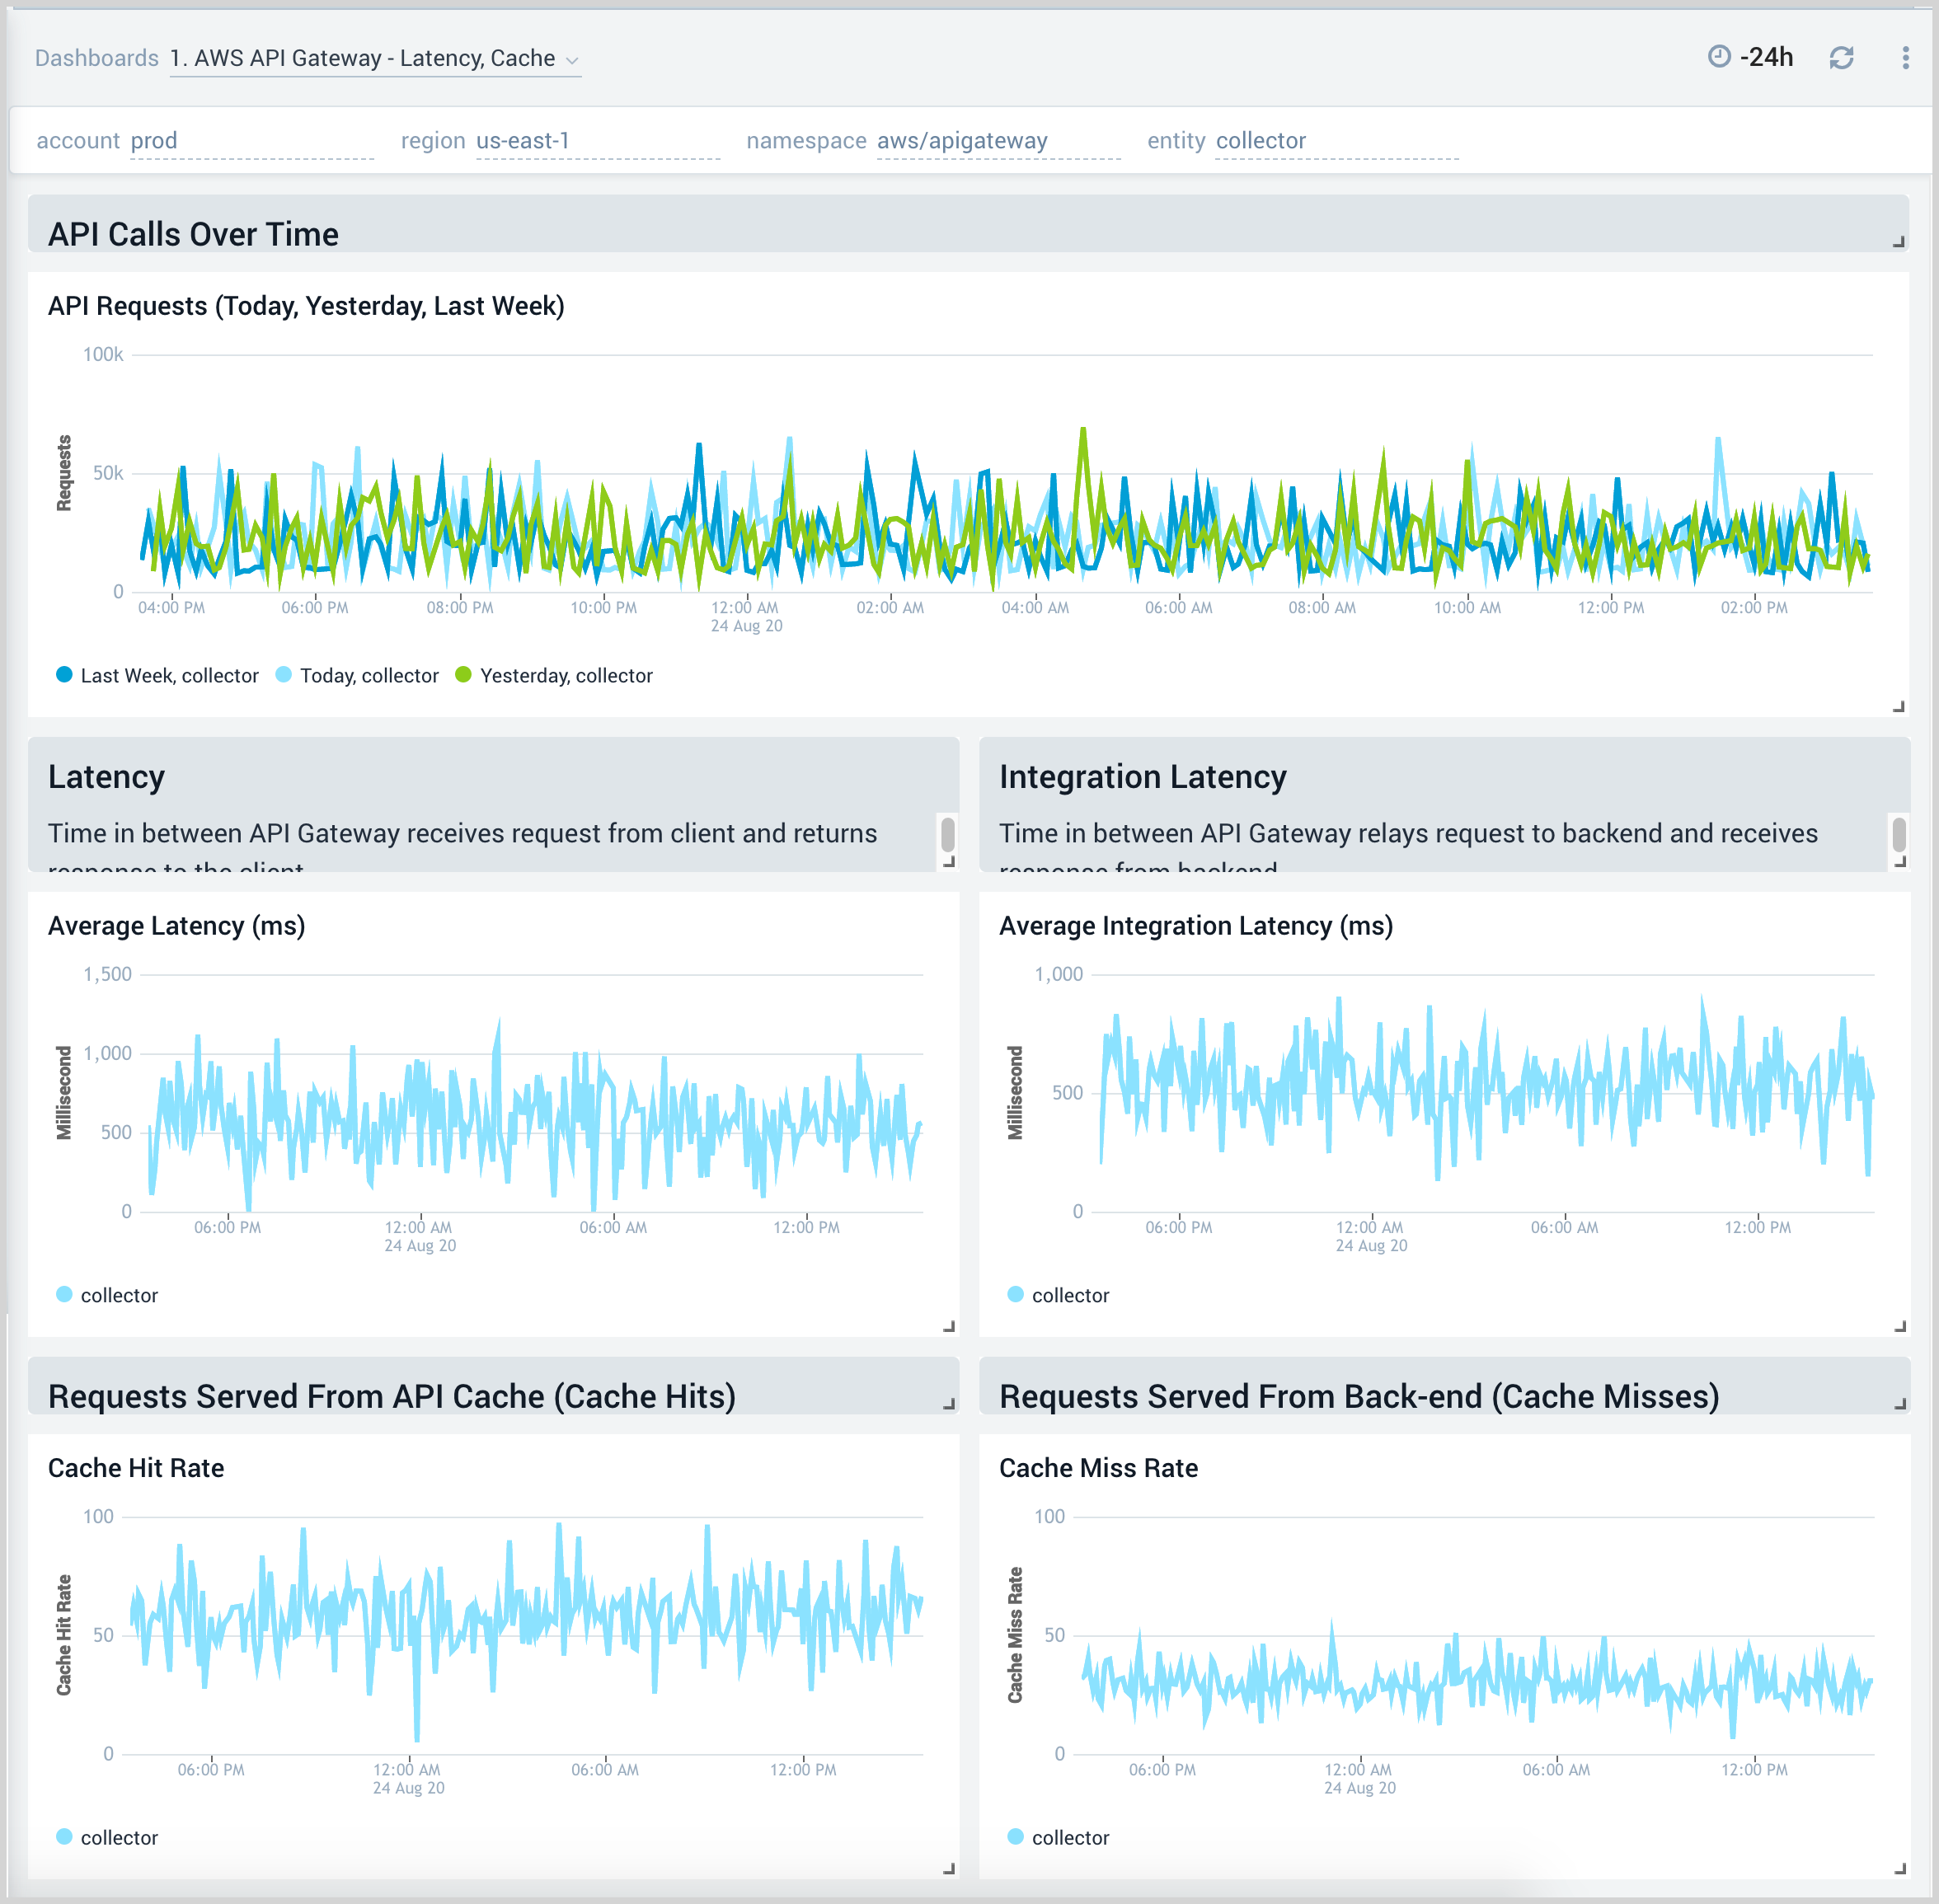
Latency, Cache
AWS API Gateway - Latency, Cache dashboard provides insights into API Gateway performance including API requests, latency, API cache hits, and back-end cache misses.
Use this dashboard to:
- Monitor the overall responsiveness of API calls (latency), comparing times (in milliseconds) between receiving a request from and returning a response to a client.
- Monitor the responsiveness of the backend (integration latency), comparing times (in milliseconds) between API Gateway relay requests to and receiving a response back from the backend.
- Monitor API cache hits and misses to optimize cache capacities across your infrastructure and achieve the desired performance.
- Compare API requests made today, yesterday, and last week identify any abnormal deviations.
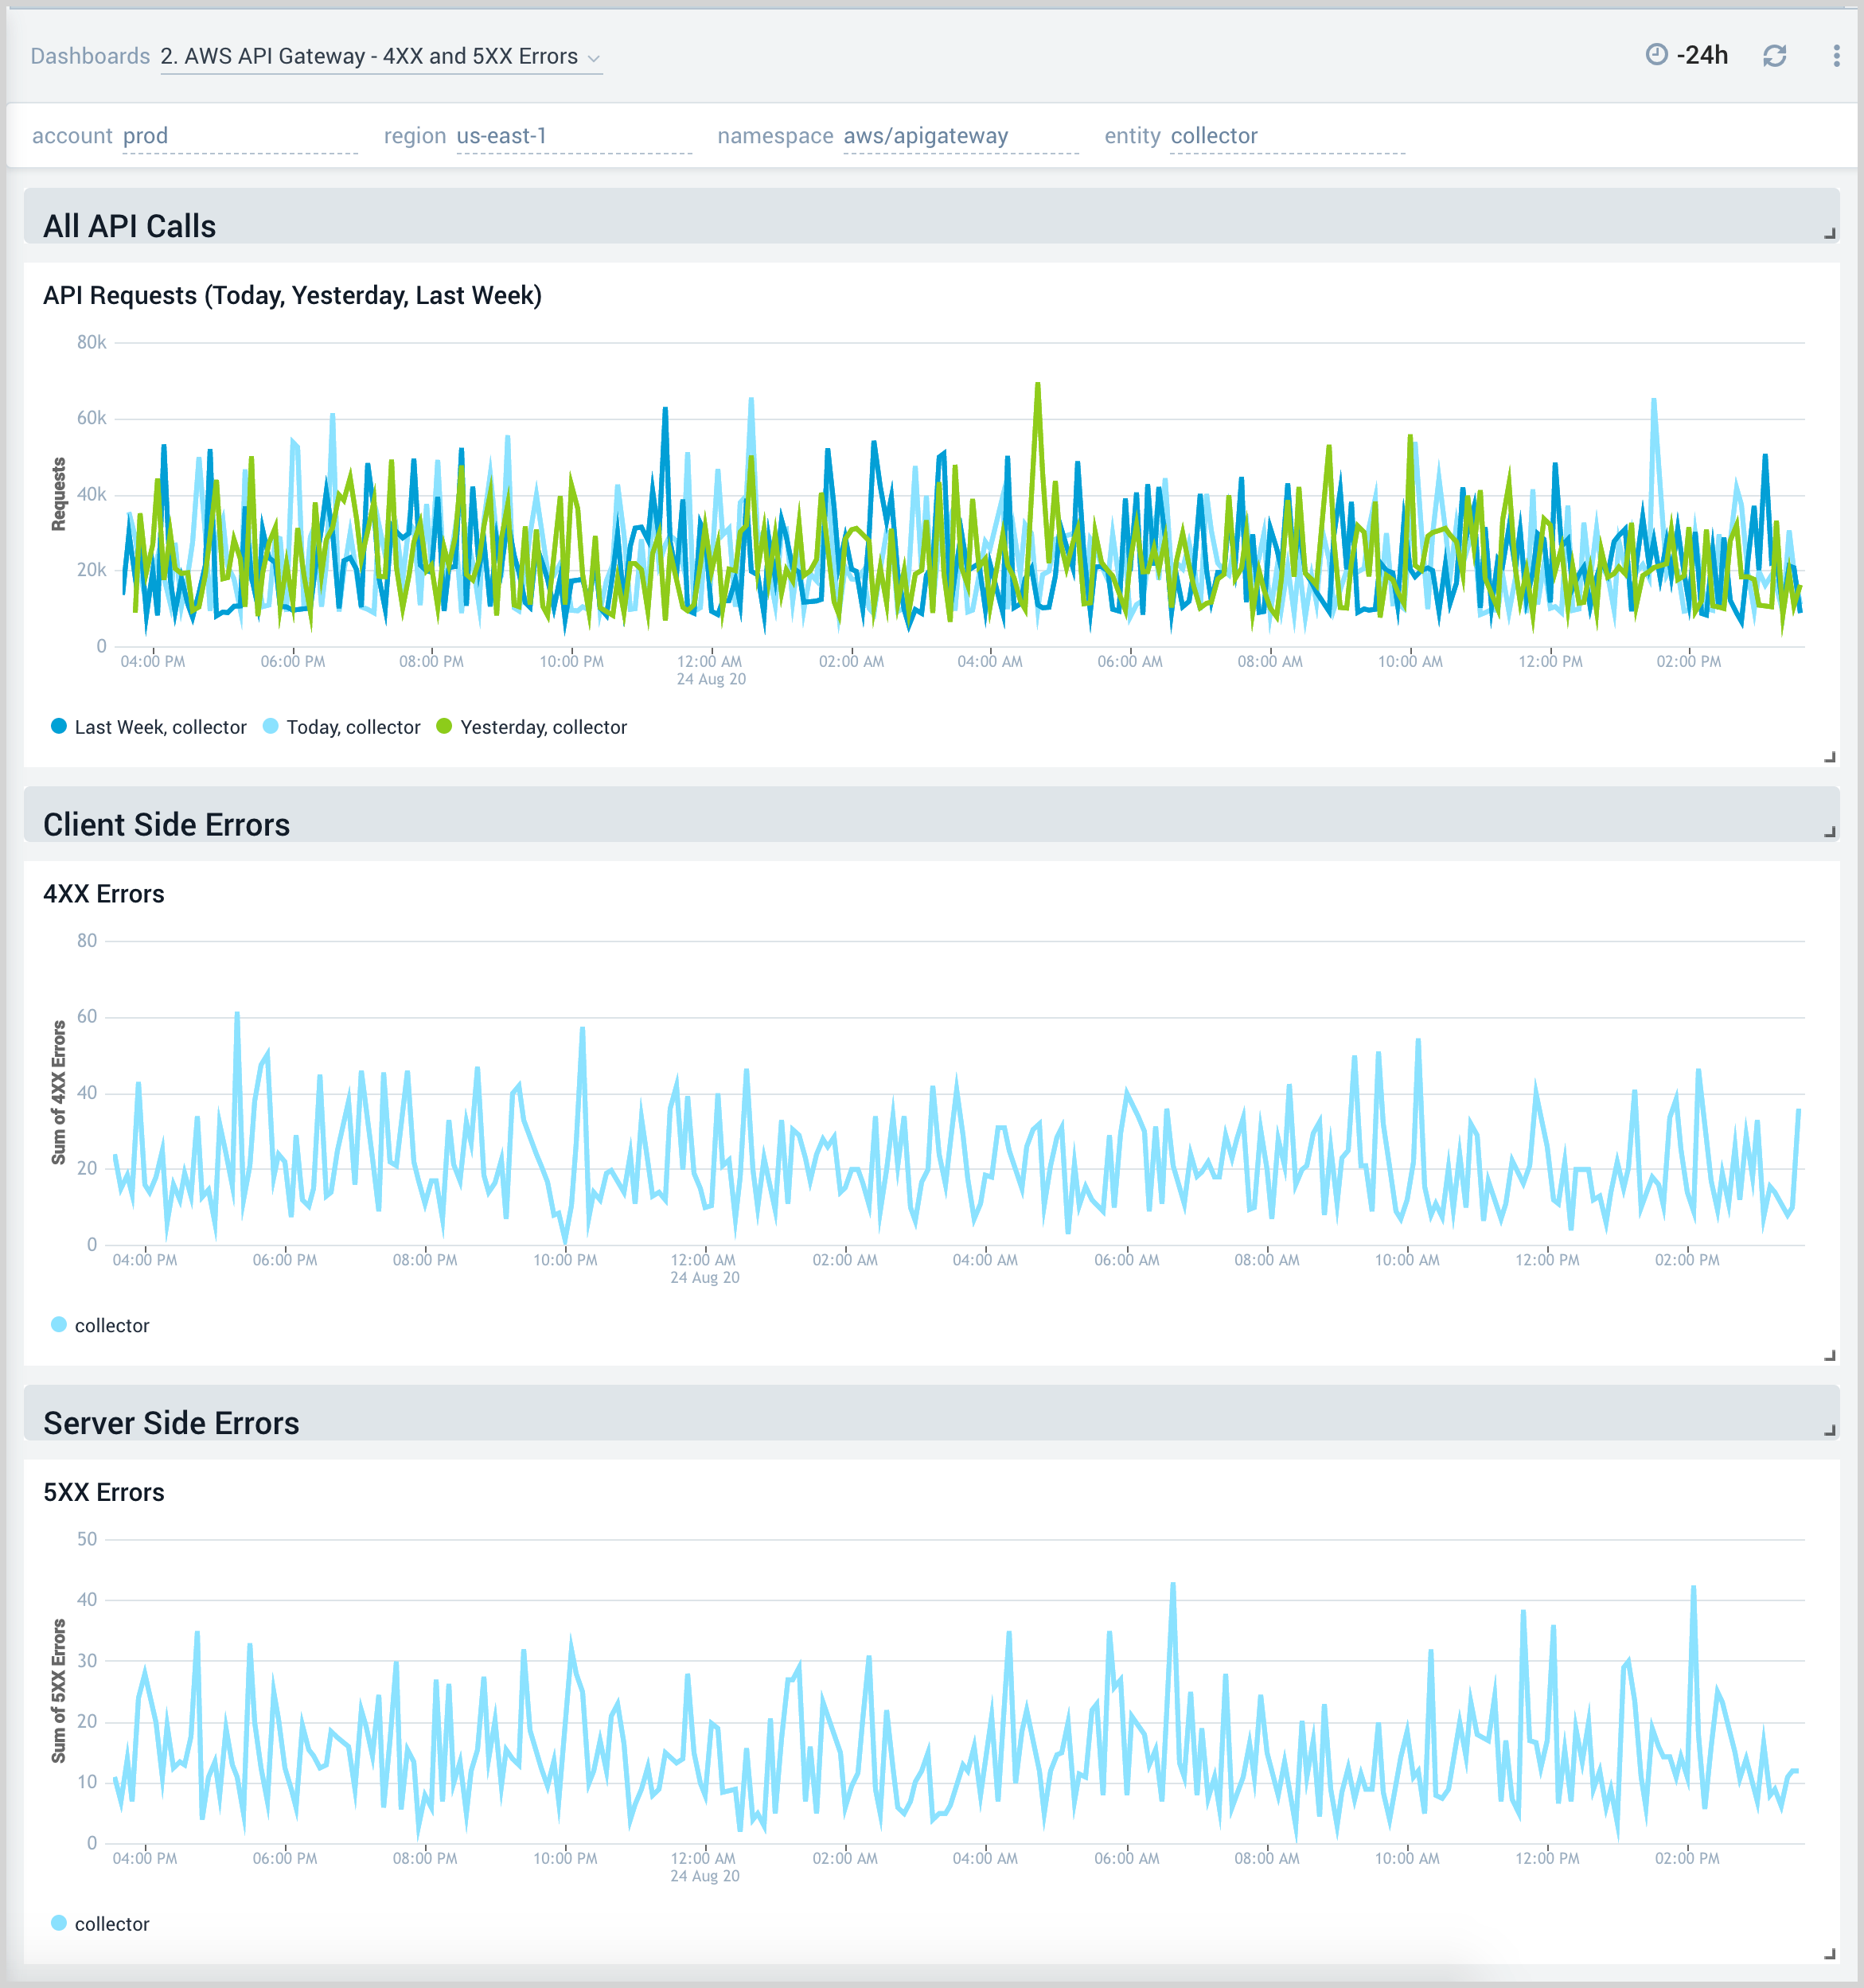
4xx and 5xx Errors
AWS API Gateway - 4xx and 5xx Errors dashboard provides insights into API Gateway HTTP 4xx and 5xx code errors throughout your infrastructure, including API requests, client-side errors, and server-side errors.
Use this dashboard to:
- Monitor the total number of client-side errors based on API name and region across your infrastructure.
- Monitor the total number of server-side errors based on API name and region across your infrastructure.
- Compare API requests made today, yesterday, and last week to identify any abnormal deviations.
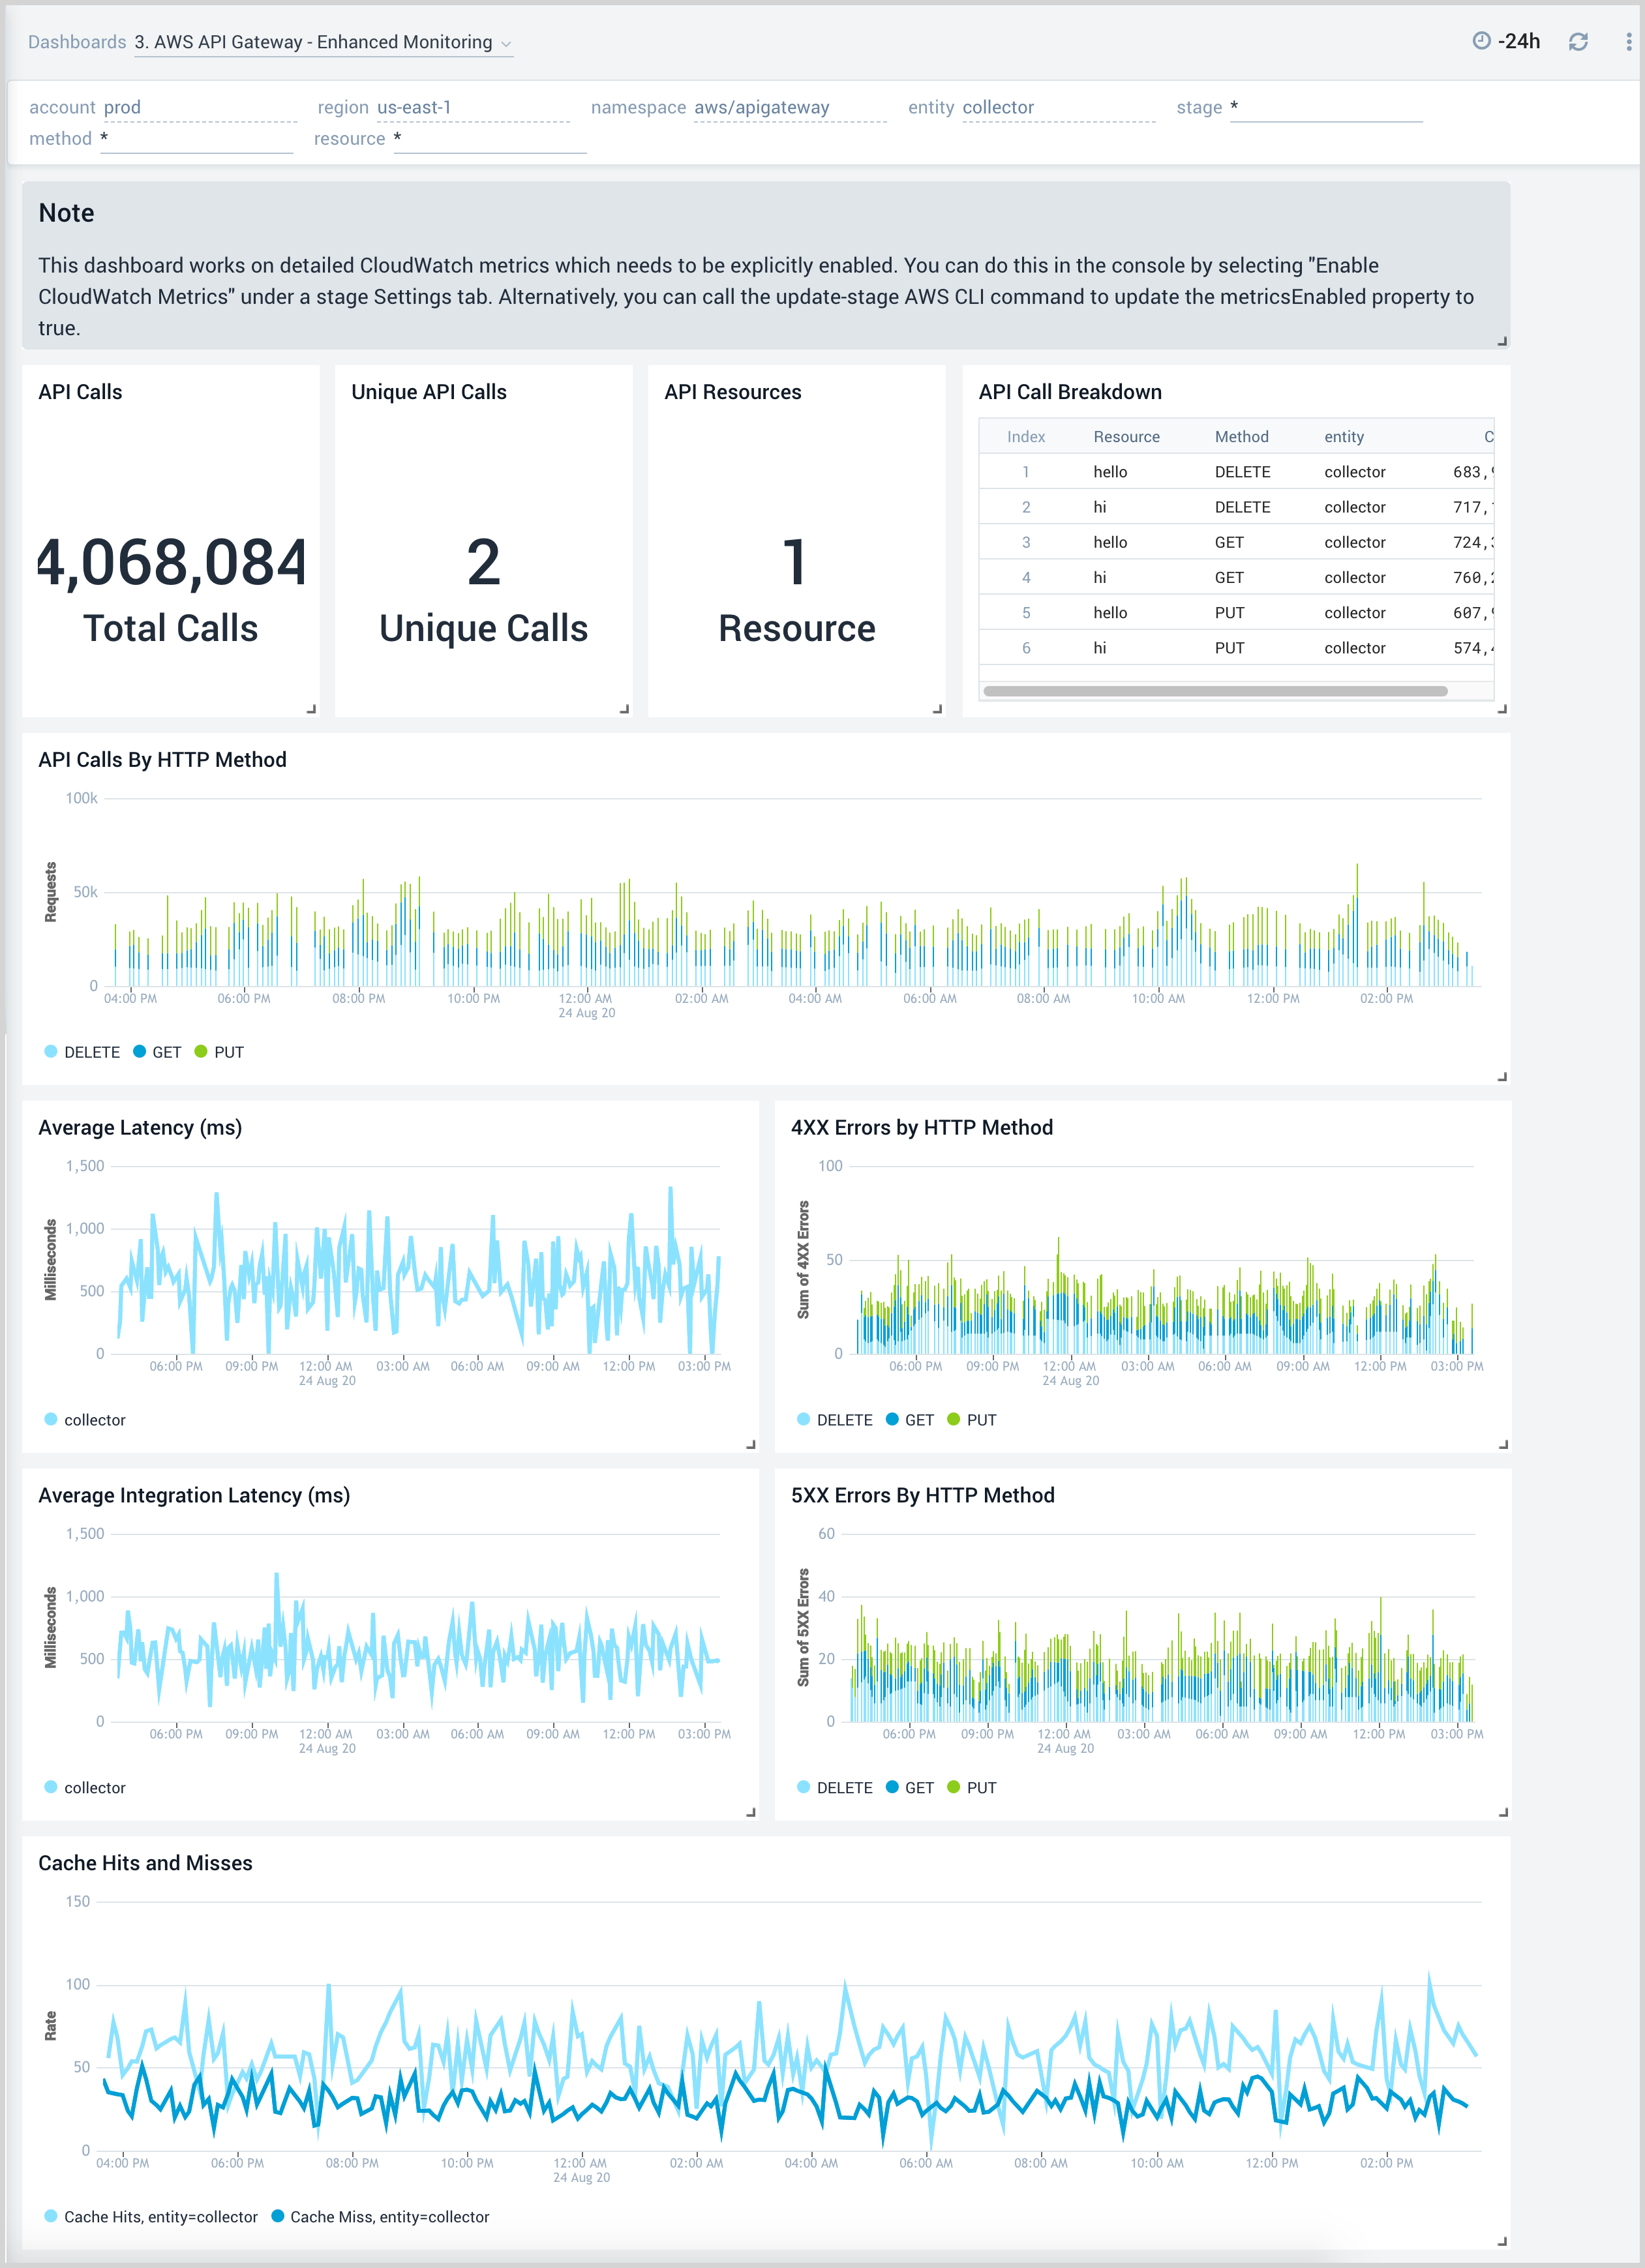
Enhanced Monitoring
AWS API Gateway - Enhanced Monitoring dashboard provides detailed insights into API Gateway performance throughout your infrastructure, including the number and types of API calls, API resources, cache hits and misses, latency averages, and errors by HTTP method.
For your API Gateway instance to send enhanced metrics, you must have explicitly enabled detailed CloudWatch metrics. You can do this in the AWS management console under a Stage settings tab by selecting Enable CloudWatch Metrics. Alternatively, you can call the update-stage AWS CLI command to update the metricsEnabled property to True.
Use this dashboard to:
- Monitor API Gateways across your infrastructure using enhanced metrics.
- Monitor API requests trend by resource, HTTP method, and deployment stage.
- Monitor API cache hits and misses to optimize cache capacities to achieve the desired performance.
- Monitor the overall responsiveness of API calls and the backend origin servers.
- Monitor the total number of client-side and server-side errors based on HTTP methods.