AWS RDS Metrics
Amazon Relational Database Service (Amazon RDS) is optimized to run in the cloud. The RDS Amazon Web Service (AWS) simplifies the setup, operation, and scaling of relational database instances for use in applications throughout your infrastructure.
The Sumo Logic App for AWS Observability RDS Metrics provides visibility into your Amazon Relational Database Service (RDS) metrics collected with a CloudWatch metrics source. Preconfigured app dashboards allow you to monitor your RDS system's overview, CPU, memory, storage, network transmit and receive throughput, read and write operations, database connection count, disk queue depth, and more.
Metrics Types
Amazon RDS sends metrics to CloudWatch for each active database instance every minute. Monitoring is enabled by default. For more information, see Monitoring Amazon RDS in the Amazon RDS User Guide. For details on collected metrics, see Amazon RDS Metrics and Dimensions.
Query Sample
Average CPU Utilization by Database Instance
_sourceCategory=Labs/AWS/RDS/Metric Namespace=aws/rds metric=CPUUtilization statistic=average account=*
region=* entity=* dbinstanceidentifier=* | avg by dbinstanceIdentifier, entity
AWS RDS Dashboards
This page provides examples and descriptions for each of the AWS Observability RDS pre-configured dashboards.
Amazon Relational Database Service (Amazon RDS) is optimized to run in the cloud. The RDS Amazon Web Service (AWS) simplifies the setup, operation, and scaling of relational database instances for use in applications throughout your infrastructure.
The Sumo Logic AWS Observability RDS dashboards provide visibility into the performance and operations of your Amazon Relational Database Service (RDS). Preconfigured dashboards allow you to monitor critical metrics of your RDS cluster including CPU, memory, storage, network transmits and receive throughput, read and write operations, database connection count, disk queue depth, and more. Audit activity dashboards help you keep monitor activities performed on your RDS infrastructure.
We highly recommend you view these dashboards in the Explore View of the AWS Observability solution.
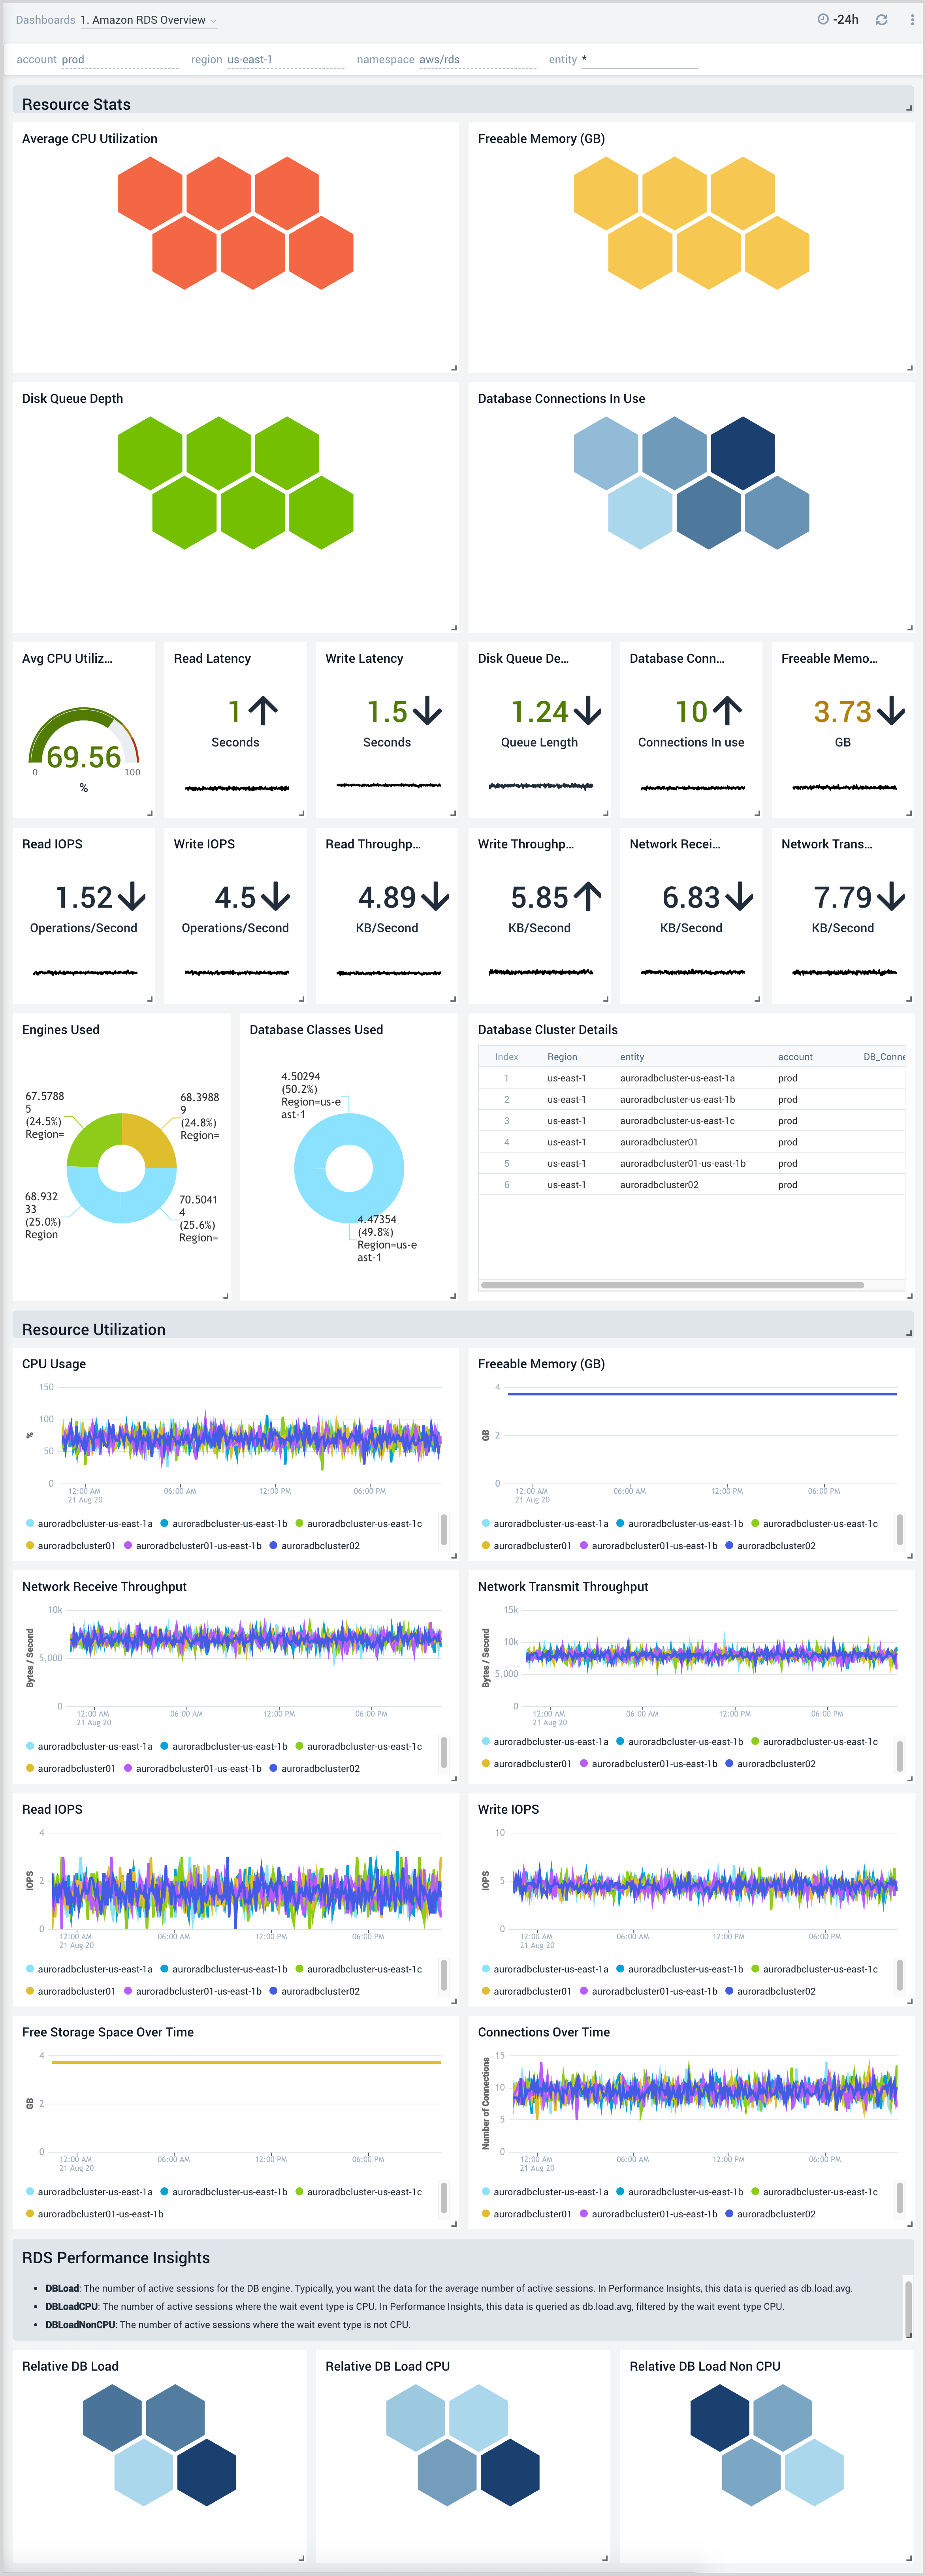
Overview
The Amazon RDS Overview dashboard provides insights into RDS resource statistics and utilization throughout your infrastructure, including CPU, memory, latency, storage, and network throughput.
Use this dashboard to:
- Get a high-level overview of your Amazon RDS infrastructure.
- Quickly identify problems in resource utilization.
- Monitor database performance insights such as relative CPU Load, non-CPU load, and overall database load.
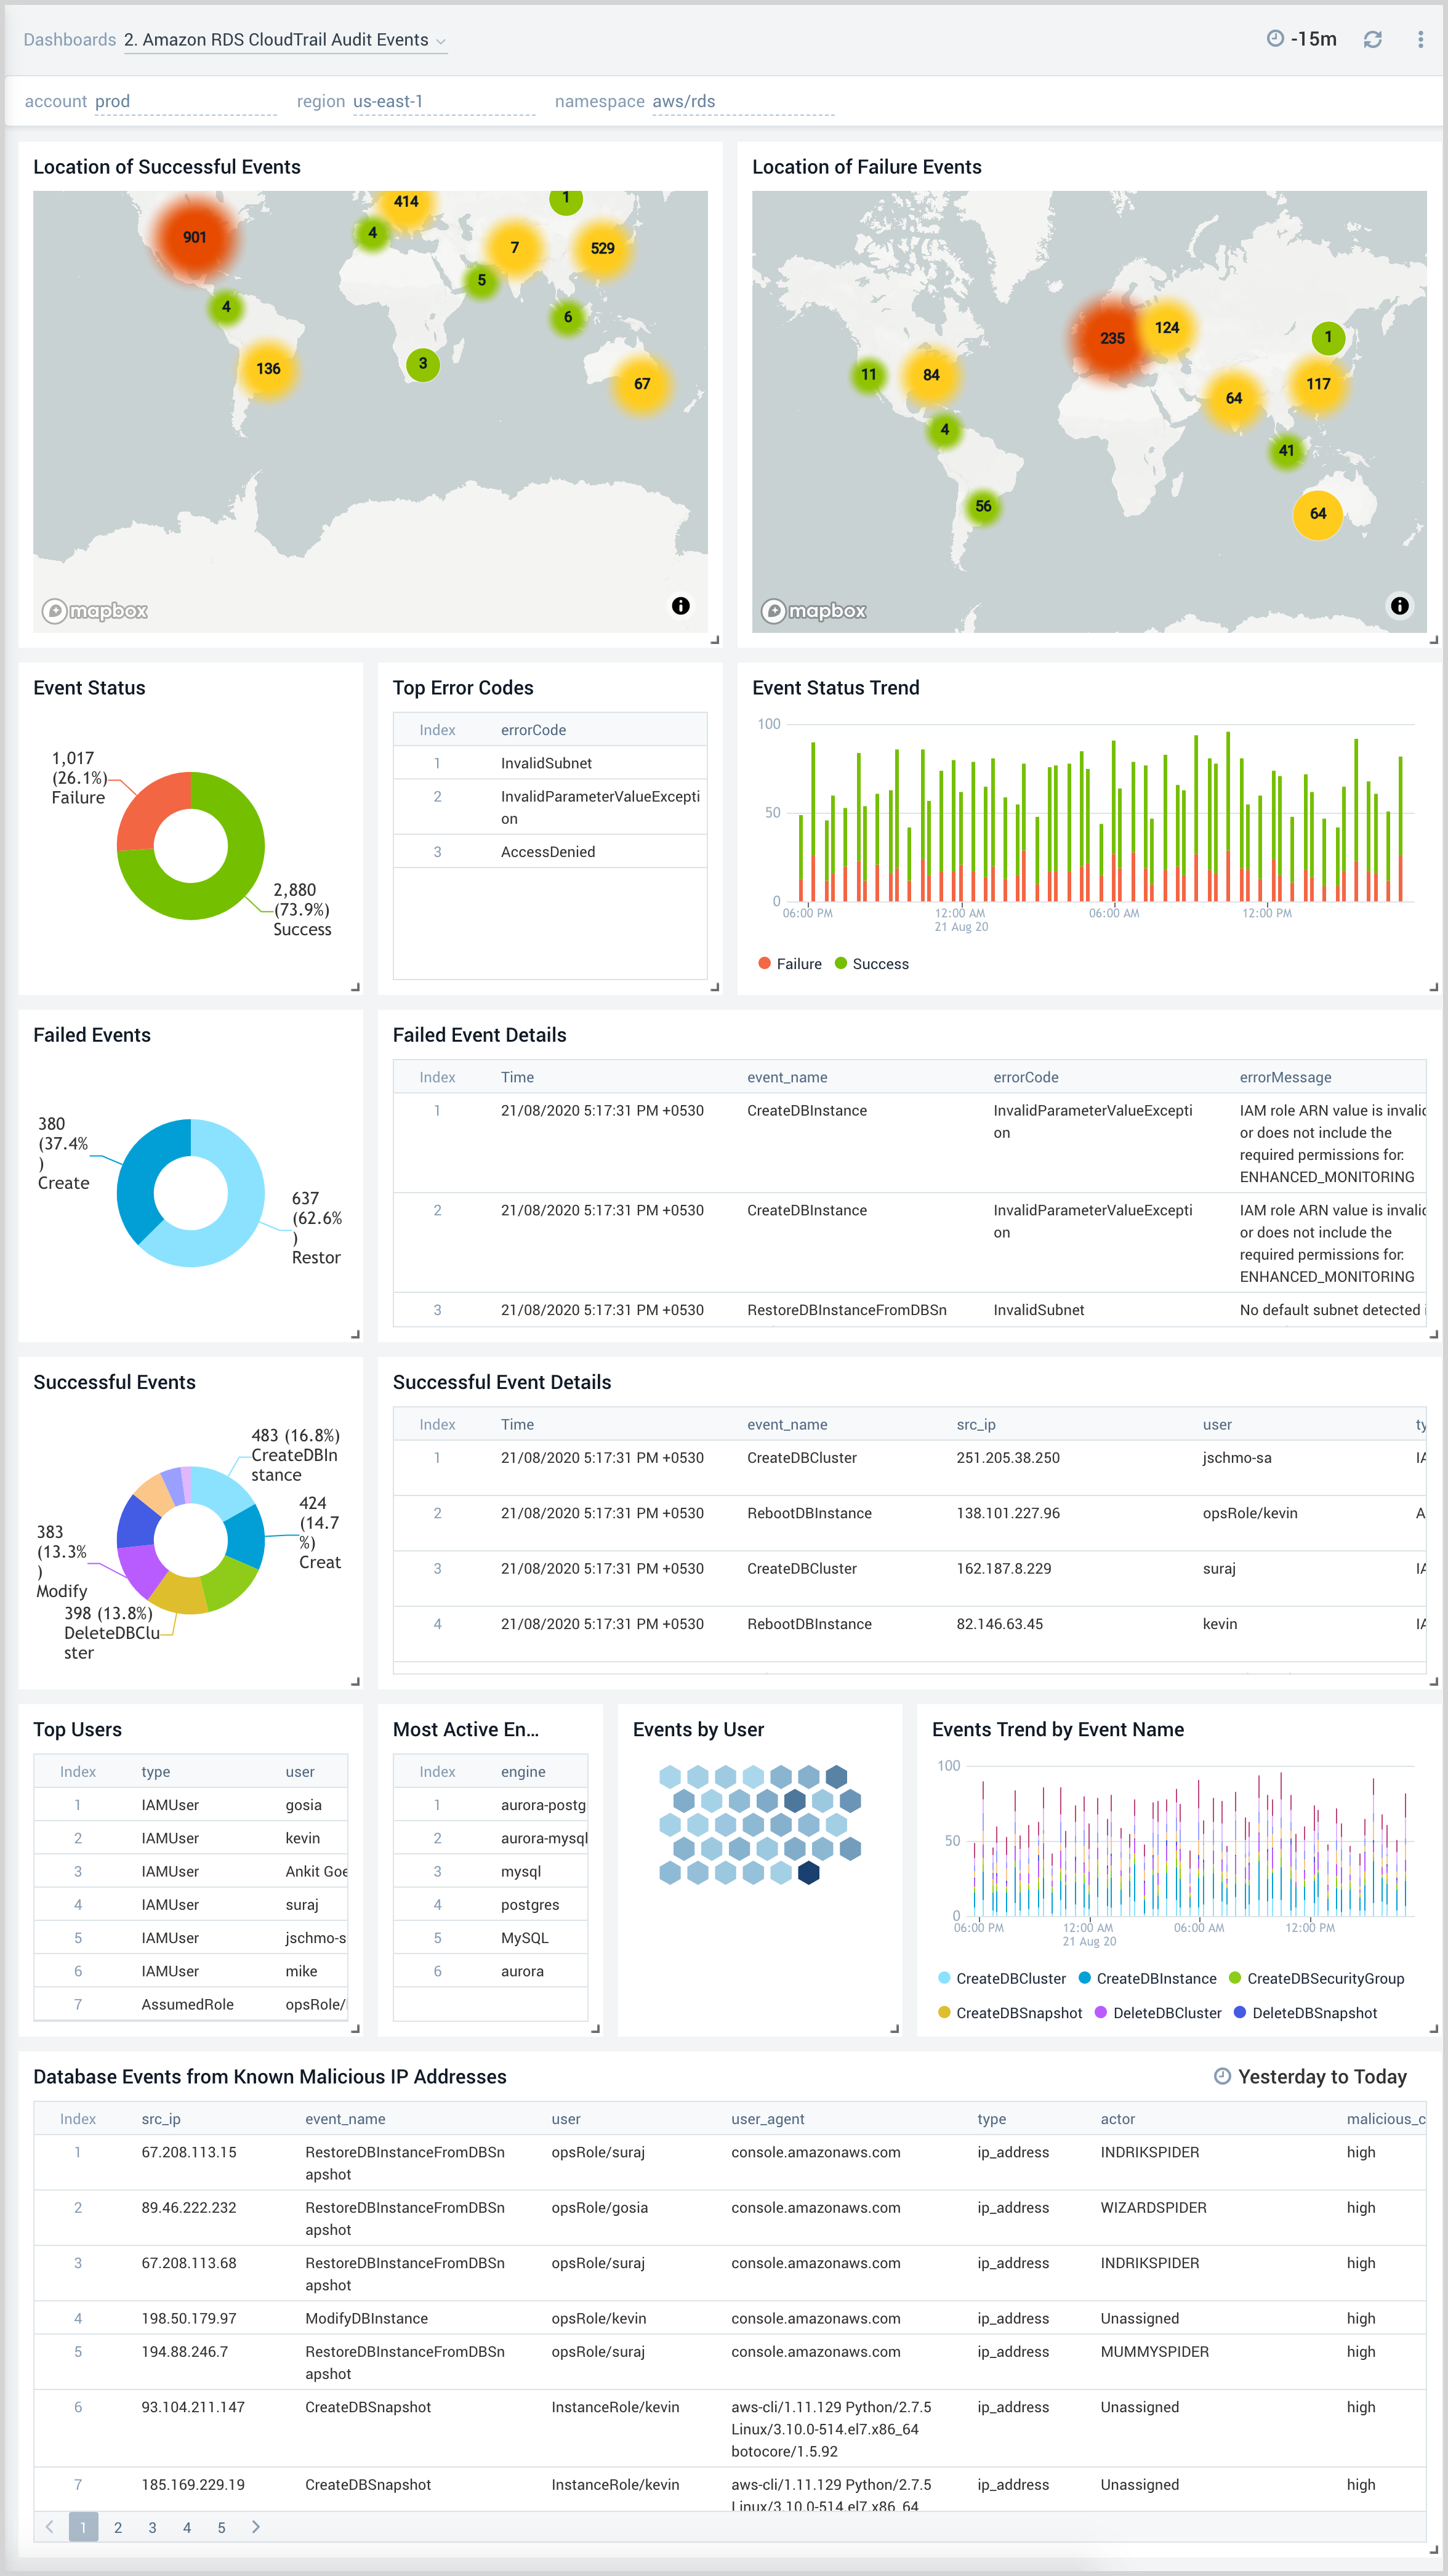
CloudTrail Audit Events
The Amazon RDS CloudTrail Audit Events dashboard provides insights into audit events of your database clusters.
Use this dashboard to:
- Monitor Amazon RDS related audit logs using CloudTrail Events.
- Monitor locations of successful and failed Amazon RDS user activity events.
- Monitor most active users working on RDS infrastructure, database engines used in the infrastructure, and various events invoked on RDS clusters.
- Monitor requests from malicious IP addresses using Sumo Logic’s Threat Intel.
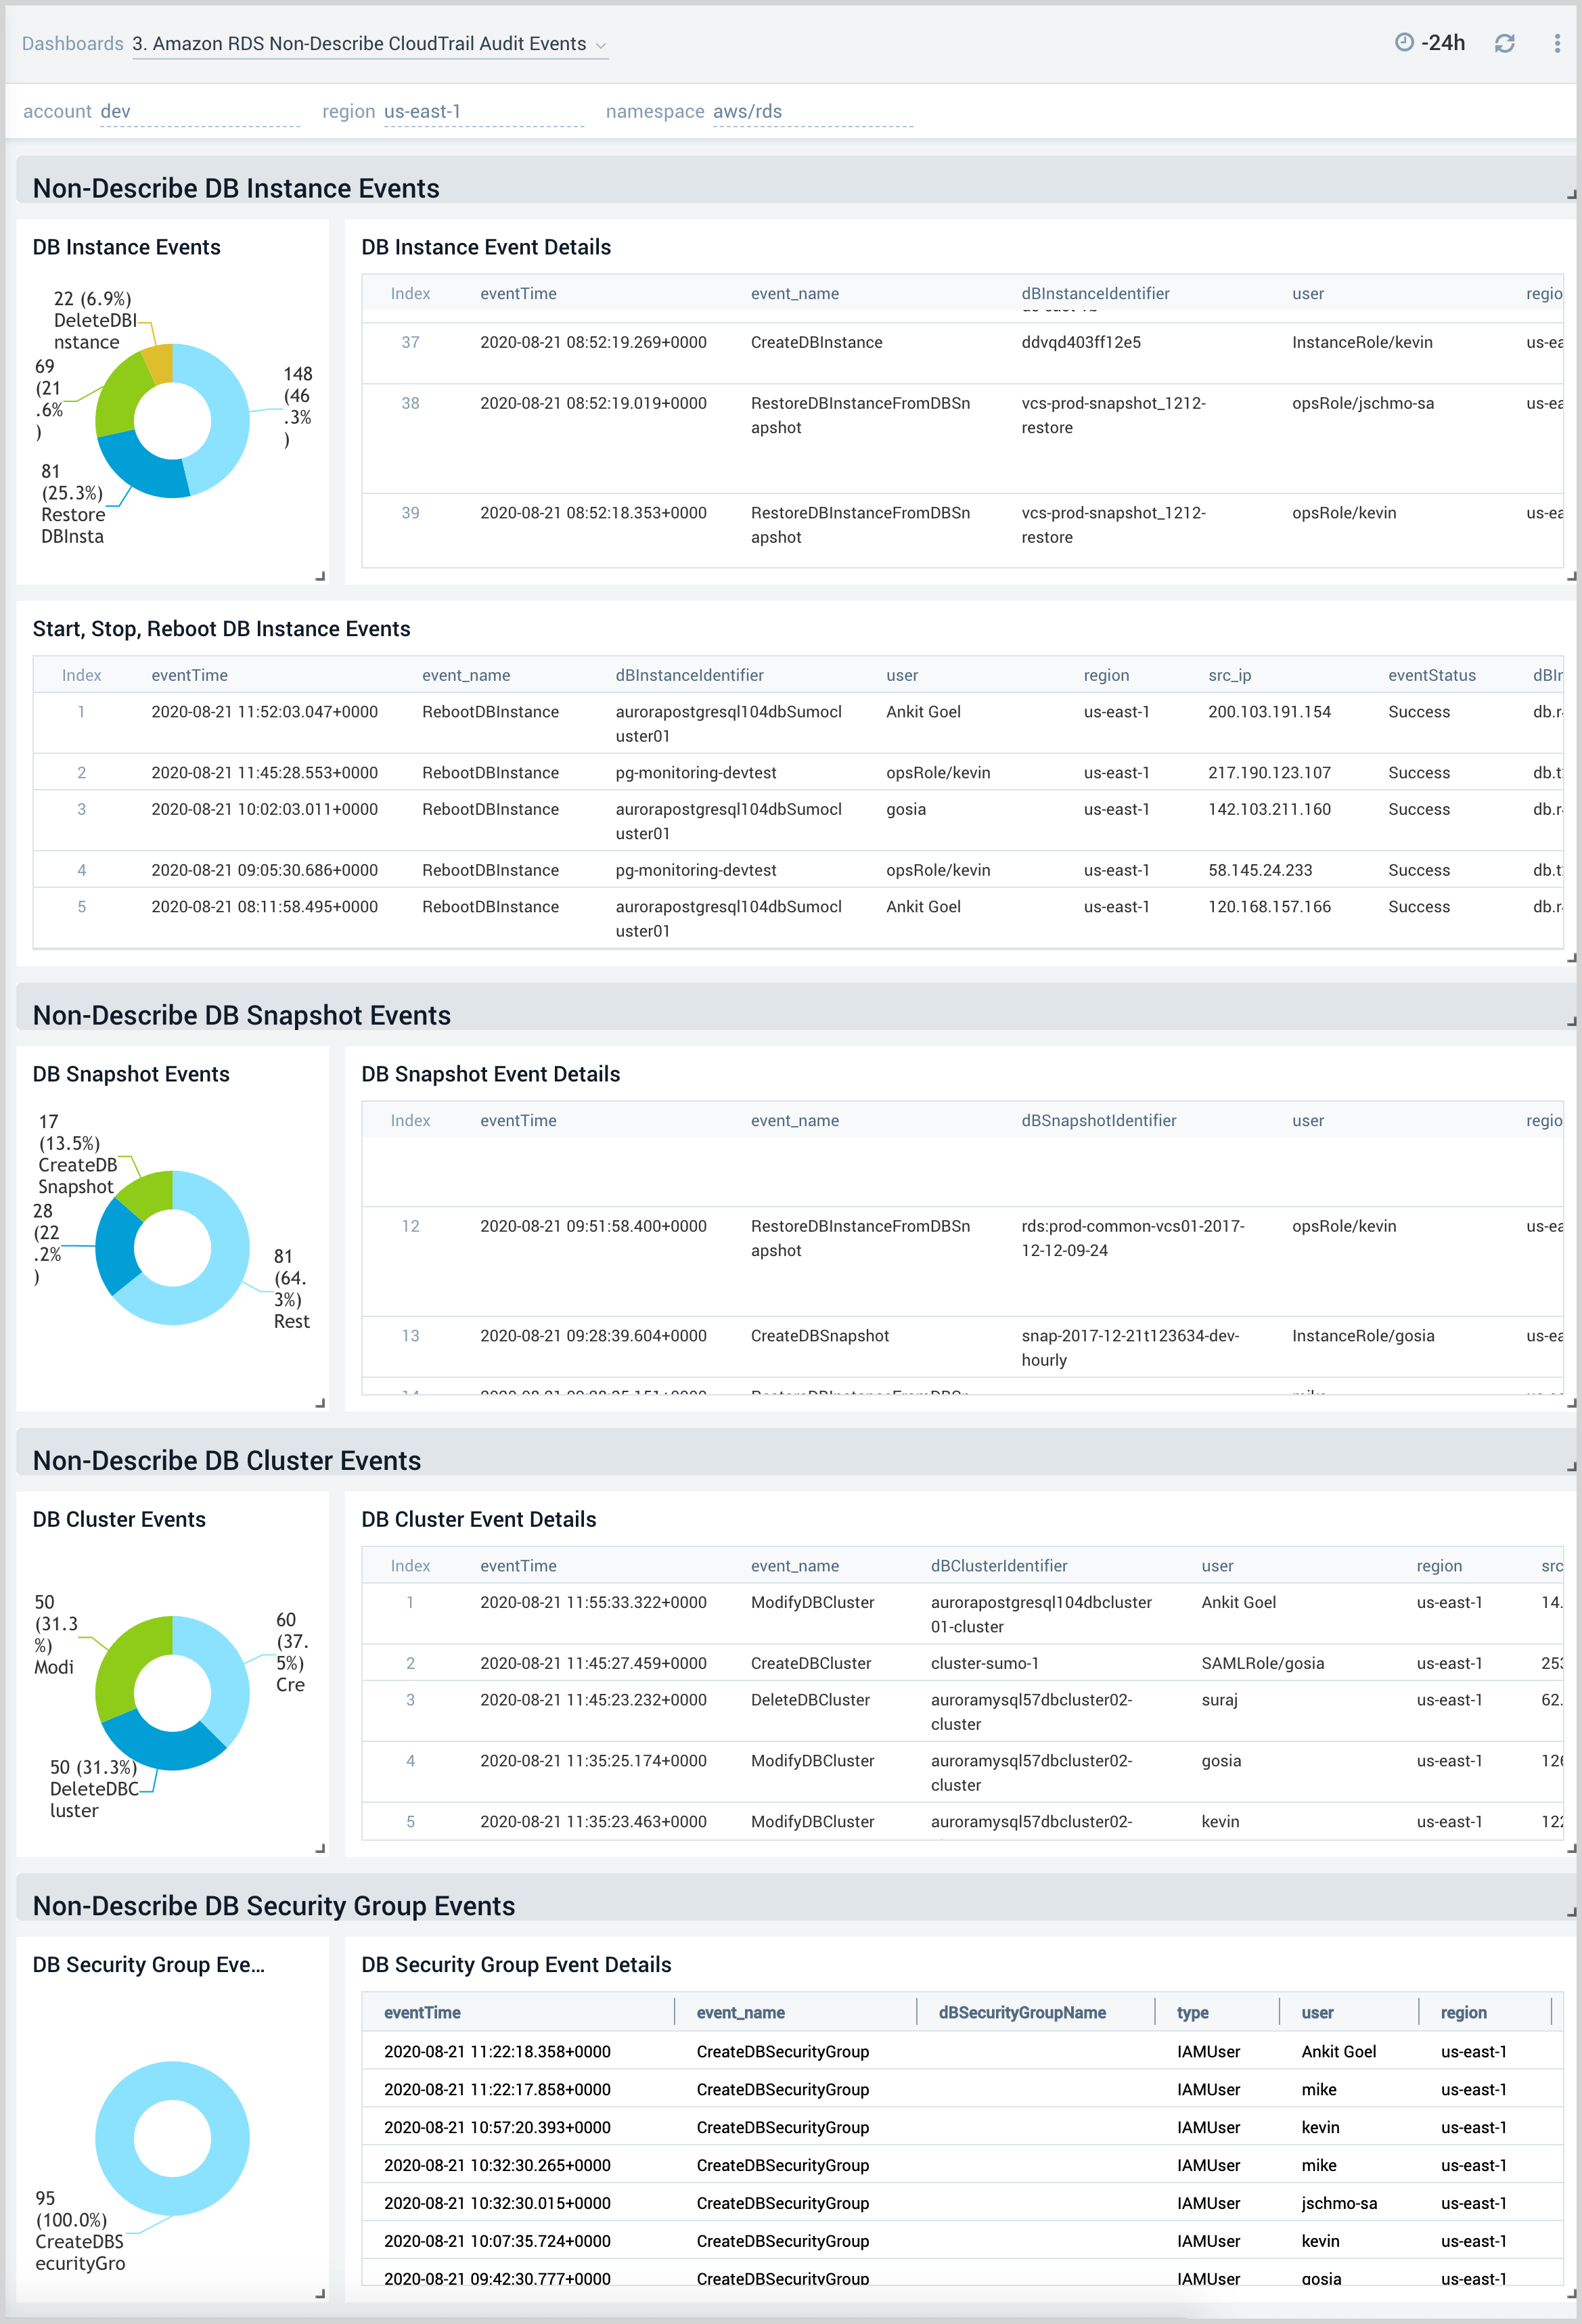
Non-Describe CloudTrail Audit Events
The Amazon RDS Non-Describe CloudTrail Audit Events dashboard provides statistical and detailed insights into Non-Describe DB Instance, SnapShot, Cluster, Security group events.
Use this dashboard to:
- Monitor Amazon RDS related non-describe audit logs using CloudTrail Events.
- Monitor and track create, delete, update, start, stop, reboot type of events on RDS instances.
- Monitor and track create, delete, modify, start, stop, reboot type of events on RDS clusters.
- Monitor and track snapshot related events performed on RDS instances.
- Monitor and track changes to security groups associated with your RDS infrastructure.
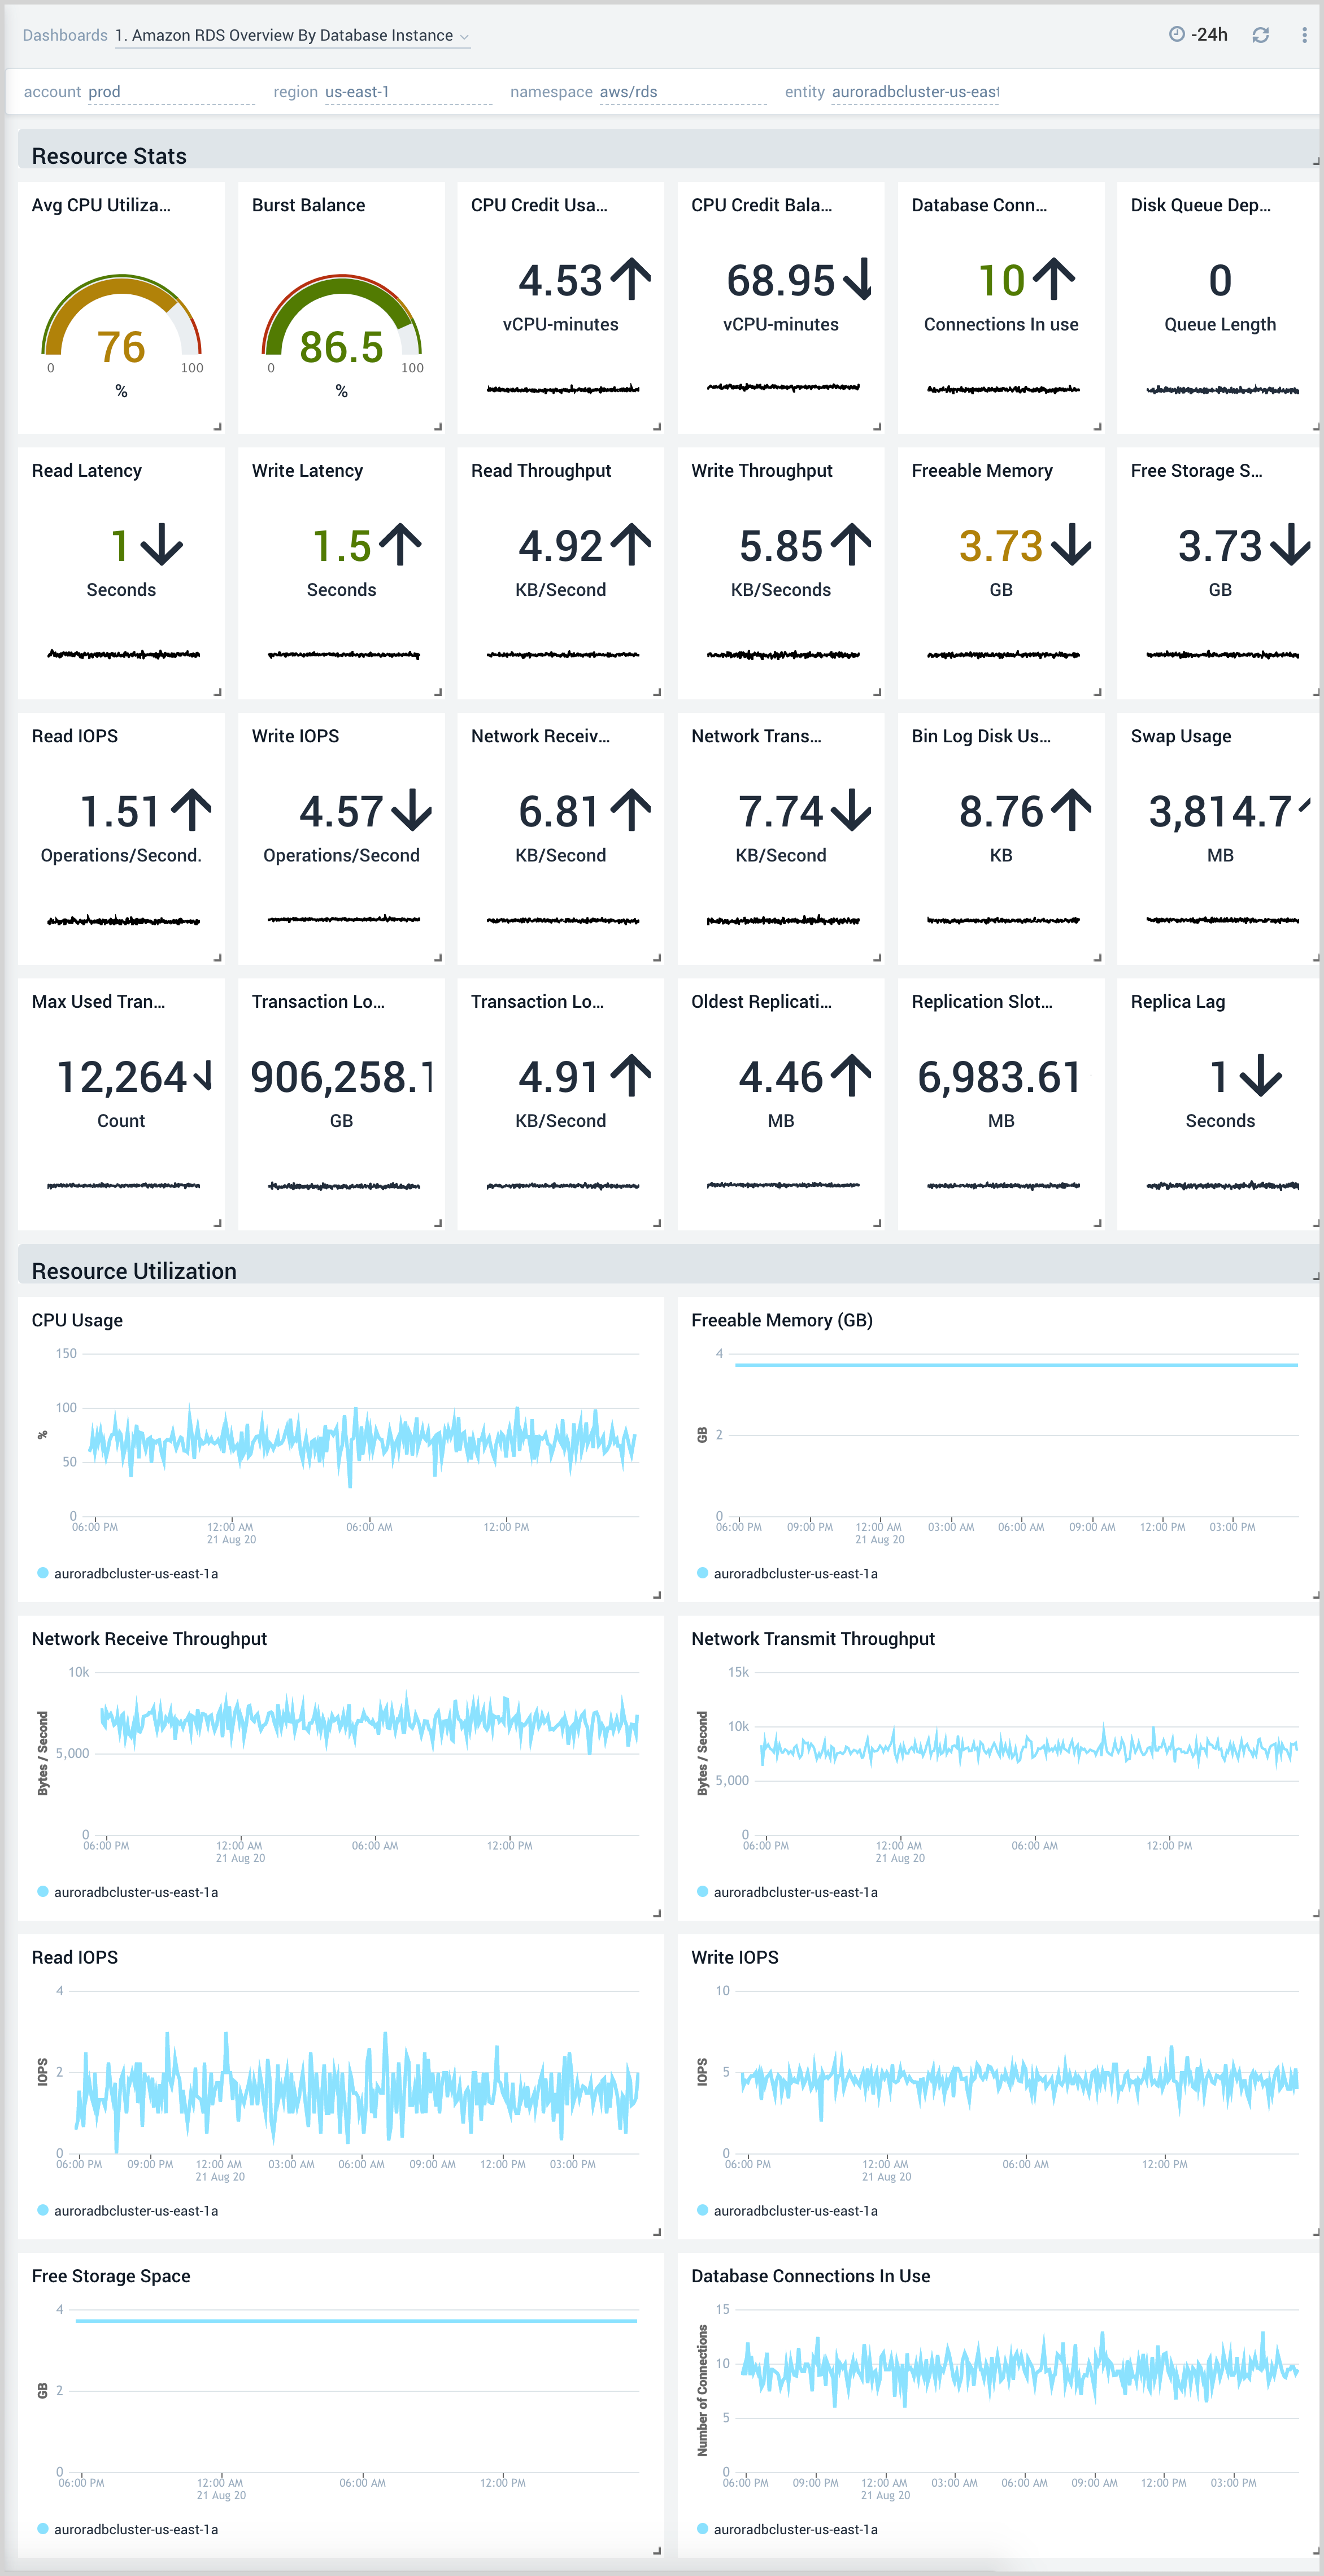
Overview By Database Instance
The Amazon RDS Overview By Database Instance dashboard provides insights into resource statistics and utilization per database instance throughout your infrastructure. Panels display data for CPU, memory, latency, storage, and network throughput per database instance.
Use this dashboard to:
- Quickly identify performance or resource utilization issues in your RDS clusters
- Monitor resource utilization with trend panels for CPU usage, available memory, network receive and transmit throughput, read and write IOPS, available free storage, and database connections across your Amazon RDS clusters and database instances.
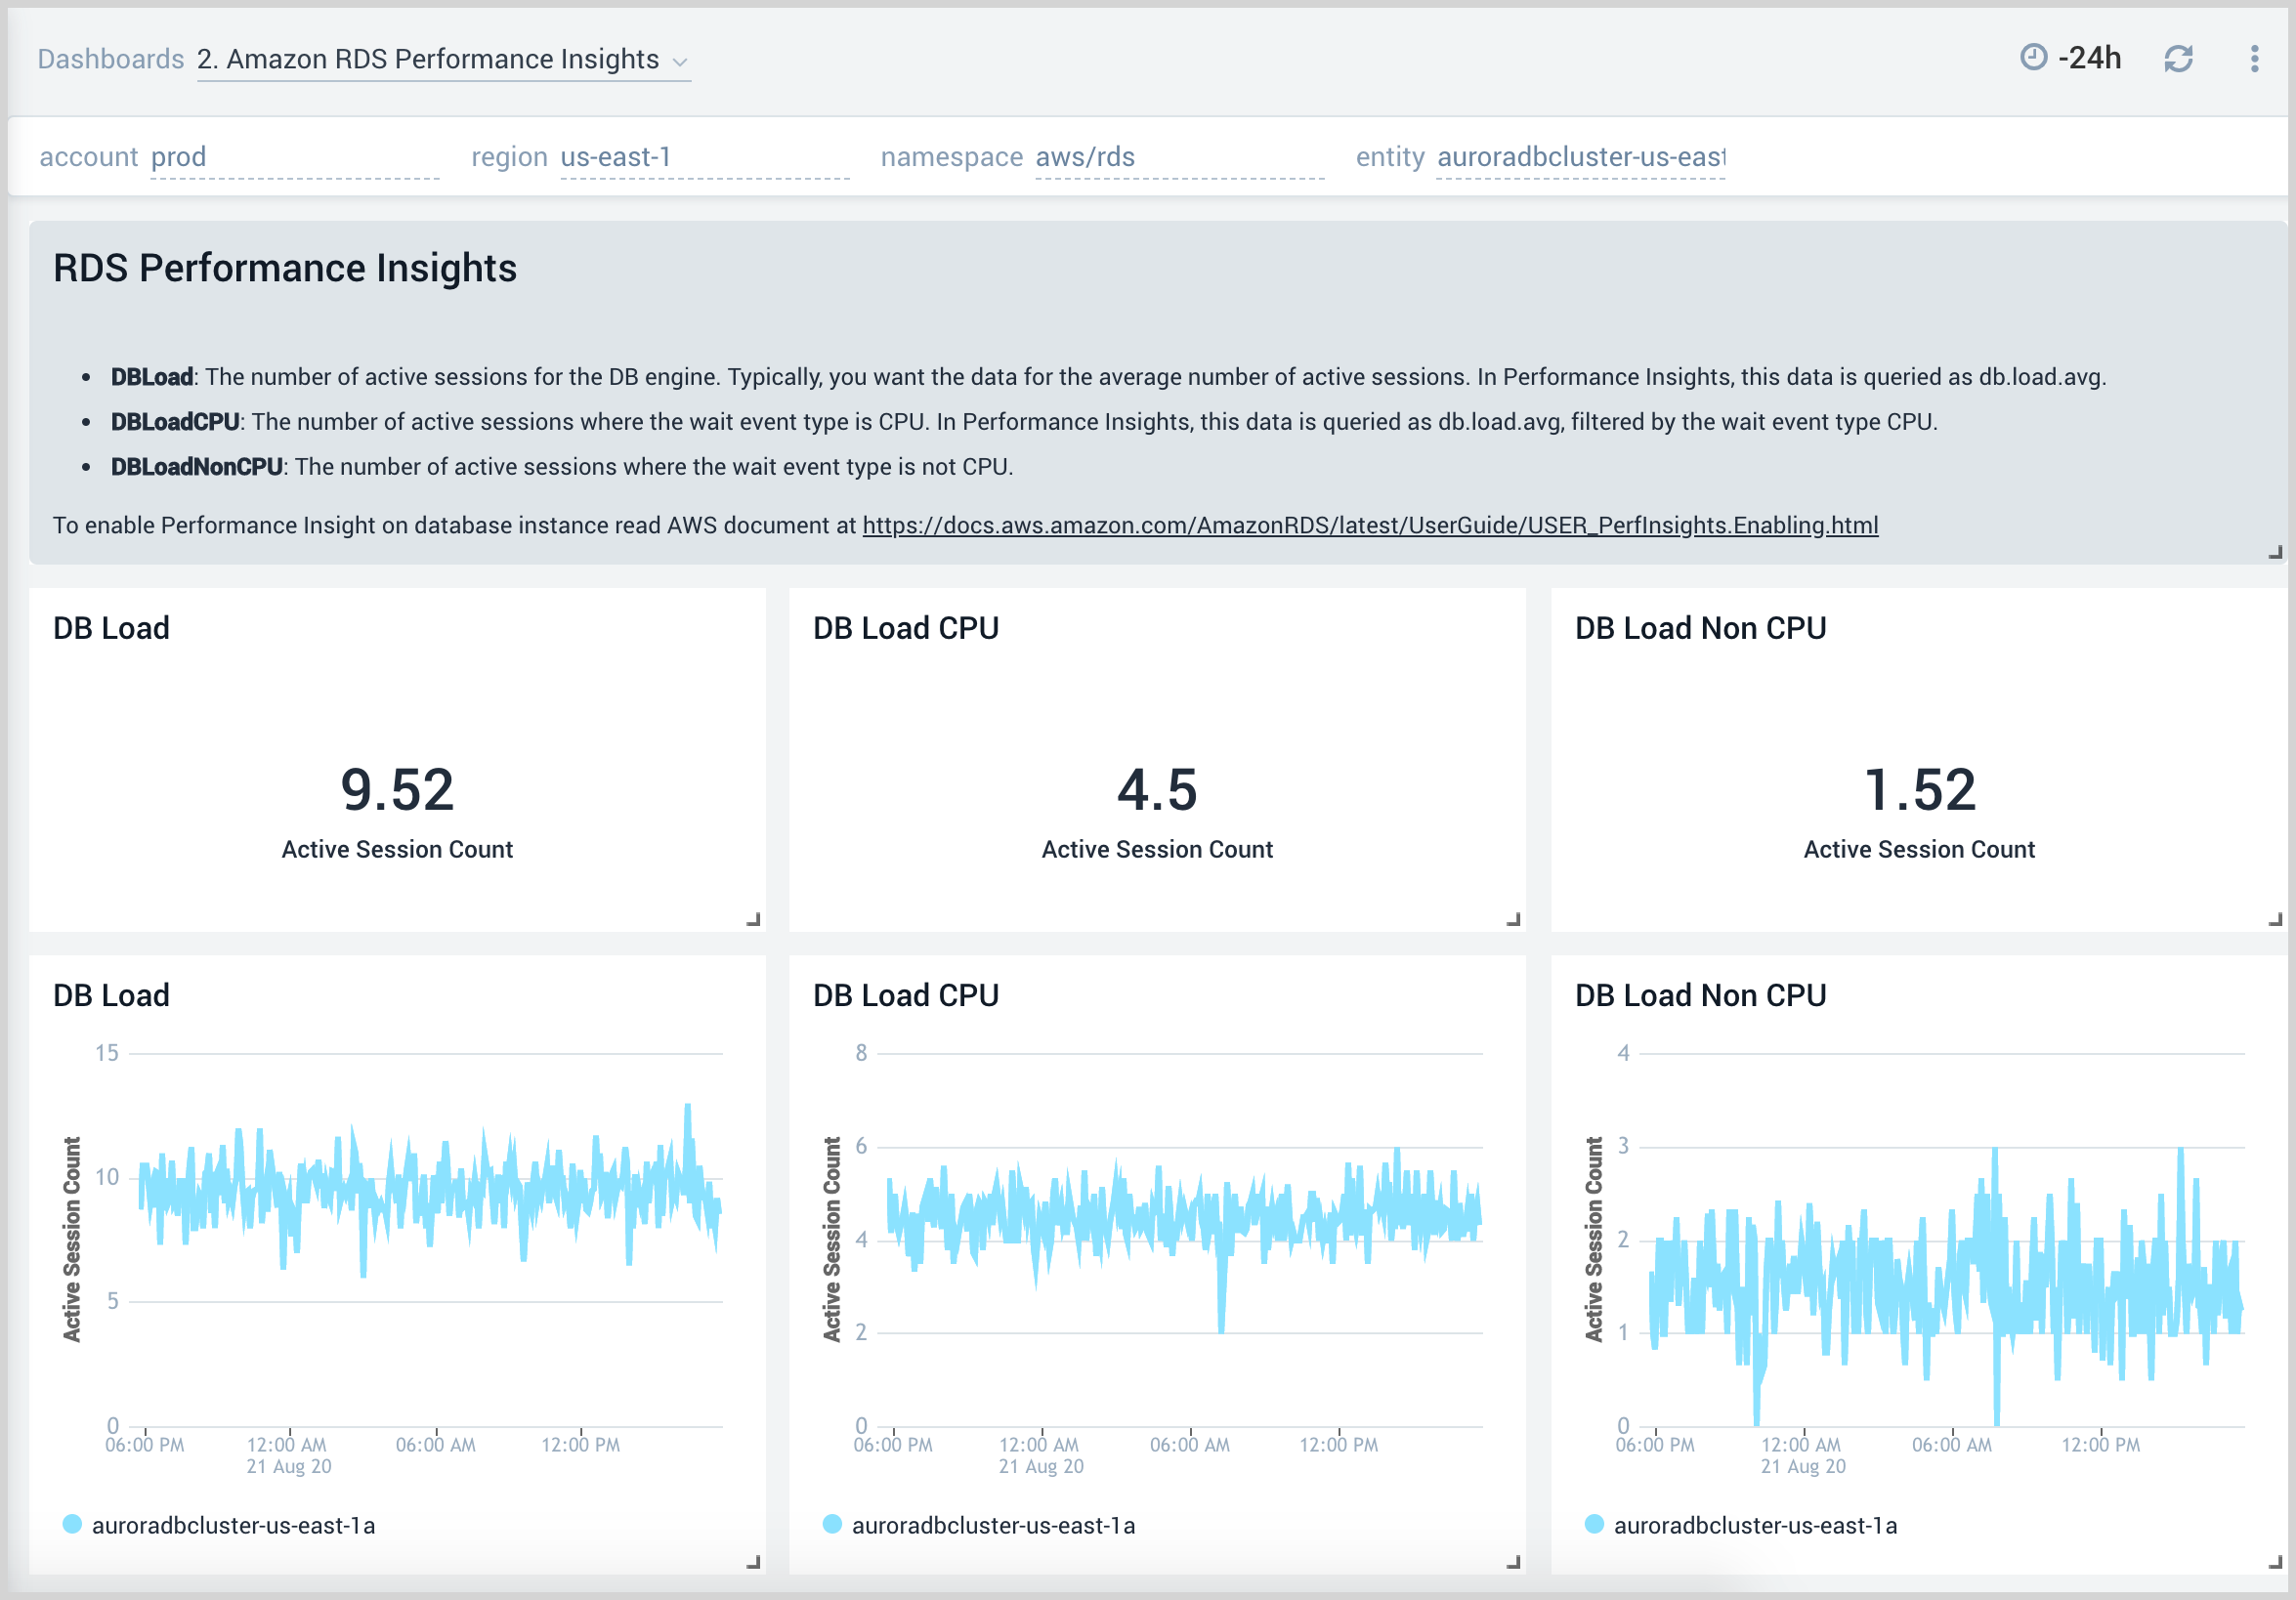
Performance Insights
The Amazon RDS Performance Insights dashboard provides intuitive performance data from throughout your RDS infrastructure across CPU load, non CPU load, active sessions, and performance trends.
Use this dashboard to:
- Monitor Amazon RDS DB instance loads to analyze and troubleshoot database performance.
- Identify when the CPU is overloaded, so you can throttle connections to the instance, tune SQL queries with a high CPU load, or consider a larger instance class to remedy the situation.
- Identify high and consistent instances of any wait state (Non-CPU Load) that indicate potential bottlenecks or resource contention issues that need to be resolved, which can be an issue even when the load doesn't exceed maximum CPU.
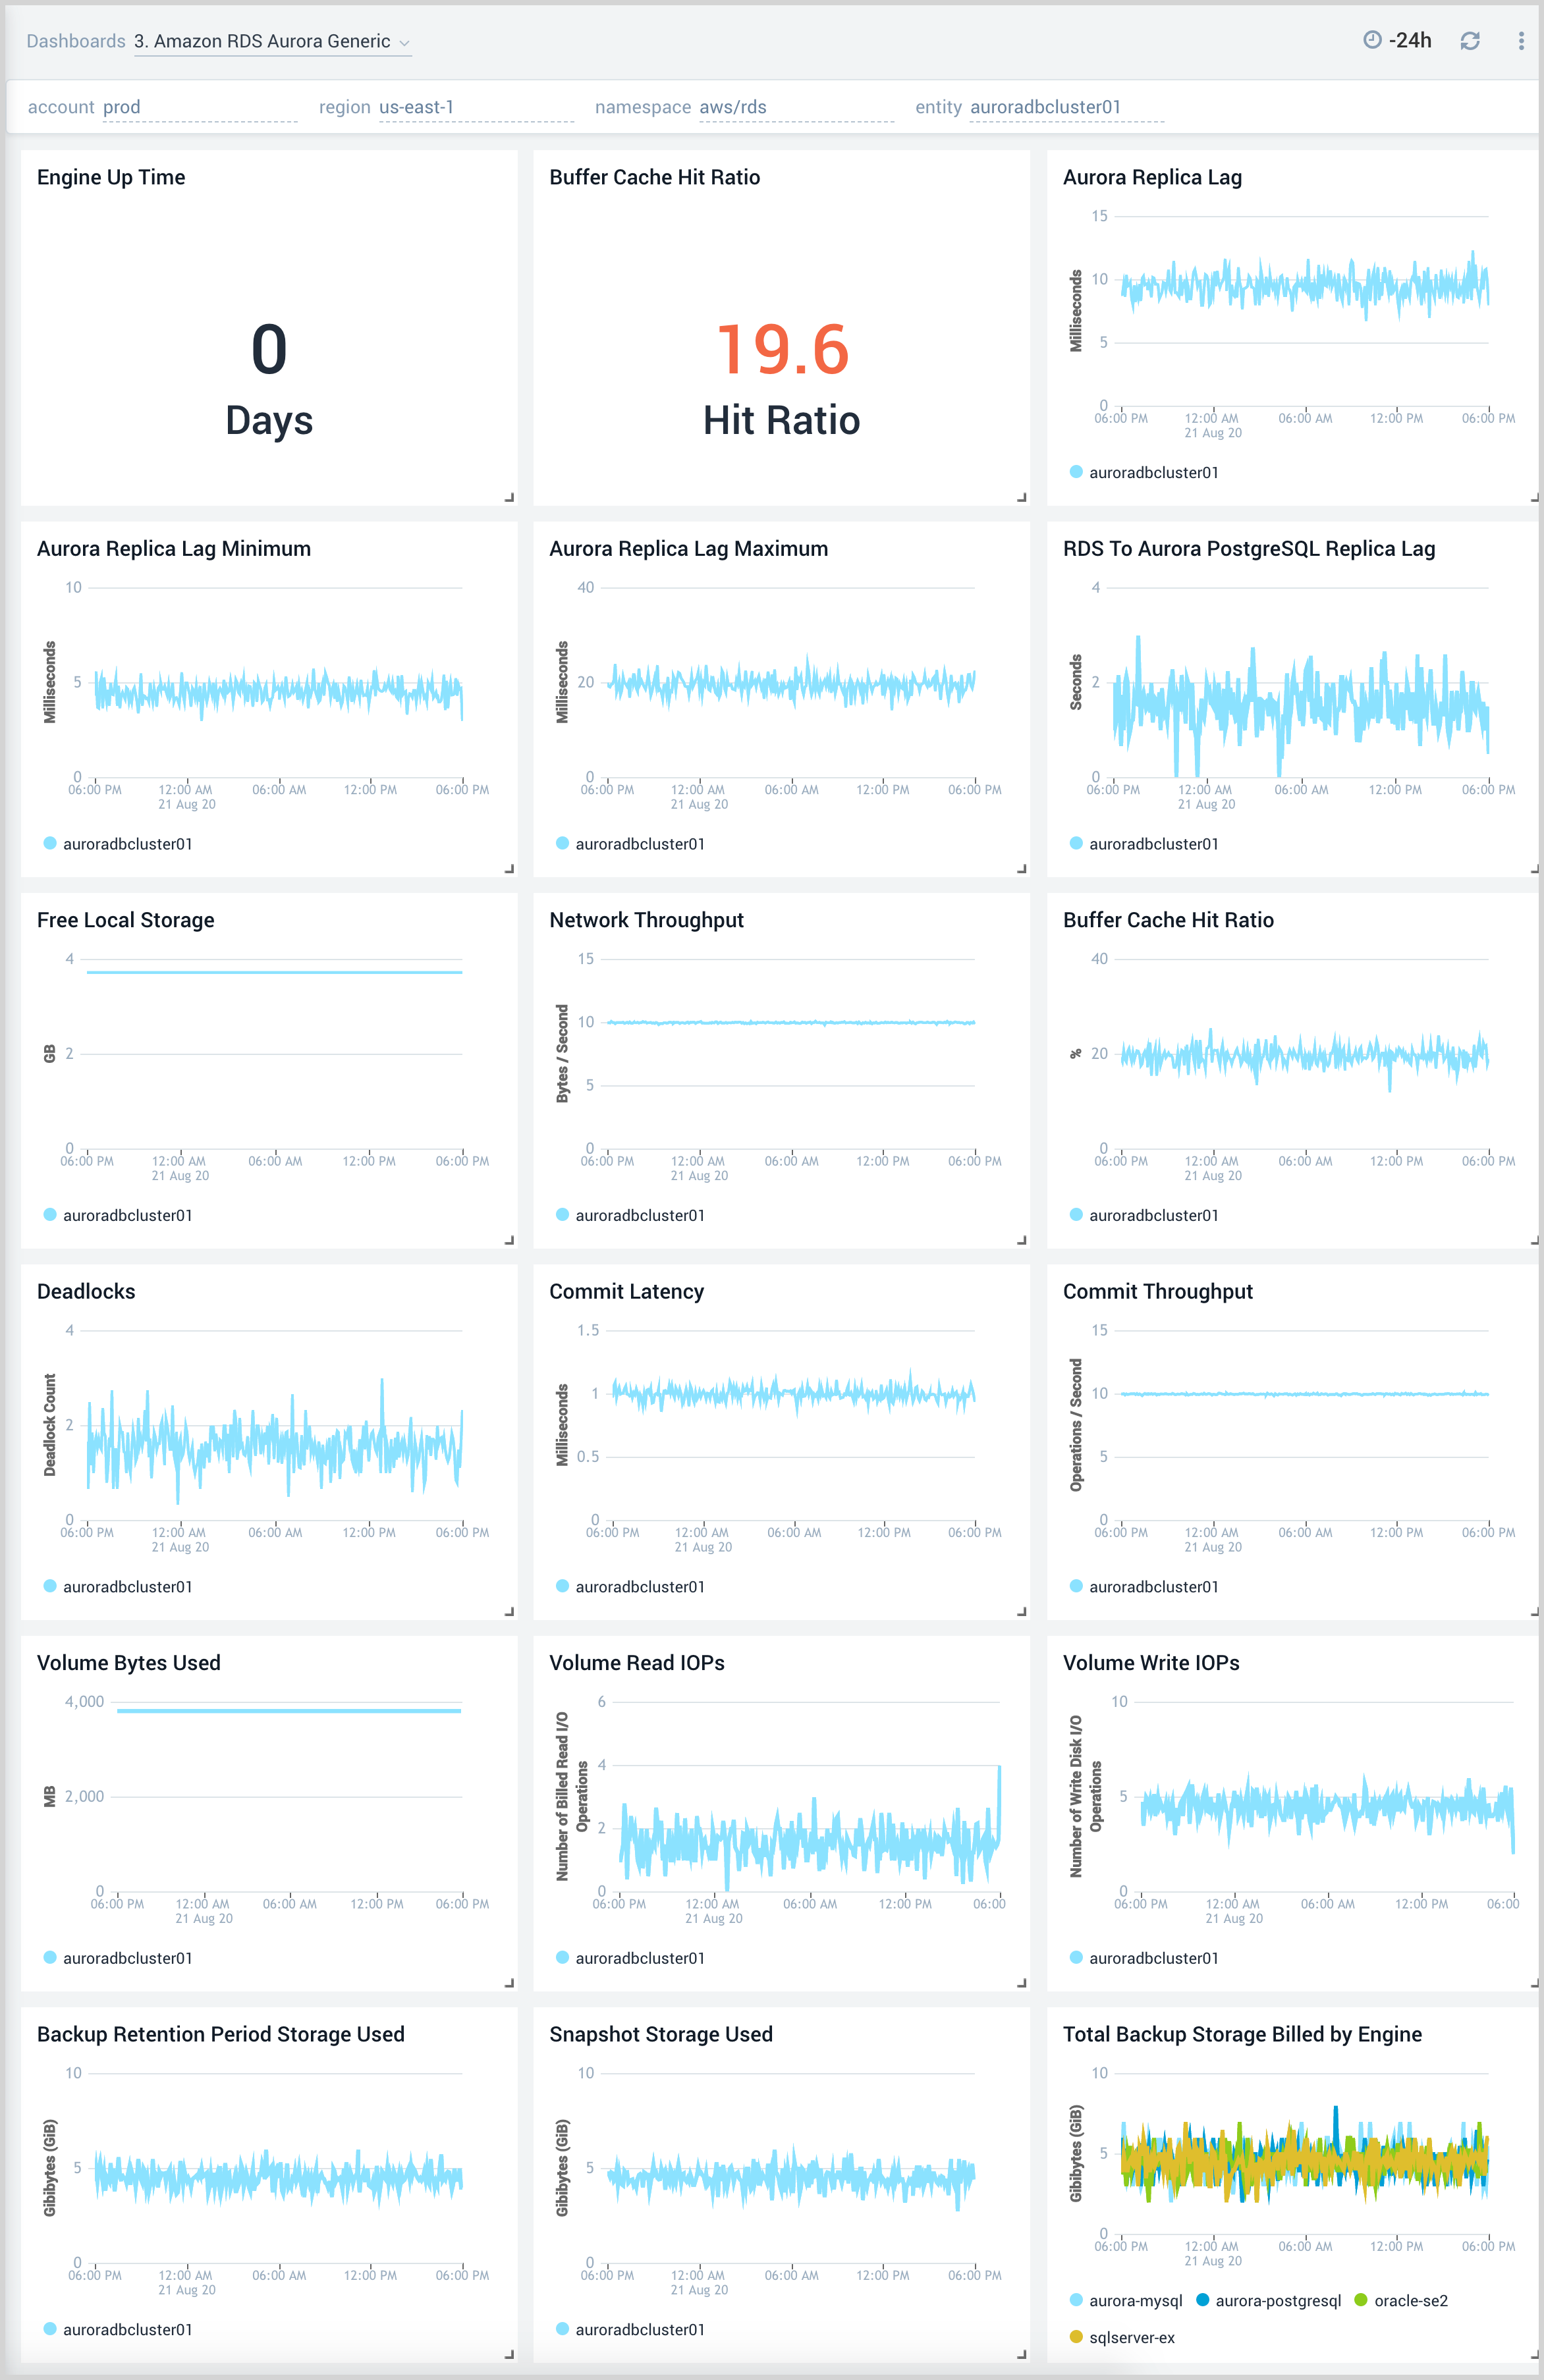
Aurora Generic
The Amazon RDS Aurora Generic dashboard provides generic AWS Aurora performance statistics across your infrastructure for uptime, replica lag, latency, network throughput, volume, and storage.
Use this dashboard to:
- Monitor common health and performance metrics of your RDS Amazon Aurora MySQL/PostgreSQL cluster.
- Monitor the lag when replicating updates from a primary instance.
- Monitor the uptime of a database instance.
- Monitor the amount of storage used to ensure monitor costs.
- Monitor the percentage of requests that are served by the buffer cache to identify potential performance optimizations.
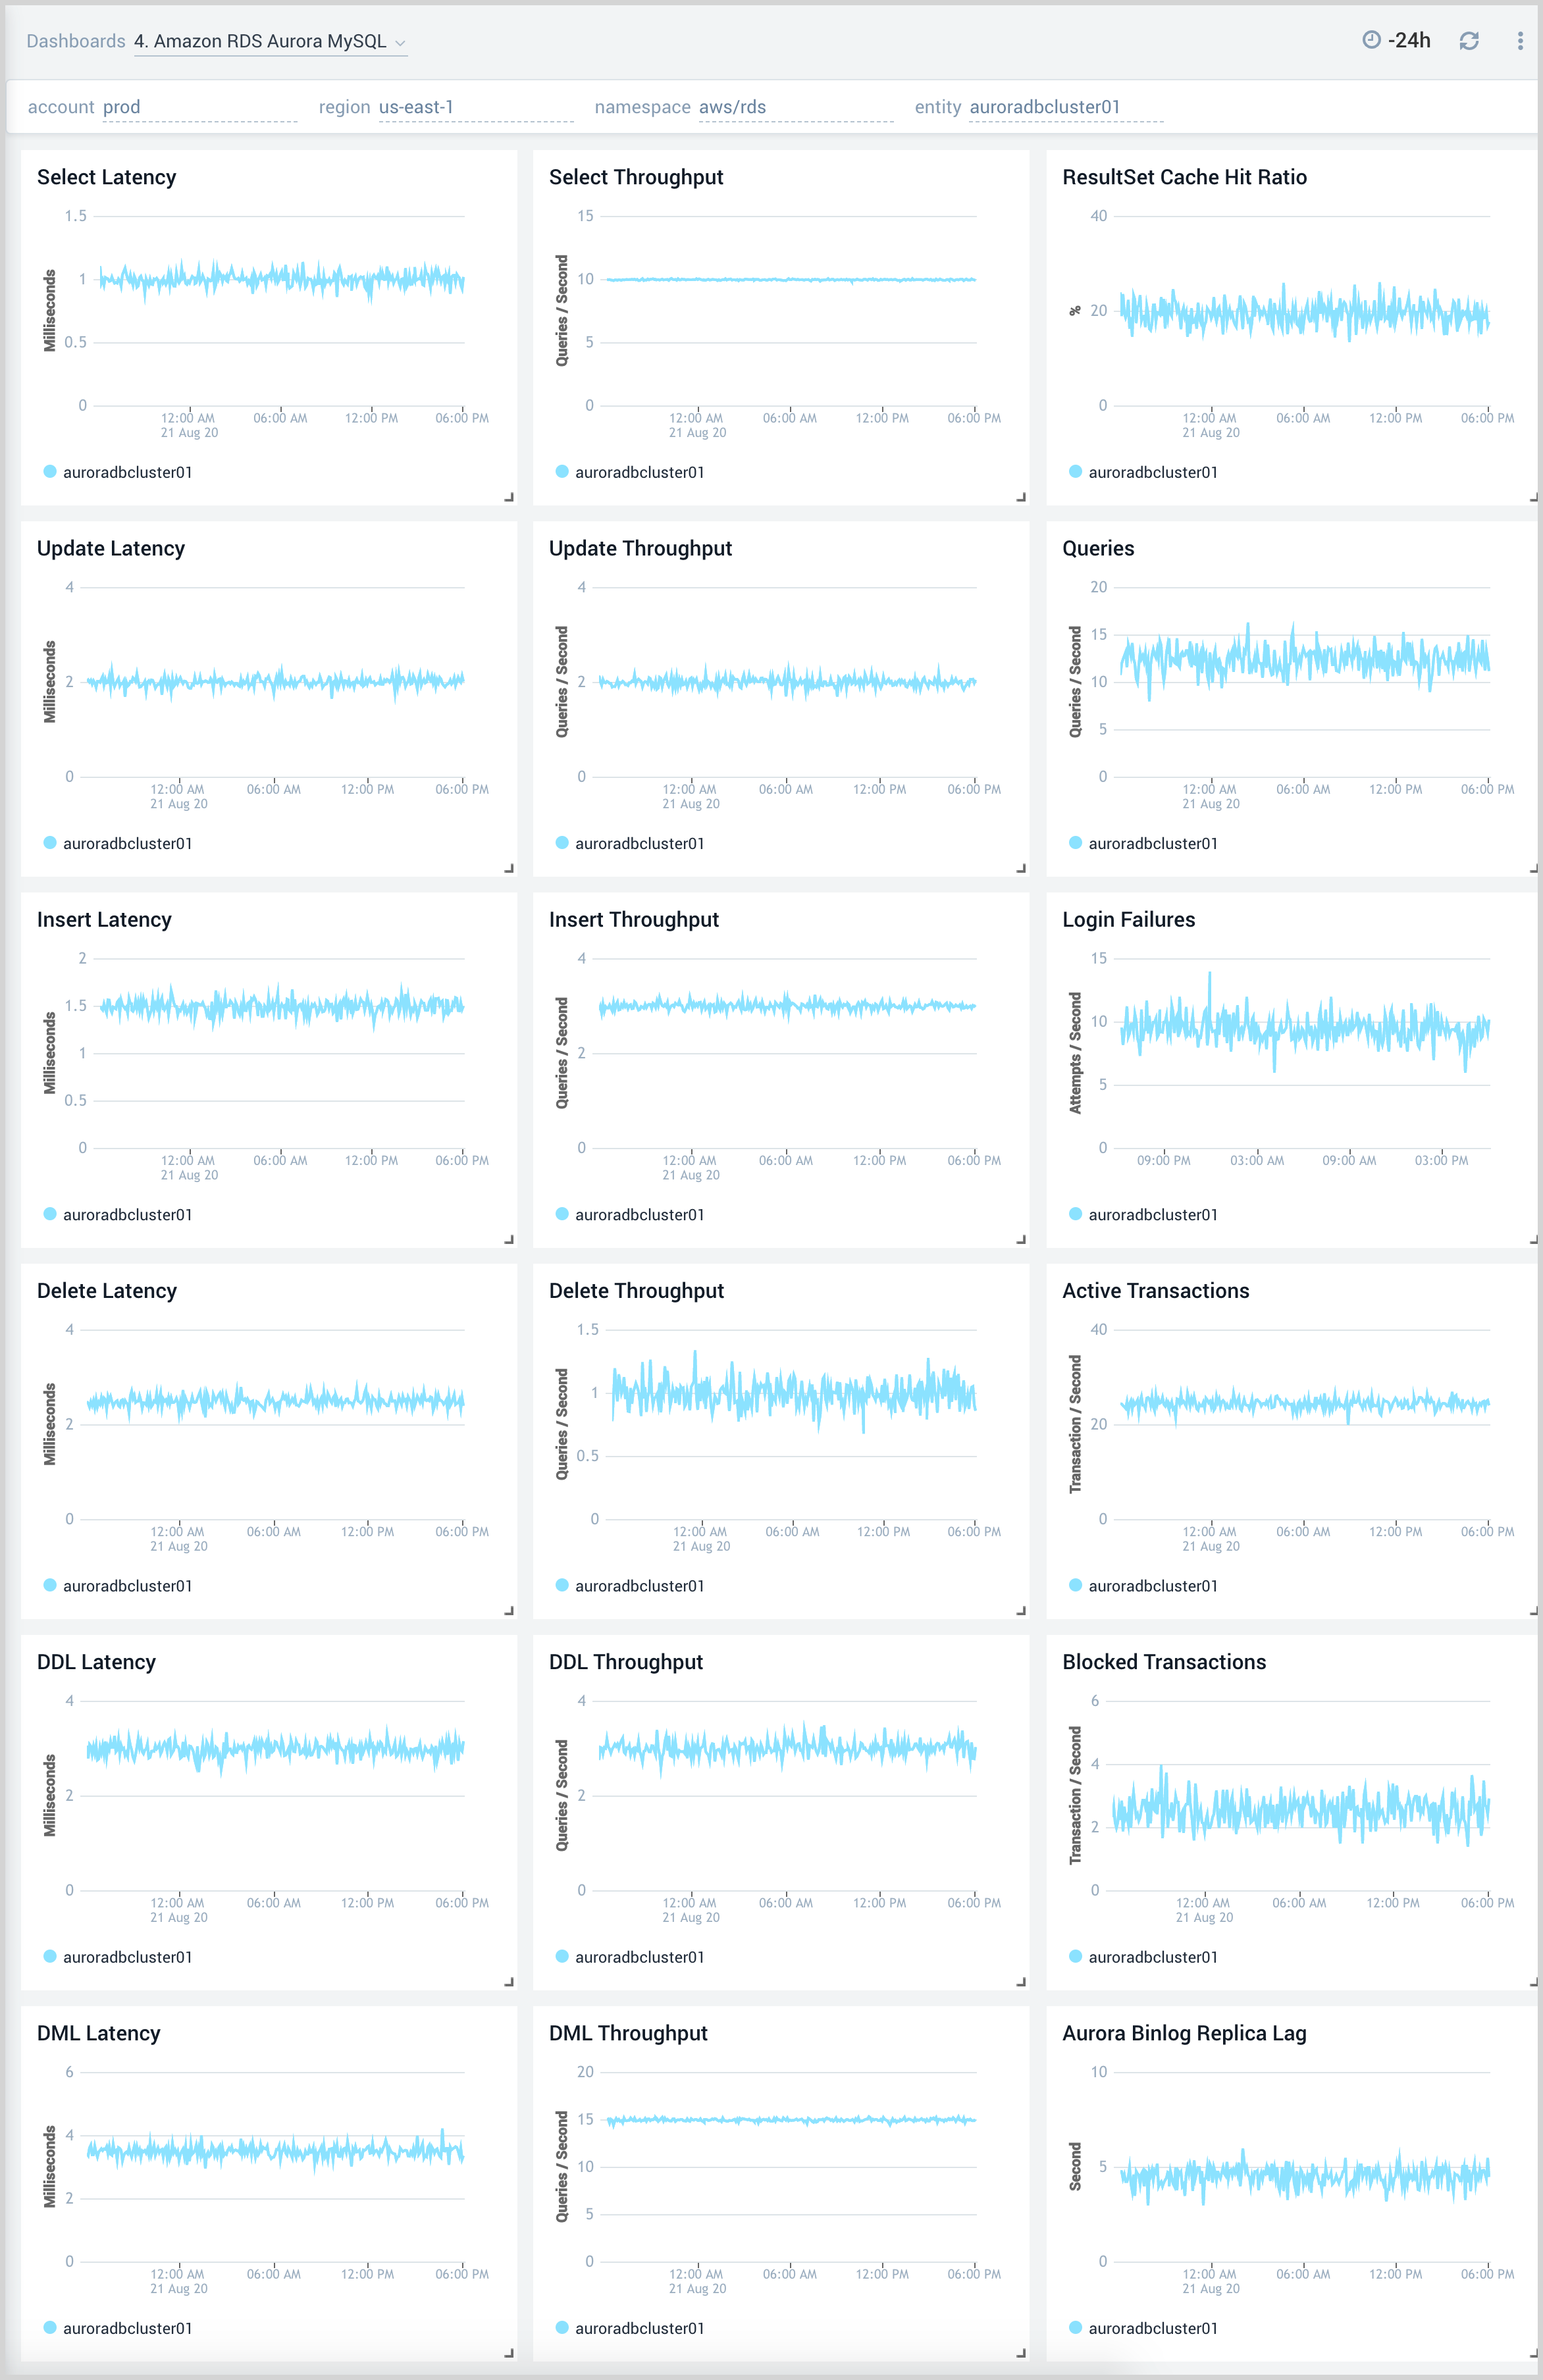
Aurora MySQL
The Amazon RDS Aurora MySQL dashboard provides intuitive Aurora MySQL performance data from across your infrastructure for latency, throughput, active and blocked transactions, queries, login failures, and replica lag.
Use this dashboard to:
- Monitor the health and performance of your RDS Amazon Aurora MySQL instances and cluster.
- Monitor the throughput and latency associated with various types of queries executed on an Aurora MySQL instance.
- Monitor active transactions blocked transactions, and the rate of queries being executed.
- Monitor replica lag between Aurora DB clusters that are replicating across different AWS Regions.
- Monitor the number of login failures to the database, for security monitoring.
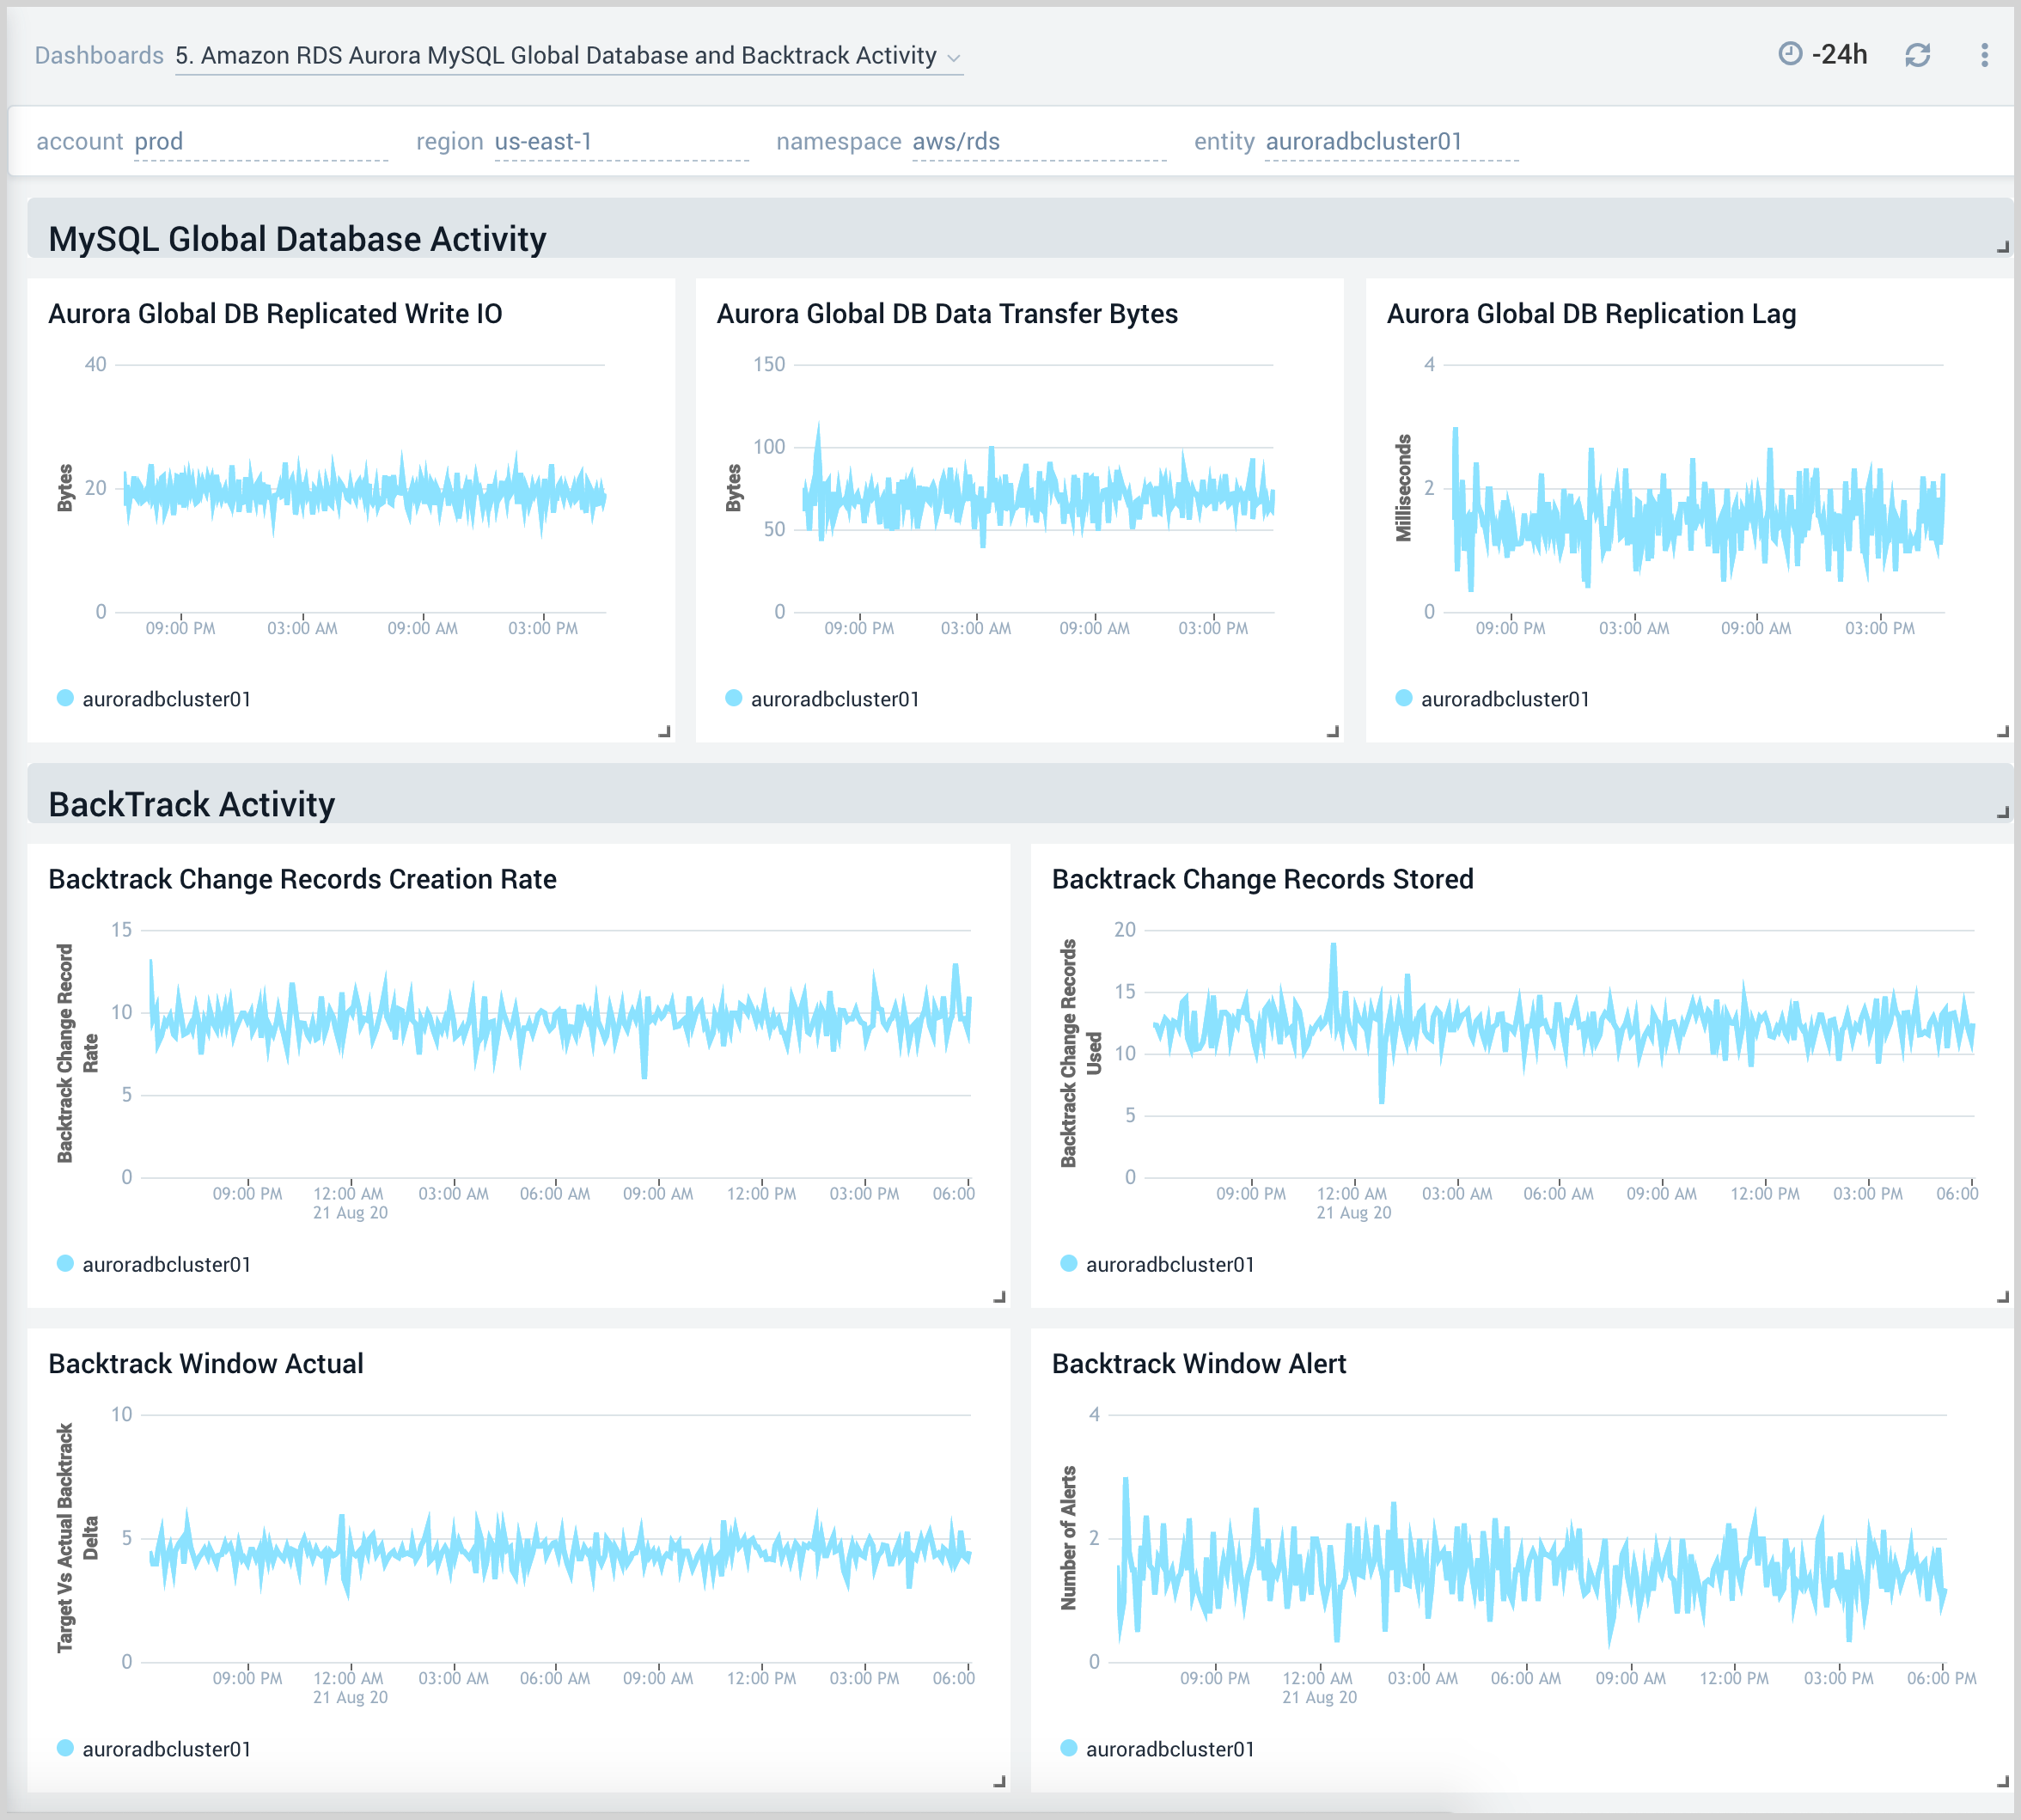
Aurora MySQL Global Database and BackTrack Activity
The Amazon RDS Aurora MySQL Global Database and BackTrack Activity dashboard provides insights into Aurora MySQL performance data from across your infrastructure for Global Database activity and Backtrack activity.
Use this dashboard to:
- Monitor backtrack and Amazon Aurora Global database activity.
- Monitor backTrack change records and the backtrack window of your RDS Amazon Aurora MySQL cluster.
- Monitor the amount of lag (in milliseconds) when replicating updates from the primary AWS Region for your Aurora Global database.
- Monitor the amount of redo log data that is transferred from the master AWS region to secondary AWS regions.
- Monitor the number of write I/O operations replicated from the primary AWS region to the cluster volume in a secondary AWS region in an Aurora Global Database. The billing calculations for the primary AWS region in a global database use AuroraGlobalDBReplicatedWriteIO to account for cross-region replication within the global database.