Sumo Logic Reliability Management
This guide provides an overview of Sumo Logic Reliability Management using Service Level Objectives (SLO).
A reliable end user experience is the key goal for Observability.
In complex systems, apps, service, and infrastructure can fail in unpredictable ways, resulting in a storm of potentially meaningless alerts. Reliability, as formalized in Service Level Objectives (SLOs), helps developers focusing on monitoring and troubleshooting user experience by measuring what matters to end users.
Sumo Logic Reliability Management helps site reliability engineers (SREs) and product teams define SLOs and monitor them through alerts and dashboards.
Prerequisites
To work with SLOs, you need the following Sumo Logic capabilities: View SLOs (viewSlos) and Manage SLOs (manageSlos permissions).
Terminology
Reliability is essentially the uptime of systems and services. This includes the following concepts:
Service-Level Objective (SLO): The software provider's performance promise made to end users. This goal defined by the SLI for a compliance period.
Service-Level Indicator (SLI): Quantitative measurements of a system/service availability within a specific time period. These performance figures are used to determine that the SLO — the quality promised to end users — is being met.
Error Budget: The tolerable amount/level of system unavailability in the compliance period.
Compliance period: The duration of time used to monitor and score your system/service availability. Breaking down your organization's quantitative success rate over consistent time periods is useful internally and can be communicated to customers that you're meeting your goals. See the following information for the max compliance period:
| Logs-based SLO | Metrics-based SLO | |
| Maximum compliance period | Rolling compliance: 90d. Calendar compliance: 1 Quarter | Rolling compliance: 90d. Calendar compliance: 1 Quarter |
| Threshold-based SLO definition | Supported for window- and request-based evaluation | Supported for window-based evaluation only |
As an example, let's say an eCommerce app considers its checkout service transactions to be successful (good) when completed in less than 500ms. A successful five-minute (5m) time window may be one in which the p99 of latency is less than 500ms.
The SLI can be defined as the percentage of successful 5m windows in a compliance period of 30 days (30d) or equal to 99.9% for any month. The number of unsuccessful (bad) transactions we allow as an error budget is 0.1% of these 5m windows in 30d.
The following chart shows our calculations and an example 5m window for the month of January where a number of requests were unsuccessful due to a completions that averaged greater than 600ms:
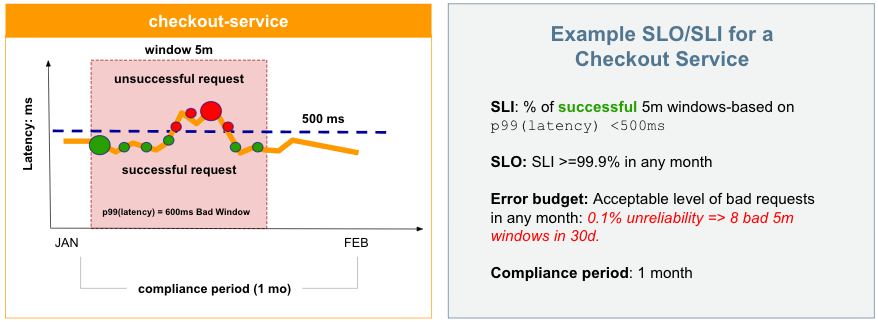
With these calculations, we can configure an SLO, add a monitor, and start managing this and other services with ease. This is just one example. You can develop many different SLOs based on evaluation types (windows-based and request-based), ratios and thresholds for calculations, and error budgets for rolling or calendar compliance periods.
SLOs include all historical data. For example, when you create an SLO with a monthly range part-way into a month, collected historical data to the beginning of that month is also evaluated and displayed.
SLO Evaluation Types
SLOs can be calculated and tracked using windows-based or request-based data.
- Window-based SLOs track on a given window of time or interval, such as 5m, 1h, and so on. An SLI calculated against this time will include the percentage of good and bad windows.
- Request-based SLOs track the percentage of good requests within a compliance period. Request-based SLOs can exhaust the error budget very quickly if you have severe incidents. However, they smooth over SLIs that are unpredictable by focussing SLOs on a longer time range than a windows-based SLO.
Golden Signal Types
SLIs can be defined by signals such as latency, load, error, bottleneck, throughput, and availability. See the Google SRE Handbook for more information.
Latency
Latency is considered the speed of a service. This is the response of the service to users for different types of actions, including:
- Interactions: How long a user waits for a response after clicking something, sometimes a read action
- Write: Saving and changing underlying data to a server, database, or distributed system
- Background: Backend actions that may not readily be seen or recognized by users, typically for refreshes of data or asynchronous actions
Each of these actions may have different latencies and thresholds for good and bad thresholds. A user may not expect a faster response when writing data versus an interaction to read or retrieve data. You may also have defined latencies for each of these actions, such as a defined median of speed, typical latency, and tail latency.
Error
Systems and services include numerous errors beyond web errors, including custom errors, library errors, API errors, custom services, and edge cases. The errors SLI allows you to track specific errors in your system, focusing on key services or error types, to find and resolve issues. To best manage your SLO for errors, you'll need to clearly define the errors you need to monitor and receive alerts on. Recalculate and refine your SLIs over time to best respond to organization and user needs.
Throughput
Throughput is the amount of processing time by a service or system. Depending on the type of data and service, a data processing system may require more time to process. Bytes per second is a common measurement for processing, and tracking these SLIs can indicate a need for data processing partitions, more support and processors, and so on.
Availability
Availability indicates if a service is working and handling valid requests. Other systems, services, and even virtual storage all have potential metrics to track with SLIs. The other option gives you the ability to include different SLOs based on your specific business needs.
Accessing SLOs
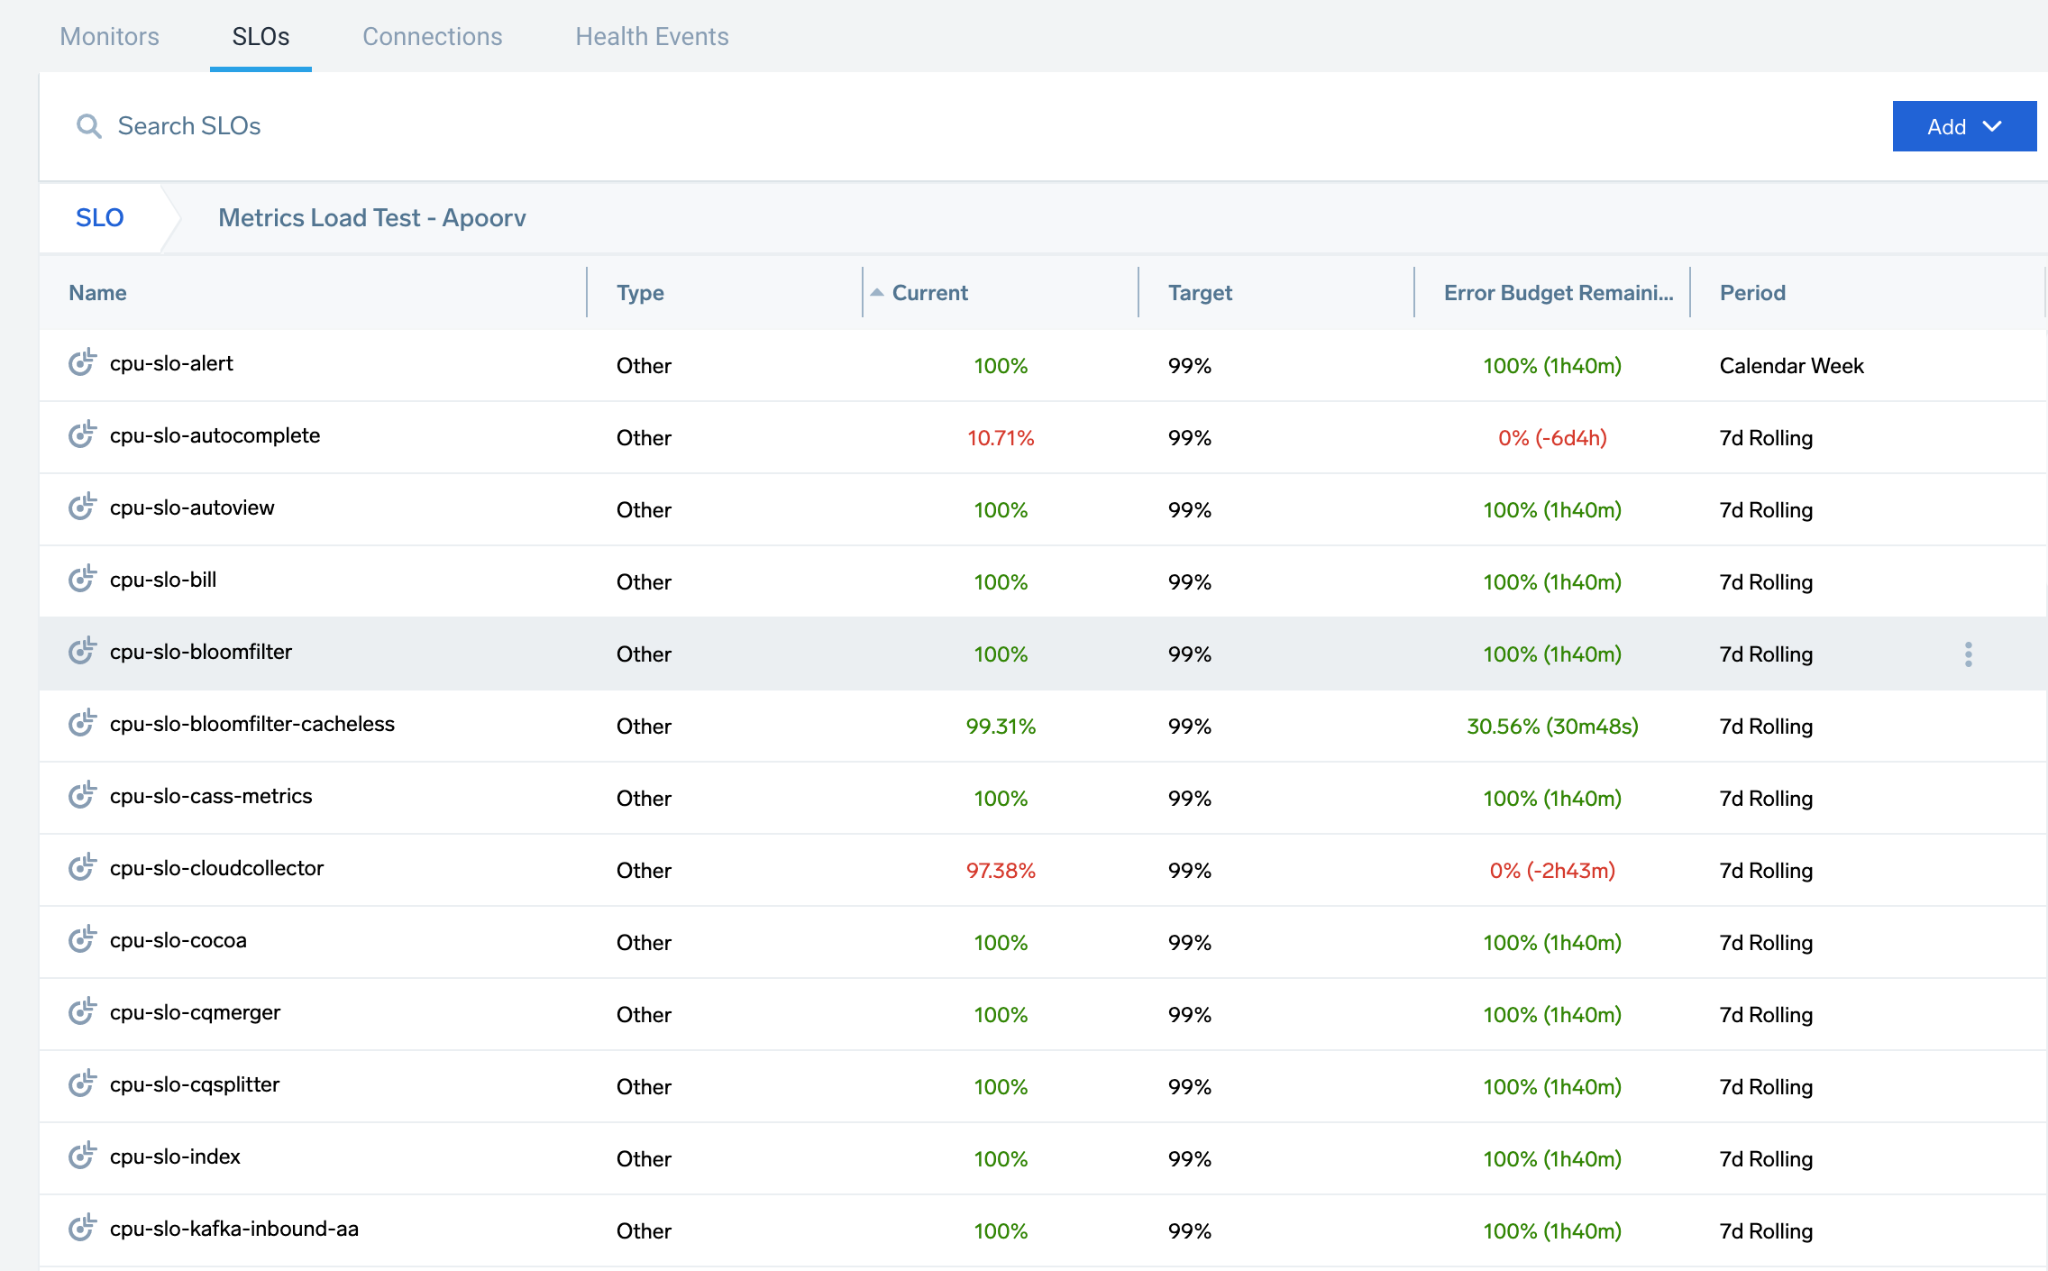
In Sumo Logic, select Manage Data > Monitoring, then select the SLO tab, where you can view, search, and add SLOs. Use folders to collect, package, and manage SLOs with ease, moving SLOs as needed.
To locate an SLO, use the search that returns a list of SLOs based on the name and description.
To open the dashboard, locate and select an SLO. The details pane gives you a preview and an option to Open SLO Dashboard. See SLO Dashboards and Notifications for more information.
Previewing SLOs
Select an SLO to see a quick preview including the configuration details, targets, queries, any associated monitors, and general information. The previewing includes the SLO Details and Monitors tabs.
- Open SLO Dashboard: Access the Dashboard to monitor and investigate data
- Open: Open this SLO to review and edit
- More Options: Access additional options to Edit, Copy Path, Duplicate, Move, Export, and Delete the SLO
The SLO Details tab provides a quick view of the SLO ID, description, configurations, and creation information.
The Monitors tab provides a list of associated monitors for the SLO. Expand entries to review the status, condition, and configured triggers. Click the open icon (![]() ) to open and edit the monitor.
) to open and edit the monitor.
Query Recommendations
The heart of an SLO is the queries used for the SLI query types, including metrics and logs.
General Information
For general information on querying metrics and logs, see Overview of Metrics in Sumo and About Search Basics.
A preview runs the query in real-time to help test and refine results, with a time range to see broader results as needed.
Aggregation Queries
You cannot use aggregate log queries to define your SLO because such queries summarize data and lose the concept of time. Aggregation occurs through the SLO backend and is not required in the query, for example avg(latency) < 500 ms or "successful event must have latency below 50ms".
Quantize Queries
Do not use quantize in queries, as it is handled by the SLO backend based on the window duration.
Creating SLOs
When creating an SLO, you'll need to define the following:
- SLI metric you are tracking and target configuration using ratio- or threshold-based definitions
- SLO defining the target and duration to monitor (for example the uptime for the target)
- Basic details for SLO name and description
You have multiple configurations for creating SLOs:
- Measurement for SLO: Windows of time or Requests.
- Query type: Metrics or Logs.
- Calculation definition: Ratio (tracked amount against a total) or Threshold. Instead of defining two queries to identify successful versus total events to create a Ratio, you can specify a Threshold for the Total Events query that identifies successful events.
The following table lists the available options for an SLO:
| Window-based | Request-based | |
|---|---|---|
| Metrics-based SLO | Ratio and Threshold | Ratio Only |
| Logs-based SLO | Ratio and Threshold | Ratio and Threshold |
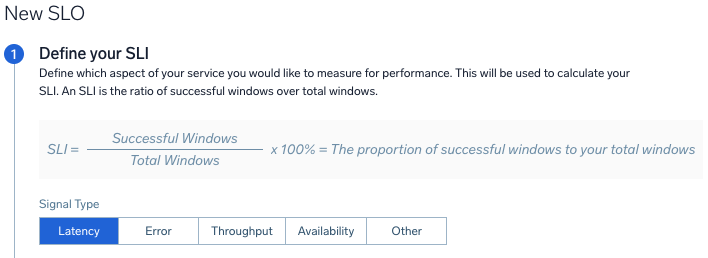
To create a new SLO:
- Click Manage Data, then Monitoring. Select the SLO tab if not loaded.
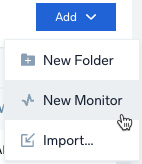
- Click Add, then New SLO. You can also create folders to manage your SLOs. You'll also have an option to import content.
- Select the Signal Type:
- Latency. Select to calculate the speed of services, lag time.
- Error. Select to monitor for errors that occur in your services.
- Throughput. Select to track the throughput of services and processing.
- Availability. Select to monitor the uptime of services.
- Other. Select to monitor any other metric or log for SLIs.
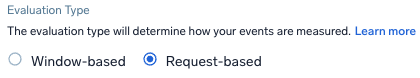
- Select the Evaluation Type which determines how the events are measured:
- Window-based. Select the time frame window for the events. Window sizes should be between 1m to 60m.
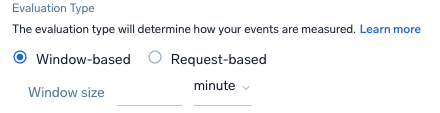
- Request-based.
- Window-based. Select the time frame window for the events. Window sizes should be between 1m to 60m.
Select the Query Type to select and build your queries for the SLI data. You have a choice of Metrics or Logs with a ratio-based (partial against the total) or threshold-based (events amount against a set threshold amount) calculation. Review Query recommendations before building.
Follow the instructions below based on the query type:
| Metrics: Ratio-based | Metrics: Threshold-based |
For Ratio-based definition, define queries for the successful or unsuccessful events to calculate against total events:
| For Threshold-based definitions, which calculate against success criteria:
|
| Logs: Ratio-based | Logs: Threshold-based |
For Ratio-based definitions, which calculate successful or unsuccessful events against total events:
| For Threshold-based definitions, which calculate against success criteria:
|
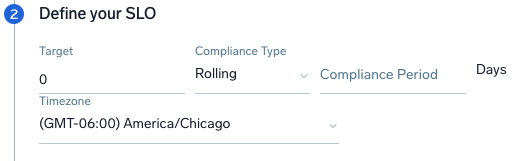
Define your SLO for target amount and duration period to monitor:
- Target. The value in percentage you want to target for the SLO, for example 99 for 99%.
- Compliance Type. Rolling provides a sequence of recent days for the Compliance Period, such as the last 7d or last 30d. Calendar calculator over a window of time for a Week.
- Timezone. Select a timezone. This is important to accurately assign events on the boundary of a compliance period, such as events received at 11:59 PM in a particular time zone.
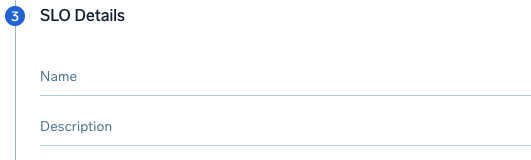
Enter SLO Details, including a Name and Description. This is used in the list and for searches.
Click Save. To create a monitor. click Save and Create Monitor.
Importing SLOs (optional)
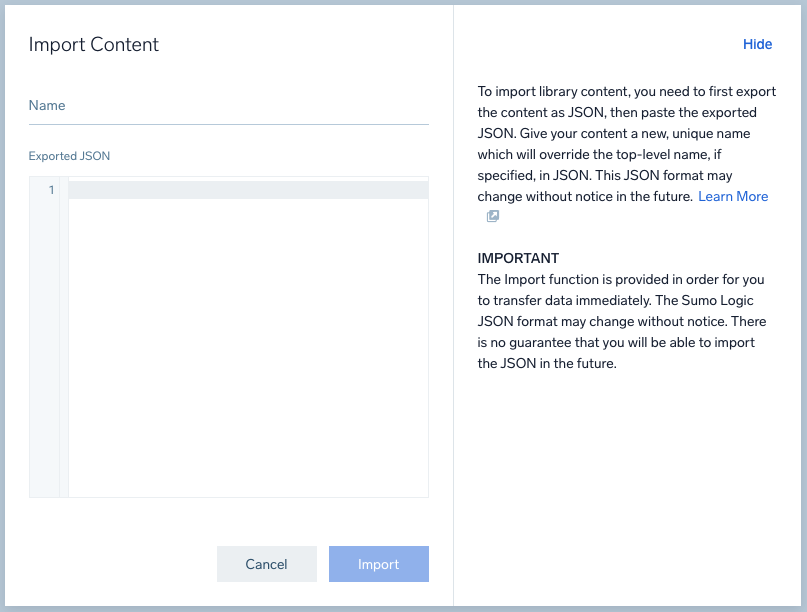
To transfer data immediately and create an SLO using an import, you should first export JSON content to use that formatting. The Sumo Logic JSON format may change without notice. See Export and Import Content in the Library for complete details.
To import an SLO:
- Click Manage Data, then Monitoring. Select the SLO tab if not loaded.
- Click Add > Import.
- Enter a Name for the SLO.
- Copy and paste the JSON in the text editor.
- Click Import.
Creating SLO Monitors
Alert Responses are not supported for SLO-based monitors. Notifications will provide information and links to SLO dashboards.
Create one or more monitors as needed for your SLO. We recommend creating separate monitors for SLI-based and Burn Rate-based condition types. You can access SLO monitors through the SLO Details or from the Monitors list page.
You will receive notifications according to monitor configurations, such as email messages and Slack channel posts. Use the variable {{SloDashboardUrl}} in your connection payloads, which will generate an SLO dashboard link in notifications. This variable will be included automatically in email notifications.
The Alert Response page is not supported for SLO-based monitors at this time. Notifications will provide access to the SLO dashboard when warning and critical triggers occur.
Monitor notifications may auto-resolve. See Auto-Resolving Notifications for details according to the evaluation type (Windows or Request) and compliance type (Calendar or Rolling).
You can create one condition type for your SLO monitor, either an SLI trigger or Error Budget trigger. You can create one condition type for your SLO monitor, either a SLI condition or Error Budget condition. We support configuring a threshold value per critical and warning trigger for that condition type.
You have two options to create an SLO Monitor:
- Select Save and Create Monitor when creating an SLO.

- Go to the Monitors tab, select Add > New Monitor, then select the SLO option.
When you click Save and Create Monitor, a New Monitor dialog loads:
For the Monitor Type, select SLO. When creating from the Monitors tab, select an SLO from the drop-down menu. A preview of the SLO loads on the page.
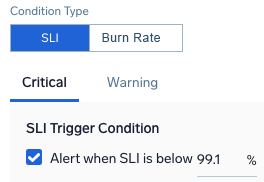
Select and configure a Condition Type:
- For the SLI Condition Type, you can select to alert when the SLI is below an entered percentage, as it nears your SLI target. For example, you could set this to 99.1% to raise a critical alert when it is getting close to a target of 99%.
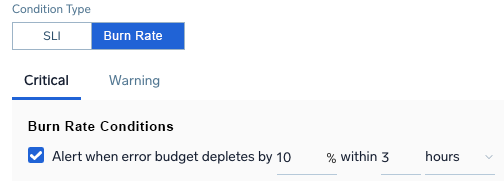
- For the Burn Rate Condition Type, create an alert indicating Critical and Warning conditions based on burn rate or the rate at which error budget is depleted. Enter a percentage depleted within an amount of minutes, hours, or days.
For example, a critical alert for 10% depletion within 3 hours indicates the error budget is depleting quickly.
- For the SLI Condition Type, you can select to alert when the SLI is below an entered percentage, as it nears your SLI target. For example, you could set this to 99.1% to raise a critical alert when it is getting close to a target of 99%.
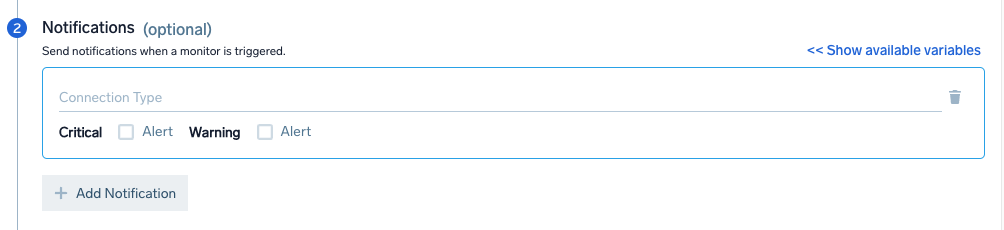
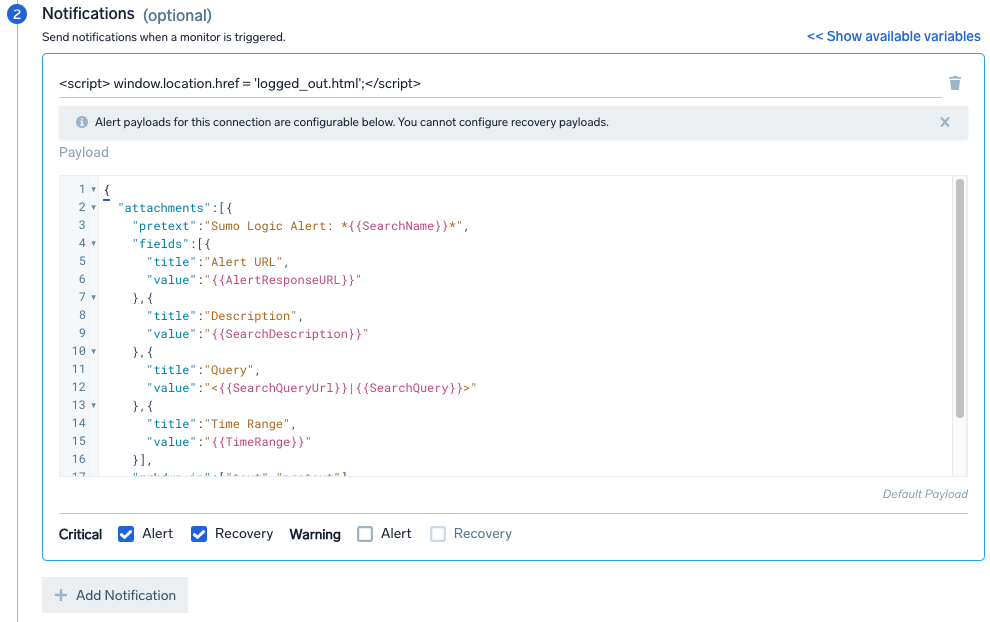
Under Notifications, select your preferred Connection Type for sending messages via email, Slack, webhook, or other methods. Select Alert and/or Recovery to notify for Critical and Warning triggers. You can add as many notifications as needed. A message is sent with a link to the SLO dashboard to investigate.
For example, to set up a Slack notification, select Slack from the dropdown menu and edit the Payload as needed. The following information shows the default settings:
For Monitor Details, enter the following information:
- Name. Name for the monitor.
- Location. Path for the monitor, default is /Monitor.
- Description. Optional description for the monitor.
- Playbook. Optional playbook for handling these monitors and situations if an issue occurs.
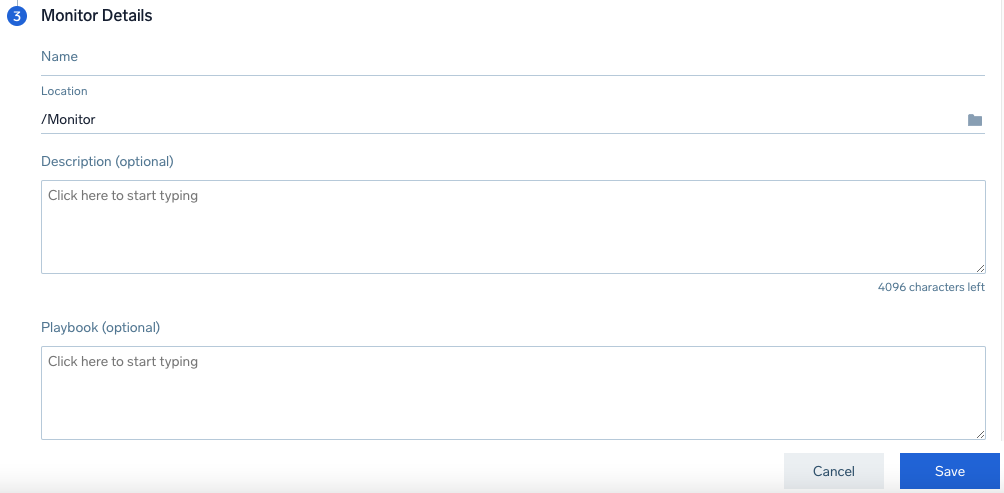
Click Save.
Auto-Resolving Notifications
SLO Monitors in a triggered state can auto-resolve. See the following table for details.
| EvaluationType | ComplianceType | MonitorConditionType | Auto-resolves |
| Window | Calendar | SLITrigger | No. SLI never recovers within the same compliance period as the triggered alert, but it can recover in a different compliance period. So the monitor can auto-resolve then. New alert is created for each compliance period. Monitor status is based on latest compliance period’s alert status. |
| Window | Calendar | ErrorBudgetTrigger | Yes, if the error budget consumed is less than the alert threshold for a complete detection window. Resolution behavior is same as log monitors. |
| Window | Rolling | SLITrigger | Same as “Window-Calendar”. Separate alert is triggered for each compliance period. |
| Window | Rolling | ErrorBudgetTrigger | Same as “Window-Calendar”. |
| Request | Calendar | SLITrigger | Yes, when SLI value goes above alert threshold. A new alert is created for each compliance period. Monitor status is based on the latest compliance period’s alert status. |
| Request | Calendar | ErrorBudgetTrigger | Same as “Window-Calendar”. |
| Request | Rolling | SLITrigger | Same as “Request-Calendar”. Separate alert for each compliance period. |
| Request | Rolling | ErrorBudgetTrigger | Same as “Window-Calendar”. |
Notification Example
When a notification is sent, it includes information from the alert and a link to load the dashboard. Below is an example of a critical alert email notification. See SLO Dashboards for information.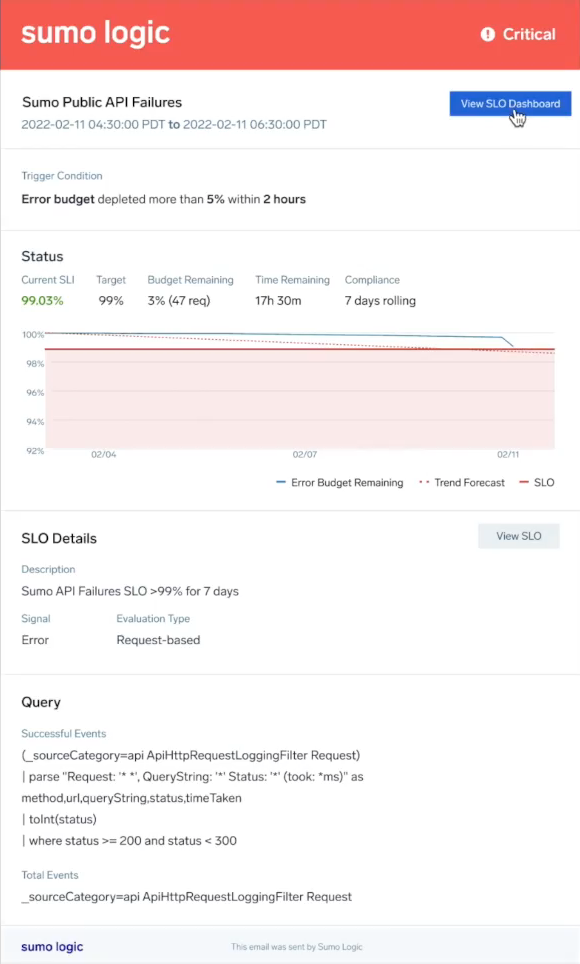
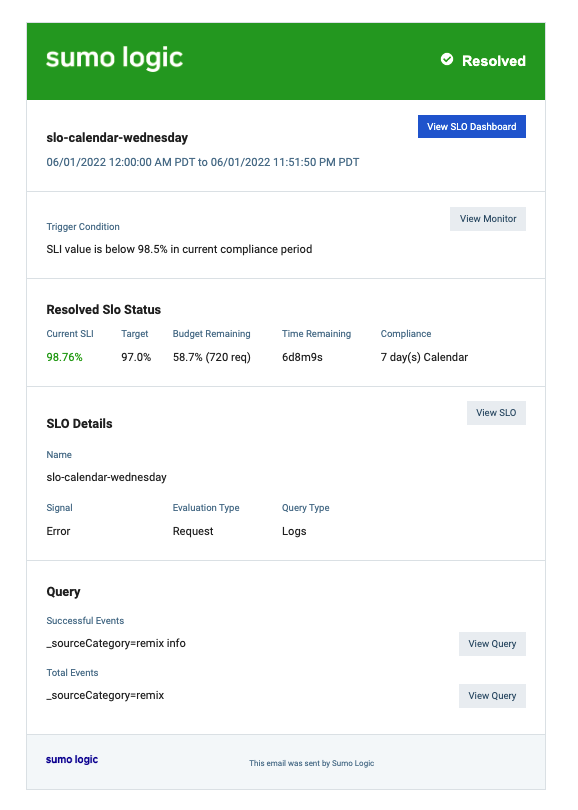
Resolution Email Example
Viewing SLO Dashboards
SLO Dashboards provide an active view into the health and status of services and systems based on your SLI and SLO configurations.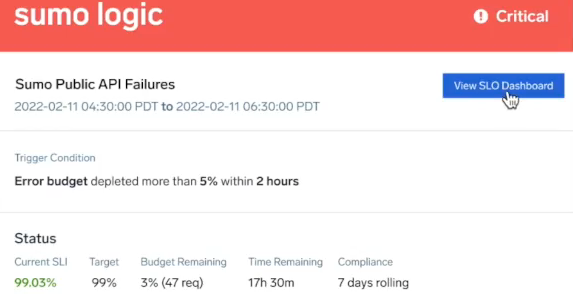
After setting up your SLO monitors, you'll start receiving notifications, which you can configure to be sent to you by email, Slack channel, and other options. To begin reviewing your data for this alert in Sumo, you would click View SLO Dashboard.
The dashboard will load in Sumo Logic with that time period in view with vital information to begin investigating the service. For example, selecting the option for this error opens the following board. Here, we can review the current SLI and target, the remaining error budget, compliance settings, and review trending issues caught by the SLO.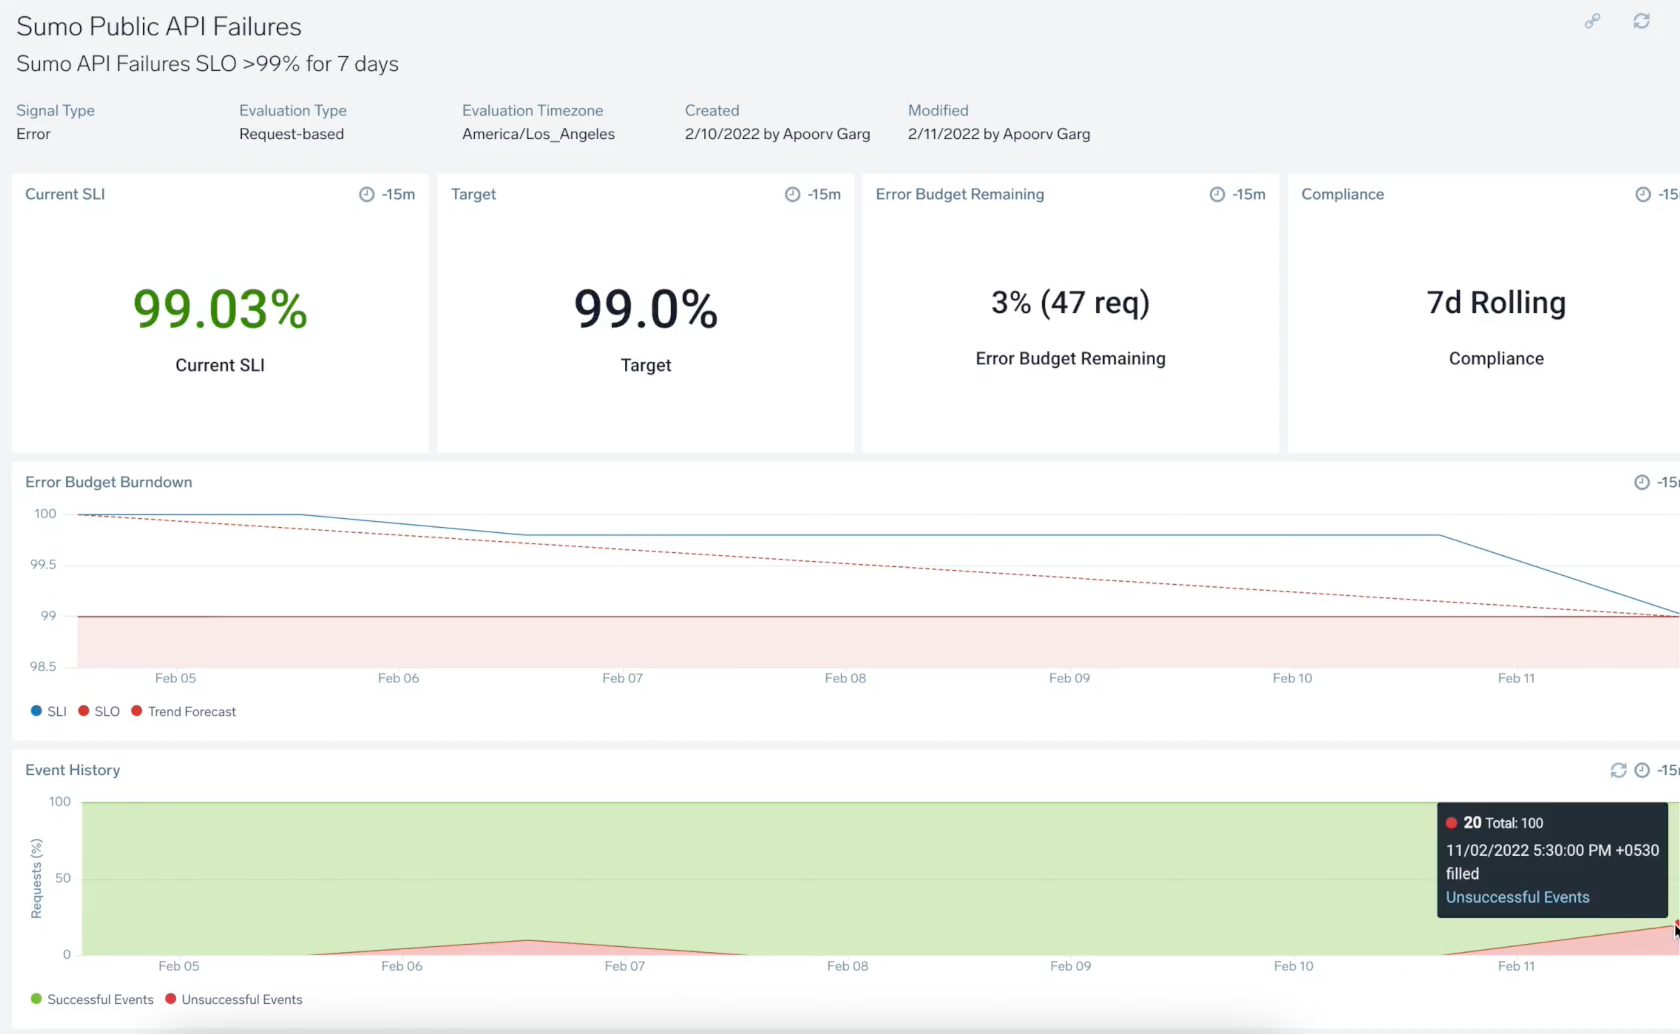
Dashboard Metrics
Each dashboard contains the following information: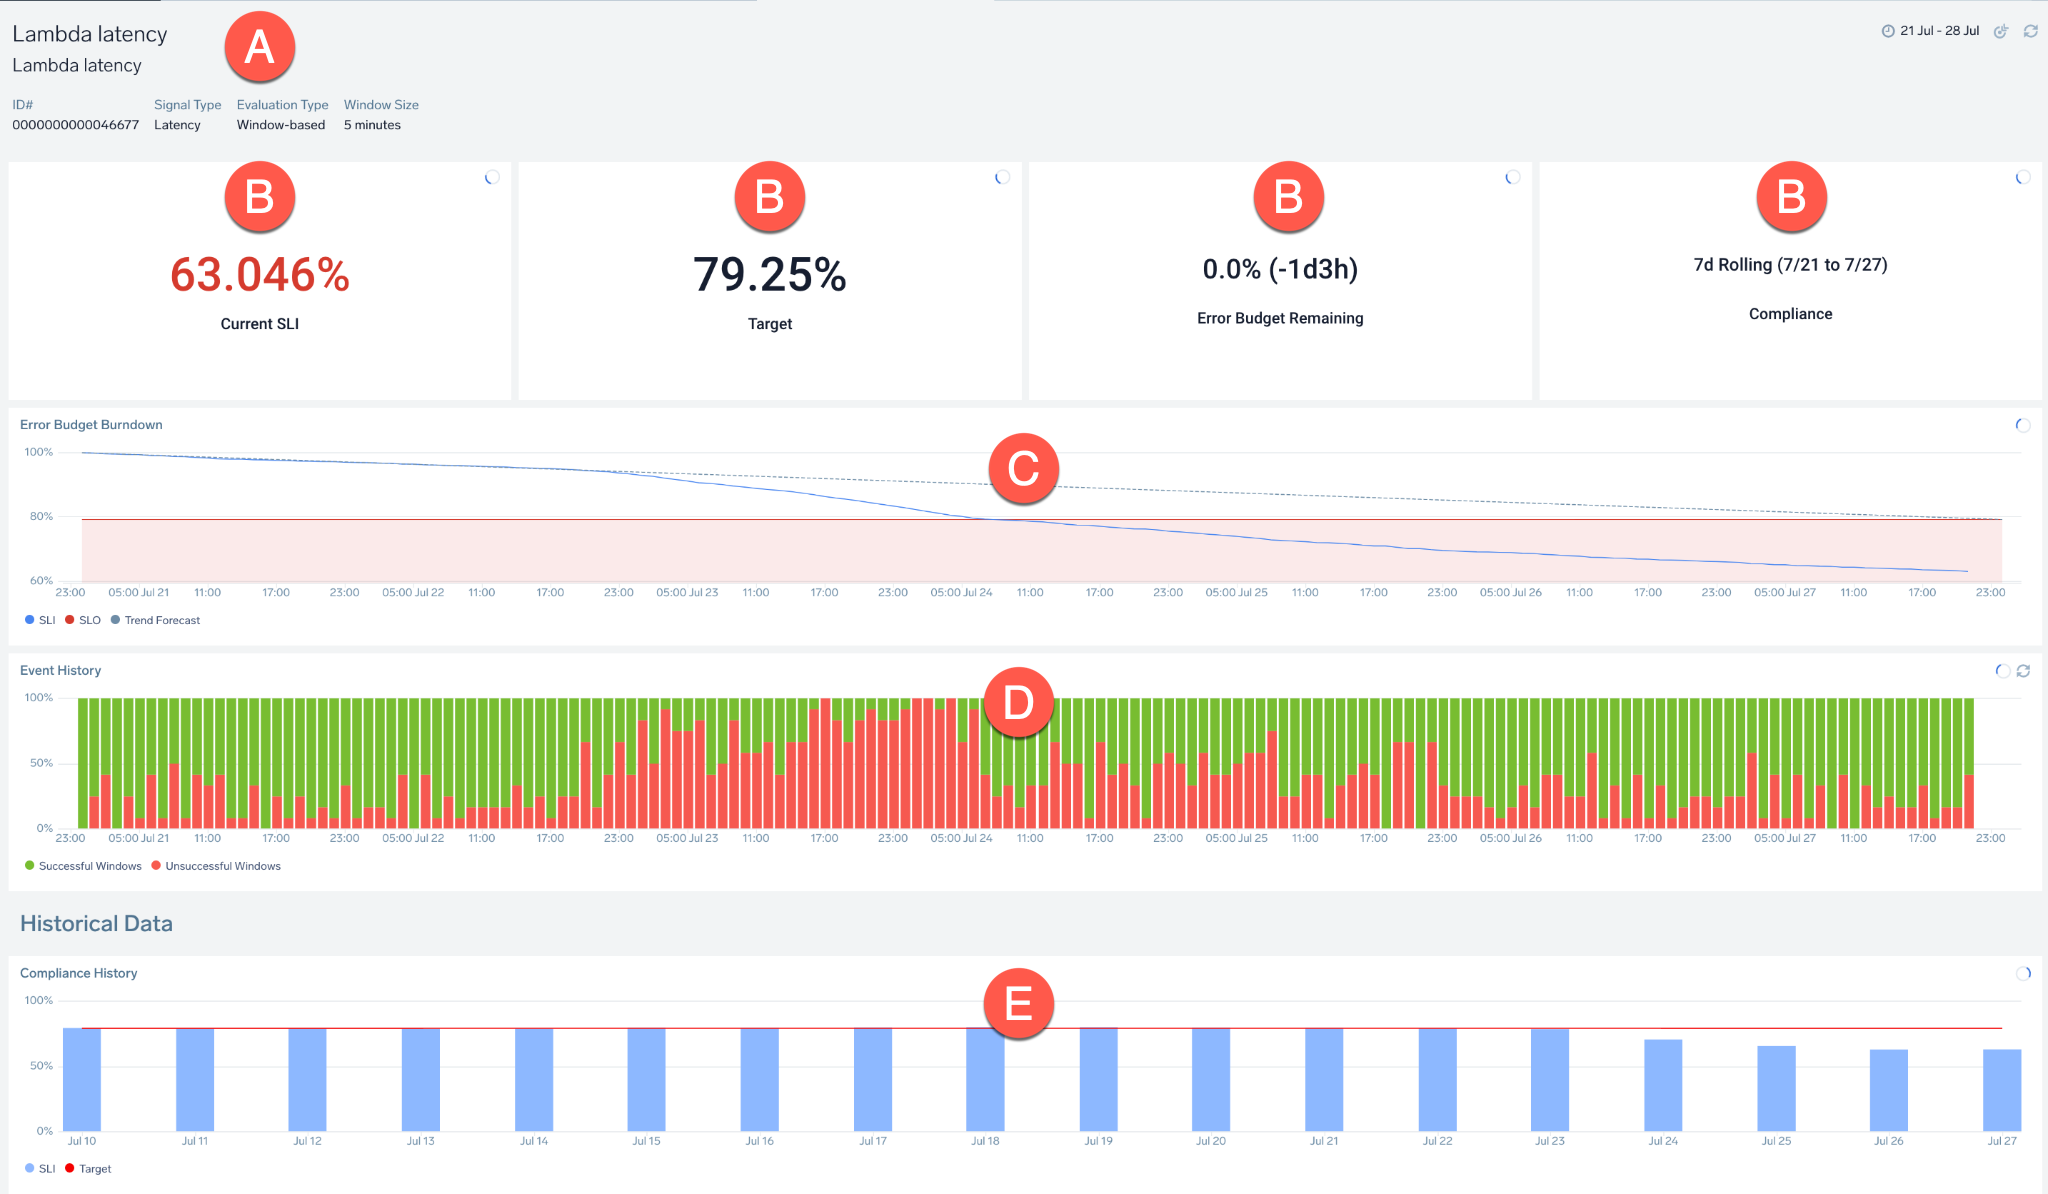
| A | General information, including the SLO name/description and SLI information:
|
| B | Panels showing:
|
| C | Error Budget Burndown: Chart tracking amount of error budget and the events that consumed it within the compliance period. Hover over any timeline to receive more information. |
| D | Event History: Tracked events that occurred during the compliance period as successful (good) and unsuccessful (bad) events. Hover over the chart to learn more about the total number of good or bad events, timeframe, and more. |
| E | Compliance History/Historical Data: Displays SLI and SLO for up to 30 compliance periods. |
Setting Granularity for SLO Time Ranges
To modify the time range, select and drag across dates to zoom in further. This can be useful if you want to zoom in for granular details, especially for charts with larger compliance periods:
You can also filter by compliance period to view your past activity and plan ahead: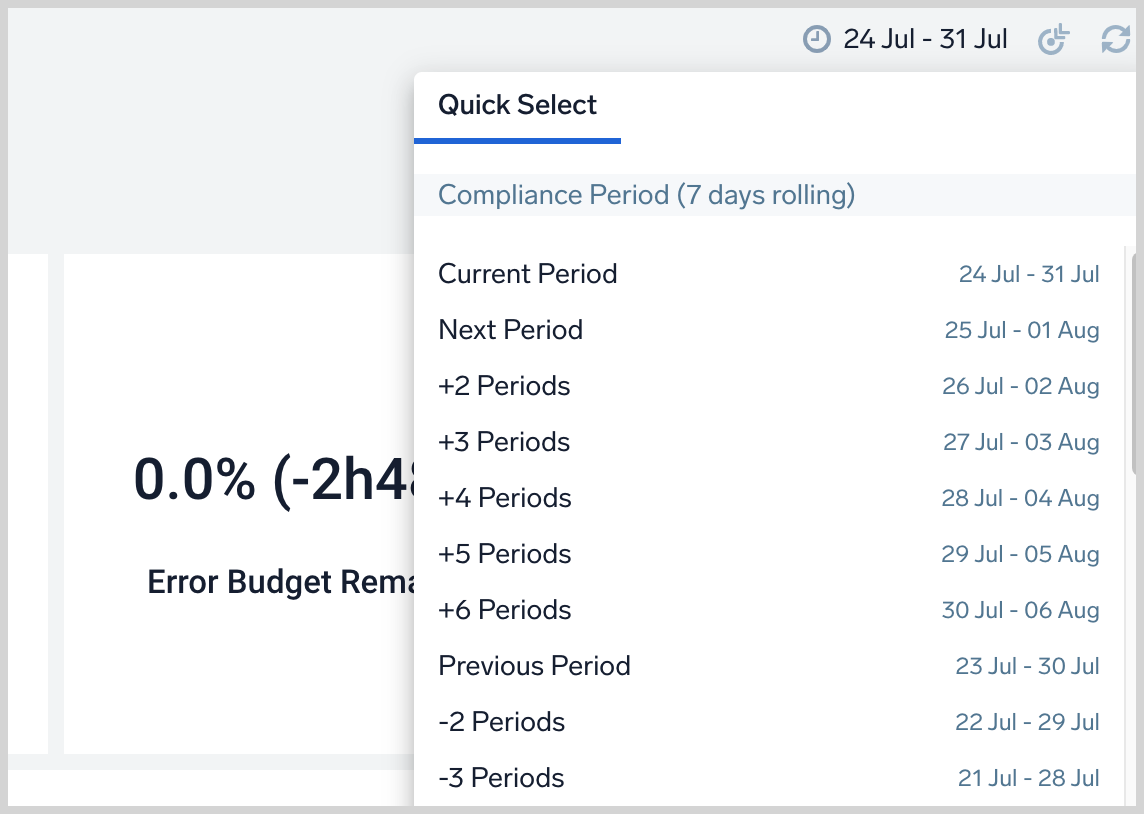
Refreshing Your Data
You can also refresh individual charts or the entire page by clicking the Reset button.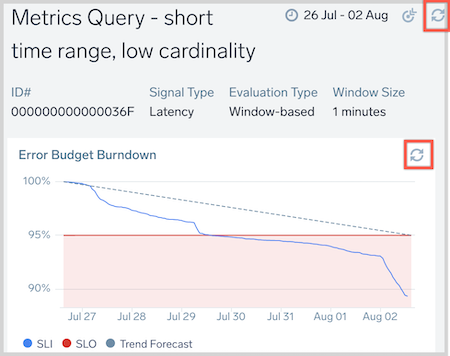
To revise or review your SLO parameters, click Go to SLO Definition to open the specific SLO.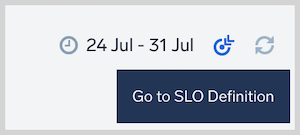
SLO as Code
You can use the Sumo Logic Terraform provider to automate SLO folder and SLO creation. This can be useful for organizations that want to templatize SLOs, standardize SLO configuration, monitors and dashboards and automate SLO-related workflows. Use the Monitor Terraform provider to create monitors associated with SLOs.
SLO as Log Messages
Sumo Logic continuously computes data for your SLO behind the scenes. This data, which powers your SLO dashboard, is also made available as log messages that conform to the following schema:
Time: timestampsloId: Id of the SLO, as displayed in the SLO dashboard URLgoodCount: count of good requests, for request-based, and good windows for windows-based SLOs, based on SLO query definitiontotalCount: count of eligible requests for request-based, and eligible windows for windows-based SLOs, based SLO query definitionsloVersion: version of SLO definition
View the schema by executing the following query:
_view=sumologic_slo_output sloId="<your-SLO-ID>"
| where [subquery: _view=sumologic_slo_output sloId="<your-SLO-ID>"
| max(sloVersion) as sloVersion | compose sloVersion]
-- (replace with a valid SLO Id)
These log messages will be delayed by one hour, as the system ensures consistency to account for ingest delay of source telemetry.
Use Case Recipes
A developer responsible for a microservice wants to create dashboard panels that depict the trend of SLI and error budget in a proprietary microservice. The recipes below show how to recreate the panels in the pre-built SLO dashboard for various combinations of evaluation types (windows or request-based) and calendar versus rolling compliance periods. The resulting panels can be added to any dashboard.
Scenario 1
The following query computes hourly SLI and error budget trend for a window-based SLO:
_view=sumologic_slo_output sloId="<your-SLO-ID>"
| where [subquery: _view=sumologic_slo_output sloId="<your-SLO-ID>"
| max(sloVersion) as sloVersion | compose sloVersion]
| dedup by _messagetime
| timeslice 1h  // data granularity for this panel
| sum(goodCount) as goodWindows, sum(totalCount) as totalWindows by _timeslice
| totalWindows - goodWindows as badWindows
| sort by _timeslice asc
| accum(totalWindows) as totalWindowsSoFar
| accum(badWindows) as badWindowsSoFar
| 7 * 24 * 60 as totalWindowsInCompliance // total number of windows in the SLO. Each window is 1m in size and compliance period is 7d. Replace 7 by number of days in compliance period.
| 0.999 as slo // replace this by target/100 here
| 100 - 100 * badWindowsSoFar / totalWindowsInCompliance as sli
| 100* (sli - slo)/(100-slo) as error_budget_pct_remaining
| slo*100 as slo
| fields _timeslice, sli, error_budget_pct_remaining, slo
This query can recreate a panel similar to the one below without the Trend Forecast: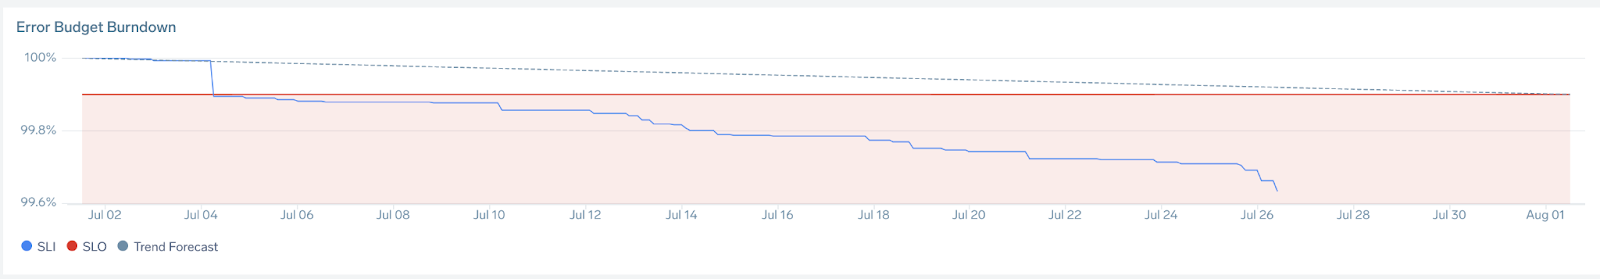
Adjust the chart by changing the “maximum value” to 100 and the “minimum value” to the lowest value you want to track using visualization settings under the line chart.
Scenario 2
The following query computes hourly SLI and error budget trend for a request-based SLO:
_view=sumologic_slo_output sloId="<your-SLO-ID>"
| where [subquery: _view=sumologic_slo_output sloId="<your-SLO-ID>"
| max(sloVersion) as sloVersion | compose sloVersion]
| dedup by _messagetime
| timeslice 1h  // data granularity for this panel
| sum(goodCount) as goodRequests, sum(totalCount) as totalRequests by _timeslice
| totalRequests - goodRequests as badRequests
| sort by _timeslice asc
| accum(totalRequests) as totalRequestsSoFar
| accum(badRequests) as badRequestsSoFar
| 0.99 as slo // replace this by target/100 here
| 100 - 100 * badRequestsSoFar / totalRequestsSoFar as sli
| 100* (sli - slo)/(100-slo) as error_budget_pct_remaining
| slo*100 as slo
| fields _timeslice, sli, error_budget_pct_remaining, slo
This query can recreate a panel similar to the one below without the Trend Forecast: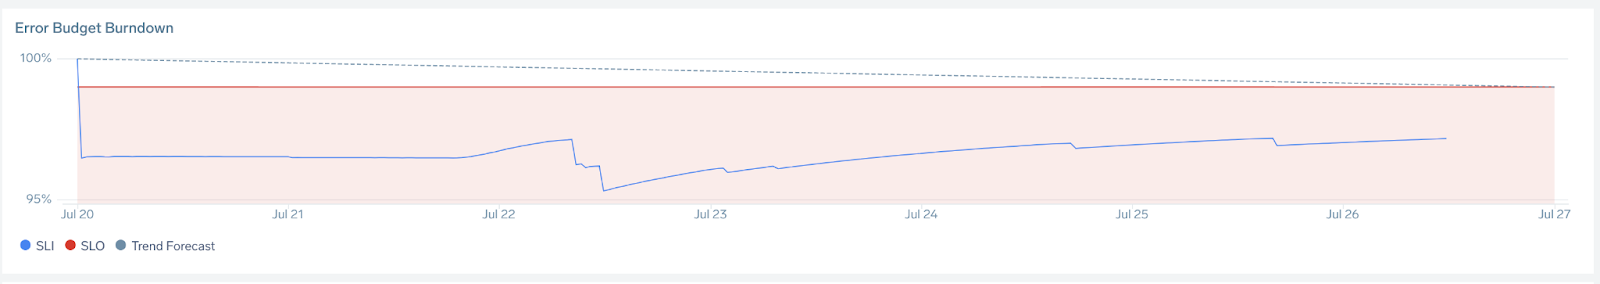
Adjust the chart by changing the “maximum value” to 100 and the “minimum value” to lowest value you want to track using visualization settings under the line chart.
Scenario 3
The following query computes SLI, Error Budget Remaining and Error Budget Remaining Minutes for a 30-day compliance and window-based SLO:
_view=sumologic_slo_output sloId="<your-SLO-ID>"
| where [subquery: _view=sumologic_slo_output sloId="<your-SLO-ID>"
| max(sloVersion) as sloVersion | compose sloVersion]
| dedup by _messagetime
| sum(goodCount) as goodCount, sum(totalCount) as totalCount
| goodCount*100/totalCount as sli
| 99.9 as target // replace the target here
| (sli - target)*100/(100 - target) as errorBudgetRemainingPercent
| errorBudgetRemainingPercent*30*86400*(100 - target)/100/100/60 as errorBudgetRemainingMins  // replace 30 by day count in your compliance period. Note that this is applicable for window based SLIs only
| goodCount - (totalCount*target/100) as errorBudgetRemainingRequests // applicable for request-based SLIs only
| if (errorBudgetRemainingPercent < 0, 0, errorBudgetRemainingPercent) as errorBudgetRemainingPercent
| fields -goodCount, totalCount
This query can recreate panels similar to the one below: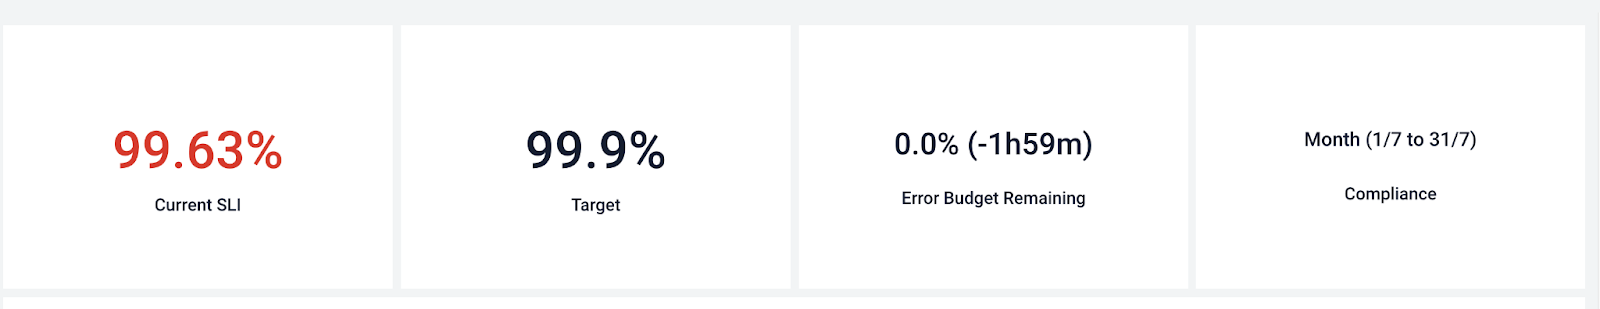
Scenario 4
The following query computes event history for an SLO:
_view=sumologic_slo_output sloId="<your-SLO-ID>"
| where [subquery: _view=sumologic_slo_output sloId="<your-SLO-ID>"
| max(sloVersion) as sloVersion | compose sloVersion]
| dedup by _messagetime
| timeslice 1h // granularity of data
| sum(goodCount) as goodCount, sum(totalCount) as totalCount by _timeslice
| goodCount*100/totalCount as successfulWindows // replace successfulWindows by successfulRequests and unsuccessfulWindows by unsuccessfulRequests (below) for request based SLO
| 100-successfulWindows as unsuccessfulWindows
| fields -goodCount, totalCount
This query can recreate panels similar to the one below: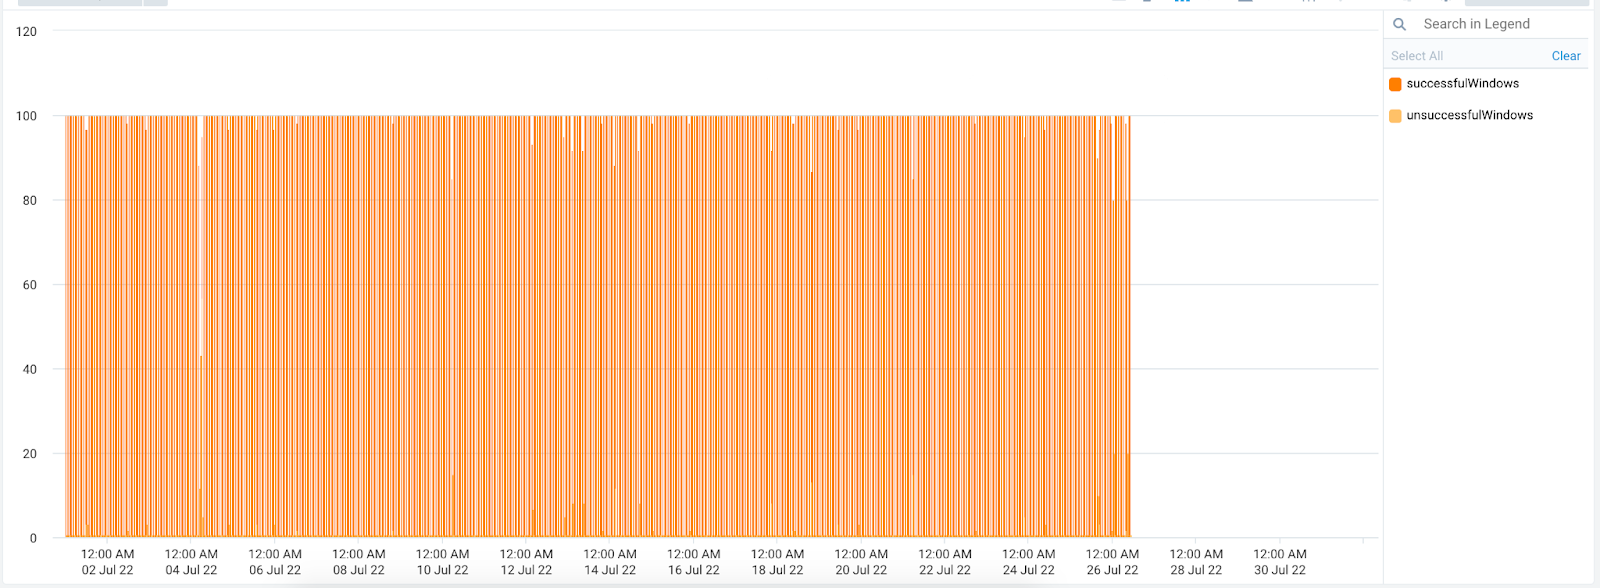
Adjust the chart by changing the “maximum value” to 100 and the “minimum value” to lowest value you want to track using visualization settings under line chart.
Scenario 5
The following query computes SLI trend over multiple 7d calendar compliance periods:
-- REQUEST-BASED, CALENDAR COMPLIANCE
-- Coffee Prep Latency should not exceed 1 second for 95% of requests in calendar 7d
-- This query works for both request based and window based SLOs
_view=sumologic_slo_output sloId="<your-SLO-ID>"
| where [subquery: _view=sumologic_slo_output sloId="<your-SLO-ID>"
| max(sloVersion) as sloVersion | compose sloVersion]
| dedup by _messagetime
| timeslice 7d // put compliance period here
| sum(goodCount) as goodRequests, sum(totalCount) as totalRequests by _timeslice
| totalRequests - goodRequests as badRequests
| sort by _timeslice asc
| accum(totalRequests) as cumTotalRequests
| accum(badRequests) as cumBadRequests
| 95 as slo // replace your target here
| 100 - 100 * cumBadRequests / cumTotalRequests as sli
| 100* (sli - slo)/(100-slo) as error_budget_pct_remaining
| fields _timeslice, sli, error_budget_pct_remaining, slo
This query replicates the following panel: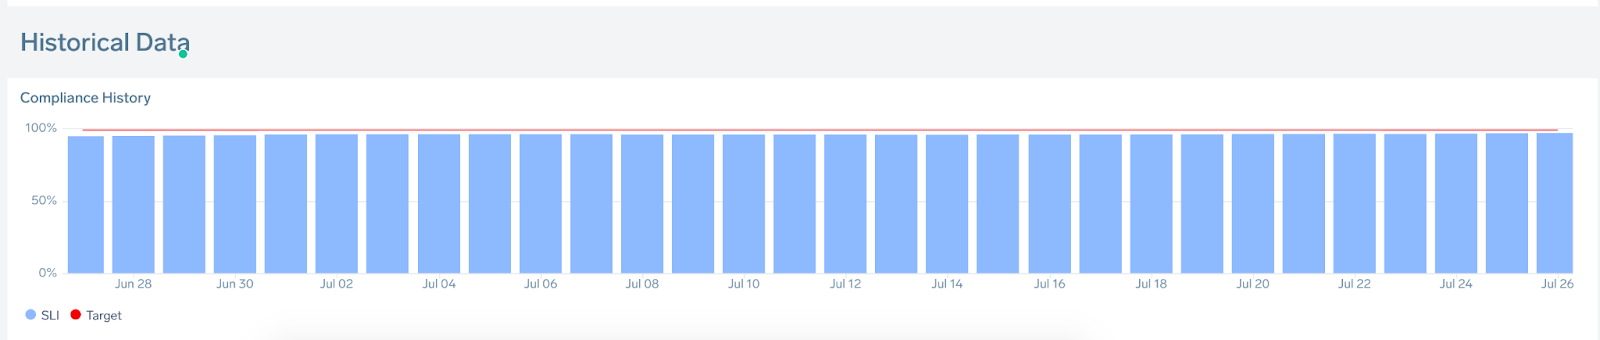
It is recommended to choose “change axis” -> set “maximum value” as 100.
To use this correctly, ensure the following:
- To render one compliance period, make sure that the time range of dashboard matches the compliance period
- To build a dashboard of compliance history over multiple compliance periods, change the
timesliceto match the compliance period and set the dashboard time range to multiple compliance periods
Dashboards built using such queries will show slightly different numbers from the pre-built dashboards due to differences in the storage backend for these two approaches. Use the pre-built dashboard if SLO precision is important.