Collect Metrics from Azure Monitor
This section has instructions for configuring a pipeline for shipping metrics available from Azure Monitor to an Event Hub, on to an Azure Function, and finally to an HTTP source on a hosted collector in Sumo Logic. Azure Monitor collects metrics and well as logs. The pipeline described below is for metrics, not logs.
For information about Azure metrics, see Overview of metrics in Microsoft Azure in Azure help.
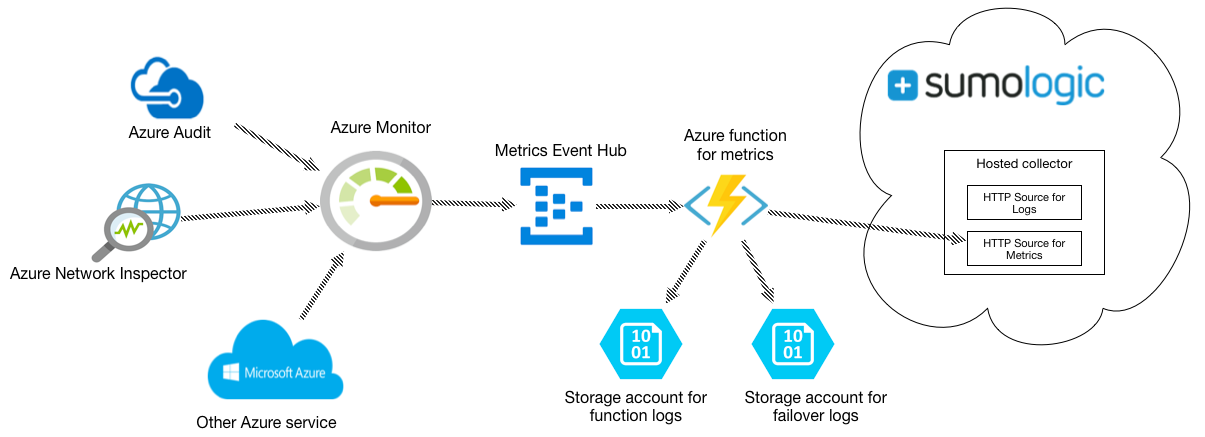
Here’s how the solution fits together:
- Azure Monitor collects metrics for most Microsoft Azure services and streams the data to an Azure event hub.
- Azure Event Hubs is a data streaming platform and event ingestion service. In this pipeline, an event hub streams the metrics collected by Azure Monitor to a Sumo-provided Azure function.
- The Azure function is a small piece of code that is triggered by the event hub to send metrics to the Sumo HTTP Source, function logs to one Storage Account, and failover data to another.
For more information about the solution strategy, see Azure Monitoring.
Configure metric collection
This section has instructions for configuring collection of metrics from Azure Monitor.
Step 1. Configure an HTTP source
In this step, you configure an HTTP source to receive logs from the Azure function.
- Select a hosted collector where you want to configure the HTTP source. If desired, create a new hosted collector, as described on Configure a Hosted Collector.
- Configure an HTTP source, as described on HTTP Logs and Metrics Source.
Step 2. Configure Azure resources using ARM template
In this step, you use a Sumo-provided Azure Resource Manager (ARM) template to create an Event Hub, an Azure function and two Storage Accounts. The Azure function is triggered by Event Hub. Two storage accounts are used to store log messages from the Azure function and failover data from Event Hub.
Download the azuredeploy_metrics.json ARM template.
Go to Template deployment in the Azure Portal.
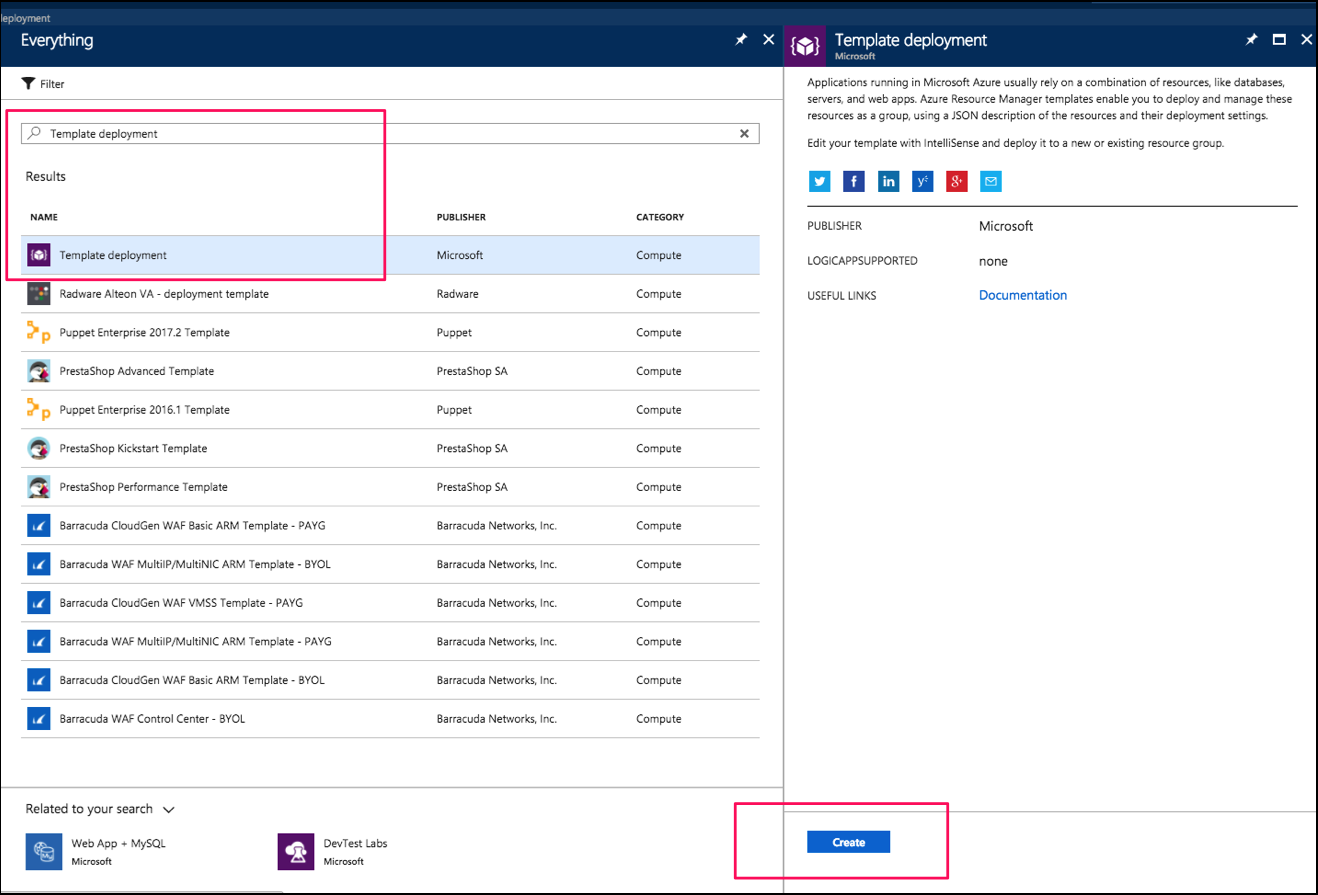
Click Create.
On the Custom deployment blade, click Build your own template in the editor.
Copy the contents of
azuredeploy_metrics.jsonand paste it into the editor window, and click Save.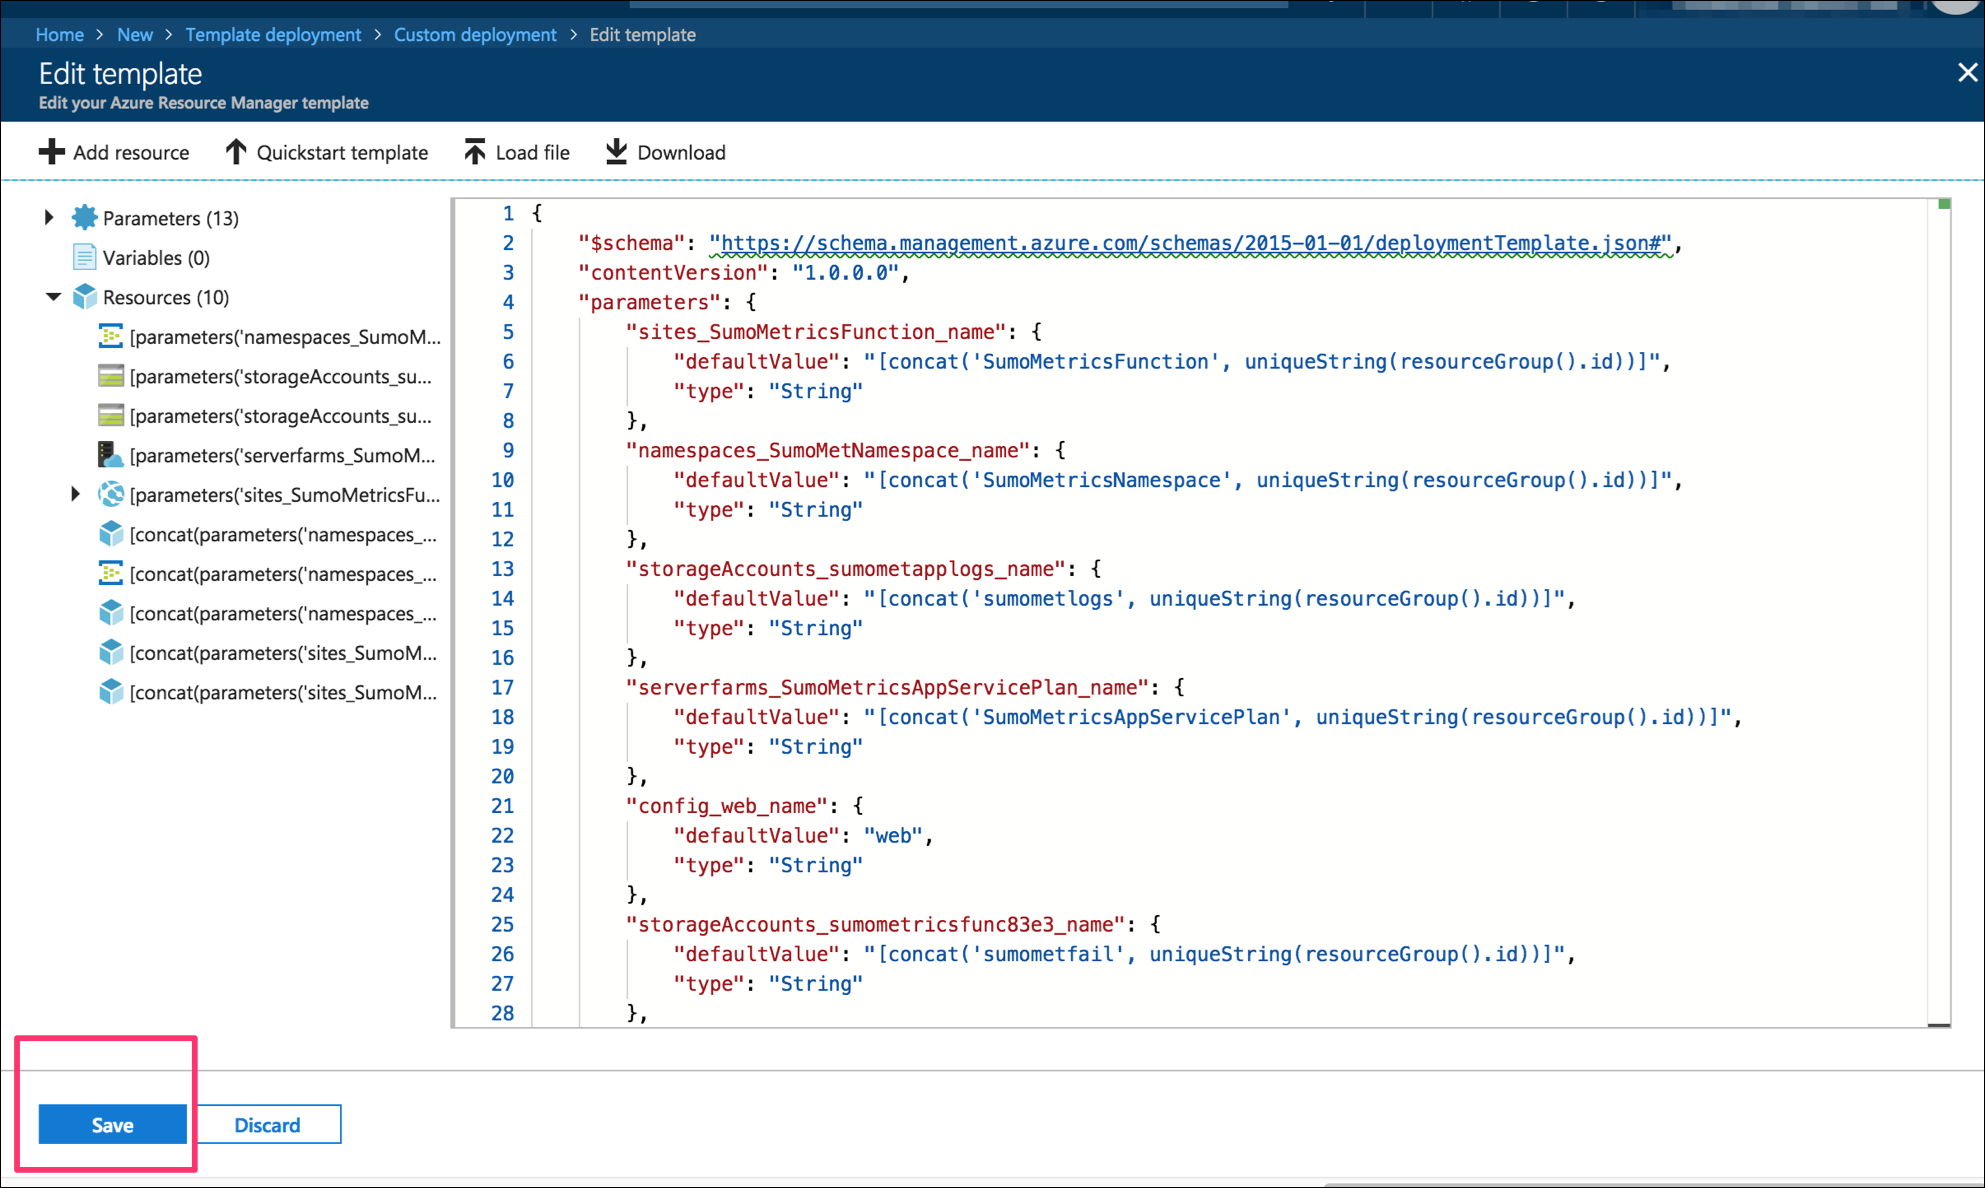
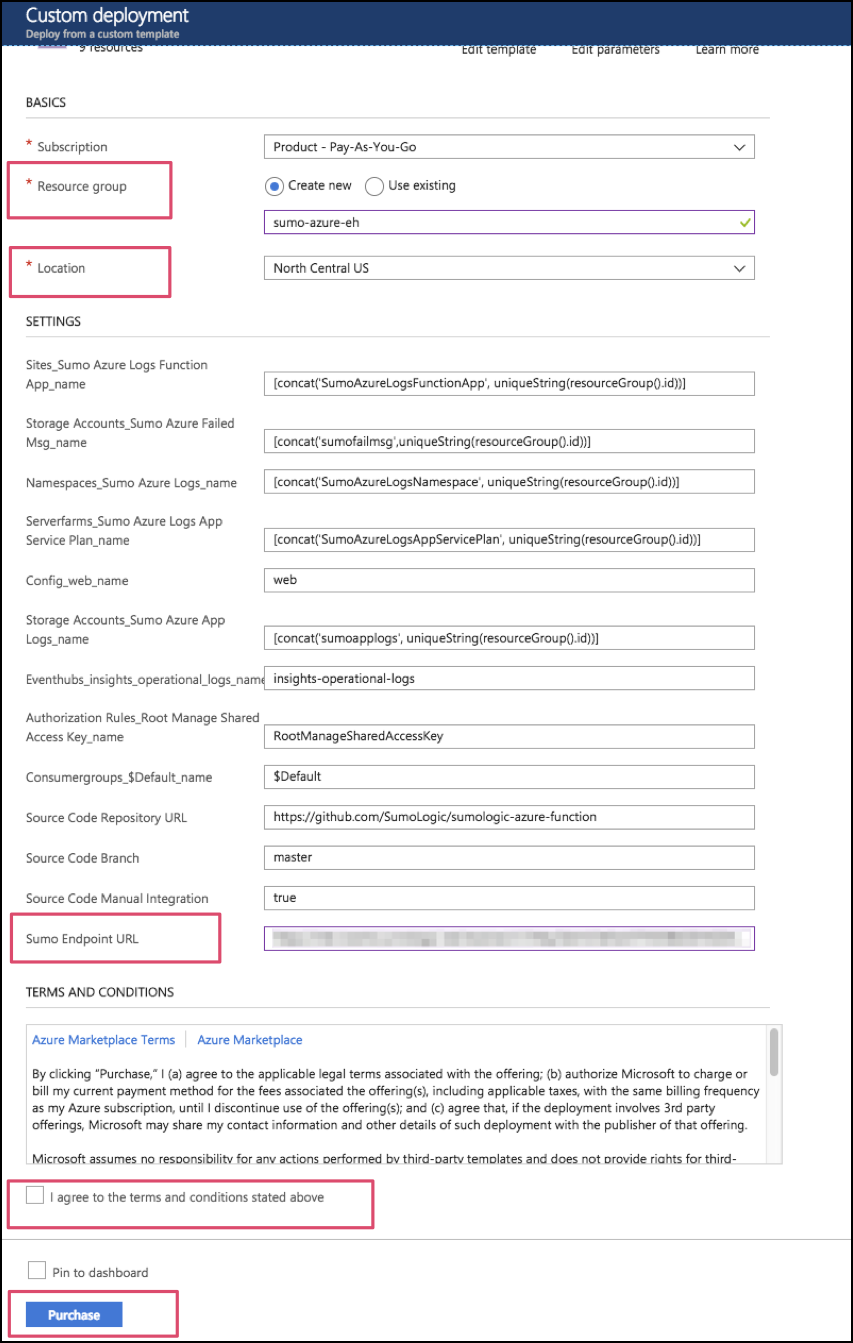
Now you are back on the Custom deployment blade.
Create a new Resource Group (recommended) or select an existing one.
Choose Location.
For the Sumo Endpoint URL supply the URL for HTTP source you defined in Step 1.
Agree to the terms and conditions.
Click Purchase.
Verify the deployment was successful by looking at Notifications at top right corner of Azure Portal.
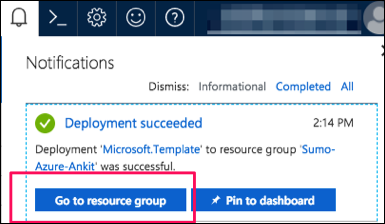
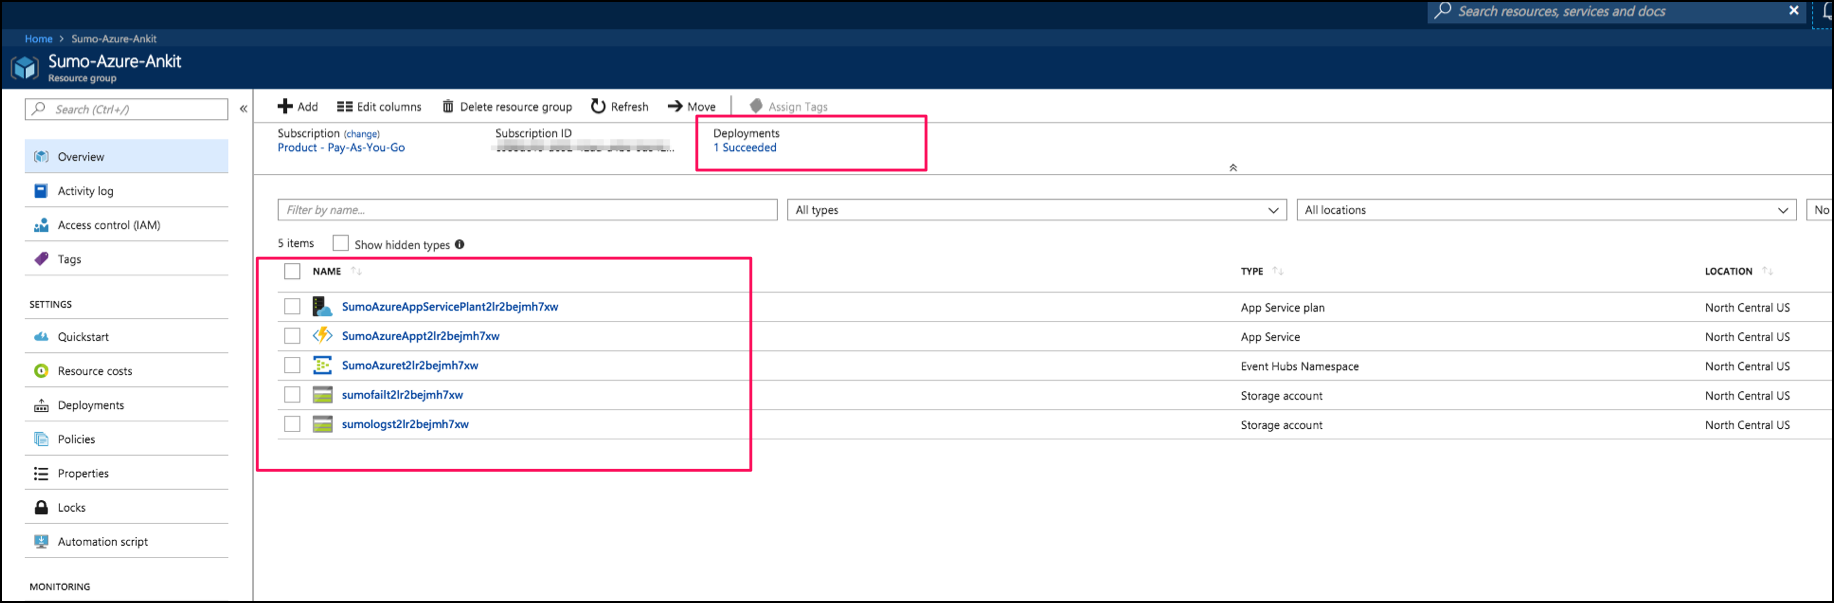
(Optional) In the same window, you can click Go to resource group to verify all resources have been created successfully. You will see something like this:
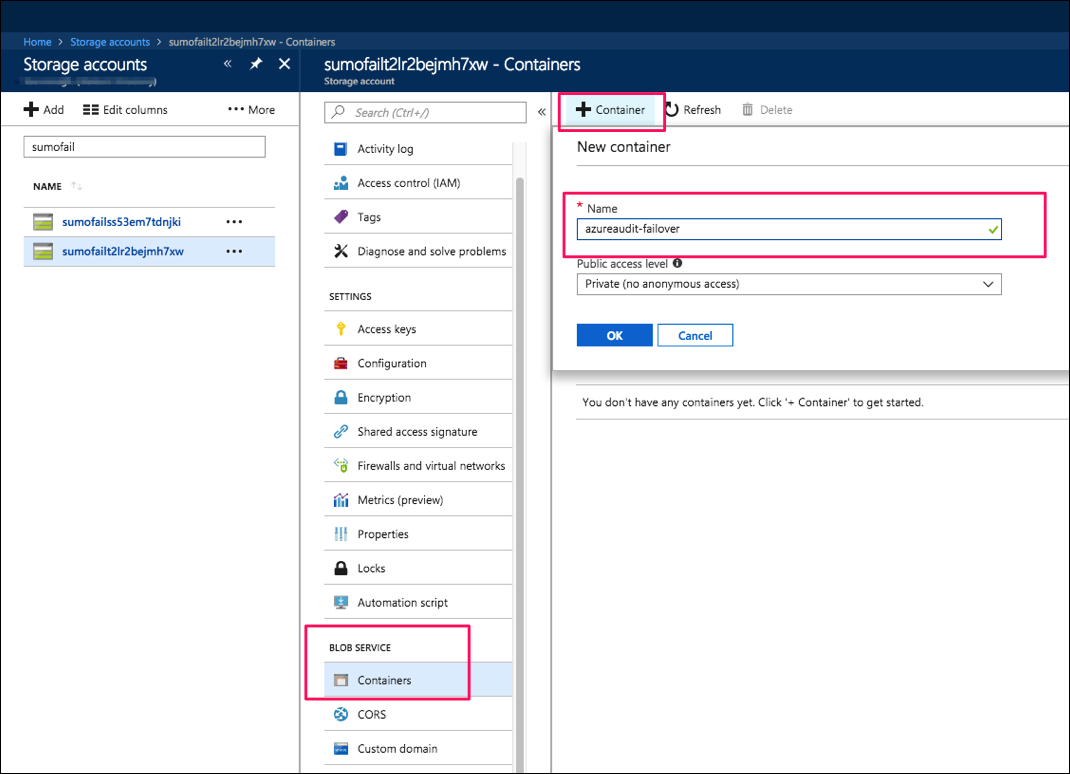
Go to Storage accounts and search for “sumometfail”. Click on
“sumometfail<random-string>”.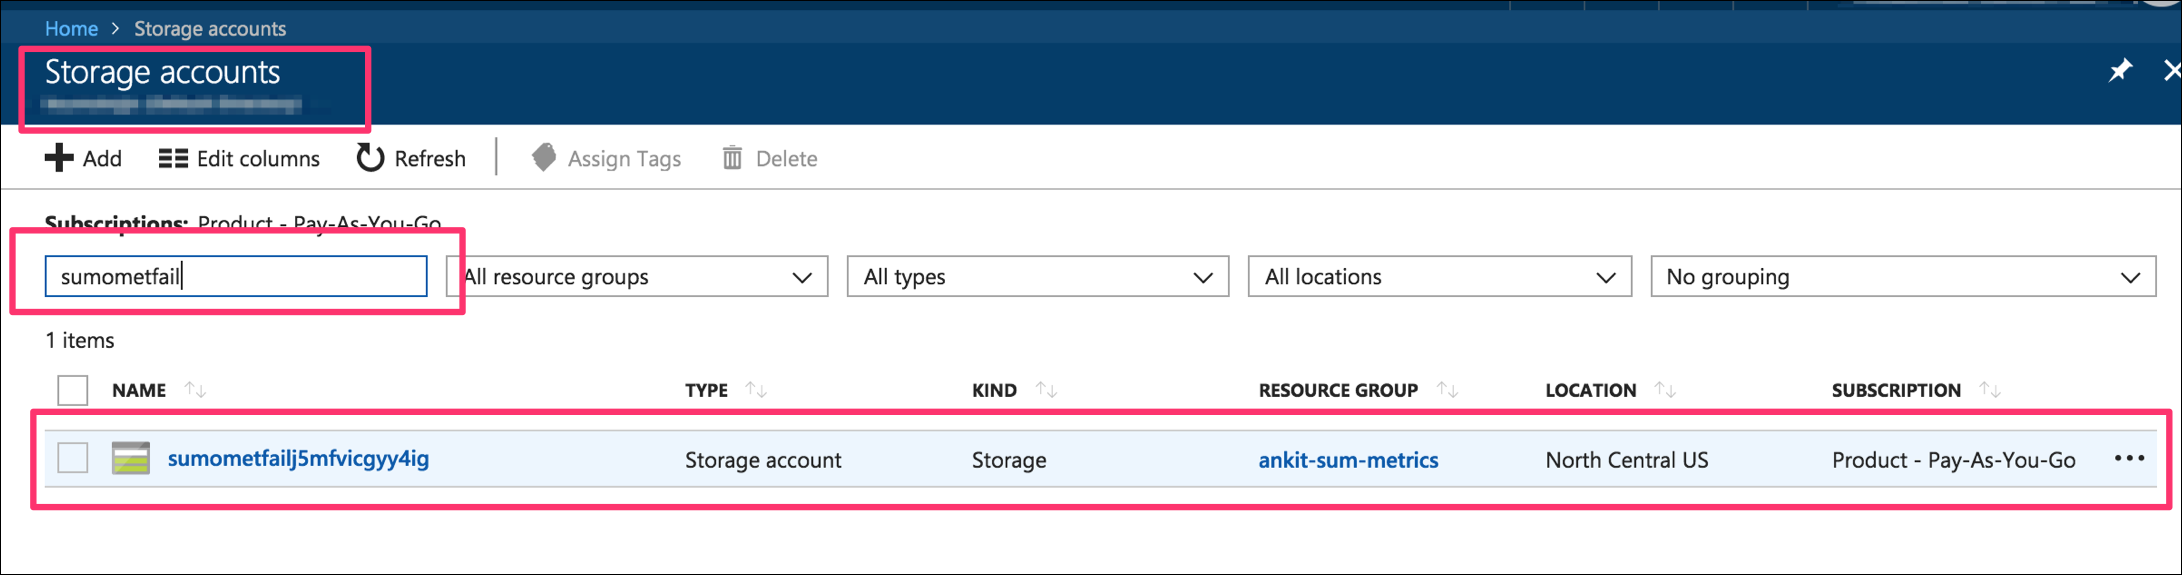
Under Blob Service, click Containers, then click + Container, enter the Name "sumomet-failover", and select "Private" for the Public Access Level. Click OK.
Step 3. Export metrics for a particular resource to Event Hub
Follow these steps to export metrics for a resource to Event Hub.
From the left pane, select ALL Services.
Search for and select "Monitor".
In the Monitor pane, select Diagnostic Settings under Settings.
Select the resource for which you want to export metrics. If diagnostics is not enabled, click Turn on Diagnostics Settings.
Once diagnostics are enabled, click Add a diagnostic setting.
The Diagnostic Settings page appears.
In the left pane:
- Enter a name for the diagnostic setting.
- Click the Stream to an event hub checkbox.
- Select Configure event hub. The right pane appears.
In the right pane:
- Choose a Subscription.
- Select
SumoMetricsNamespace<UniqueSuffix>as the event hub namespace. - Select insights-metrics-pt1m as the event hub name.
- Select an event hub policy name. You can use the default policy RootManageSharedAccessKey.
- Click OK.
- Save the Diagnostics Setting.
Troubleshooting metrics collection
If metrics are not flowing into Sumo Logic, follow the steps below to investigate the problem.
Verify Configurations
First, make sure that the resources you created above were successfully created.
Go to Resource groups, and select the resource group you created or selected in Step 2. Configure Azure resources using ARM Template. You should see the five resources you created: an App Service plan, an App Service, an Event Hubs Namespace, and two Storage accounts.

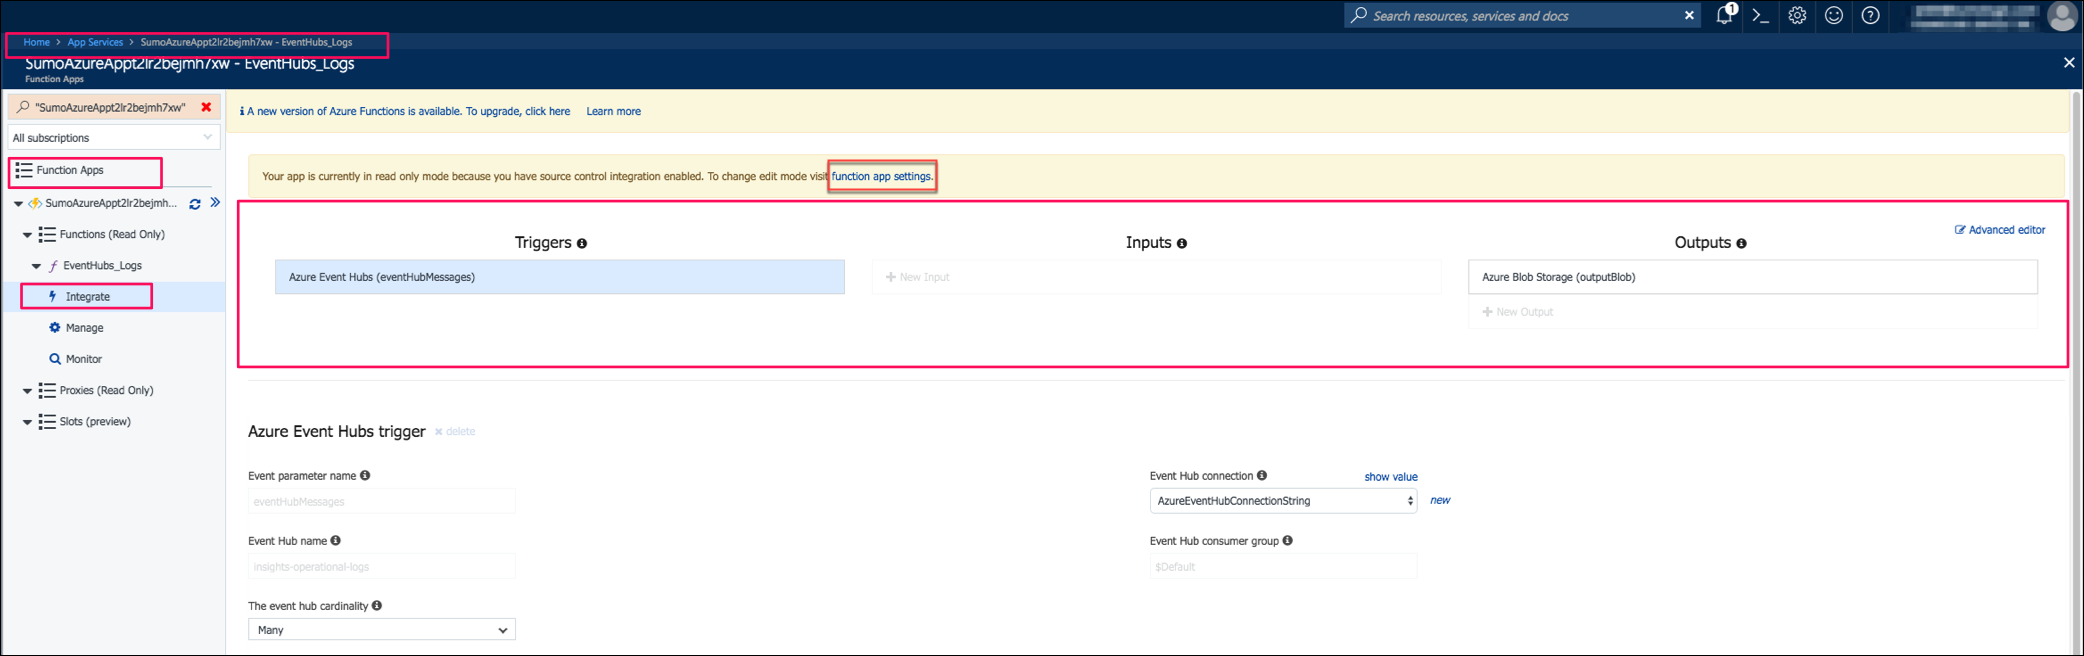
From the left pane of Azure Portal, Click AppServices, search for “SumoAzureApp”. You should find the
“SumoAzureApp<random-string>”Function App. Click it.On the Function Apps blade, click Integrate. Verify that the Triggers field value is “Azure Event Hubs” and the Outputs field value is “Azure Blob Storage”.
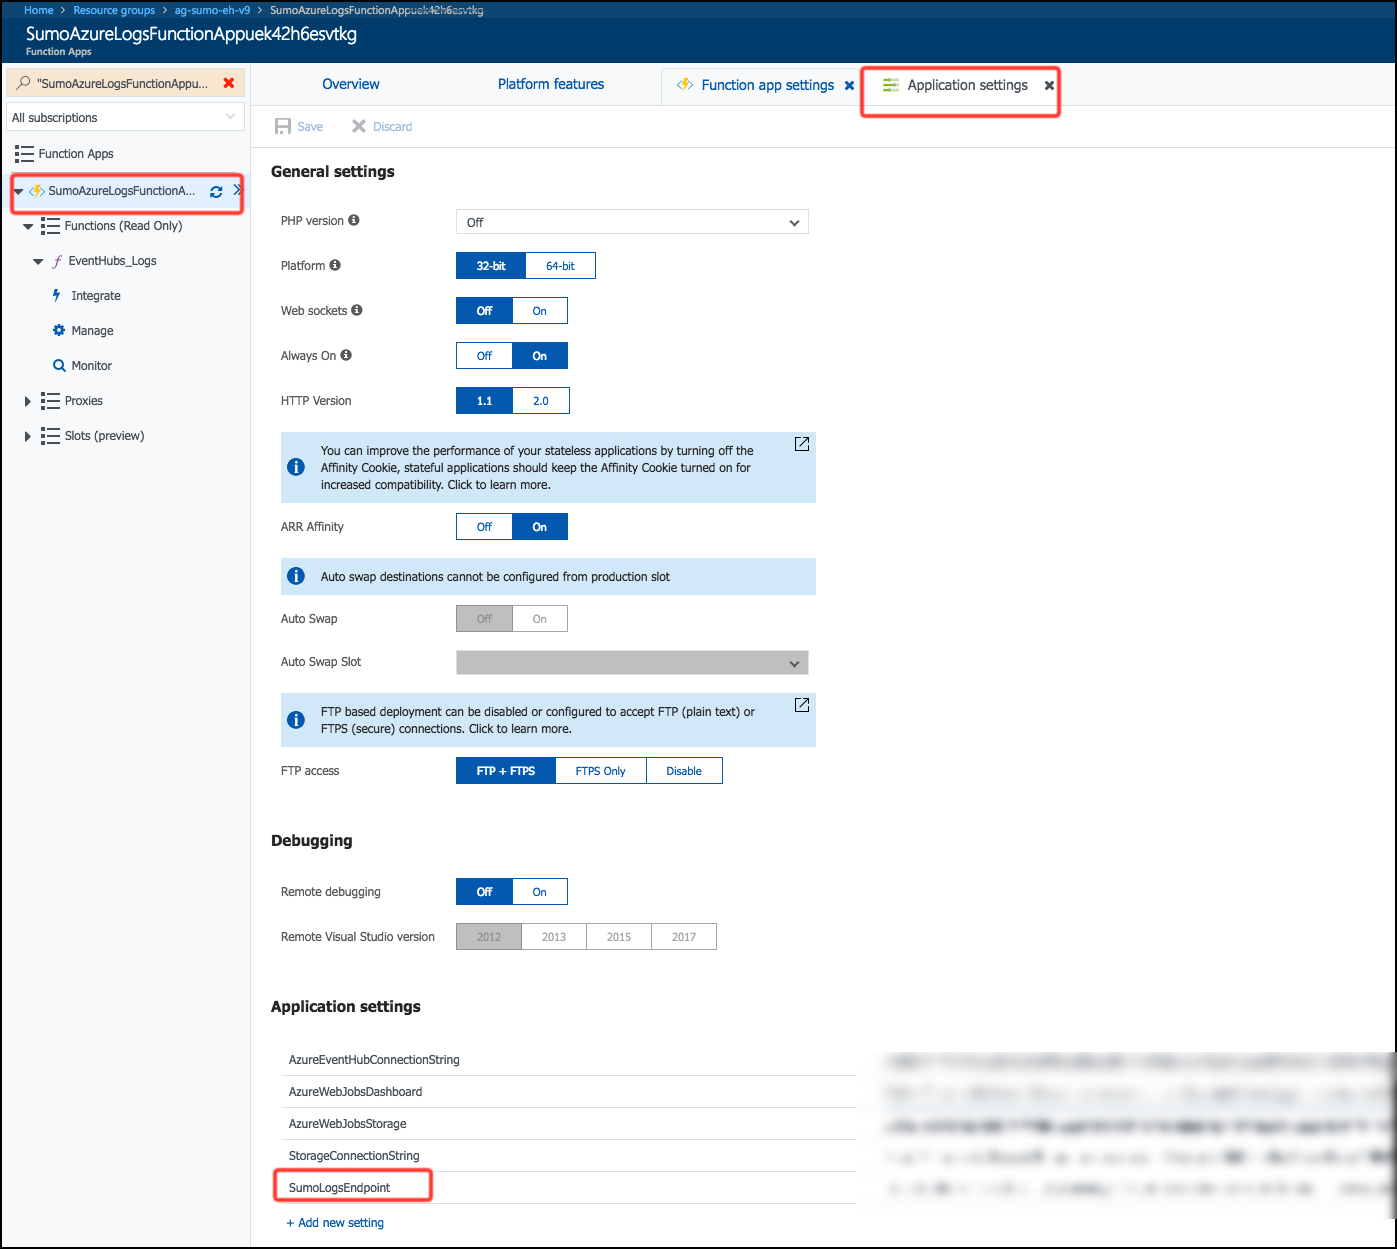
In the same window, click the function app settings link. Check that the value of the SumoAuditEndpoint field matches the HTTP source URL.
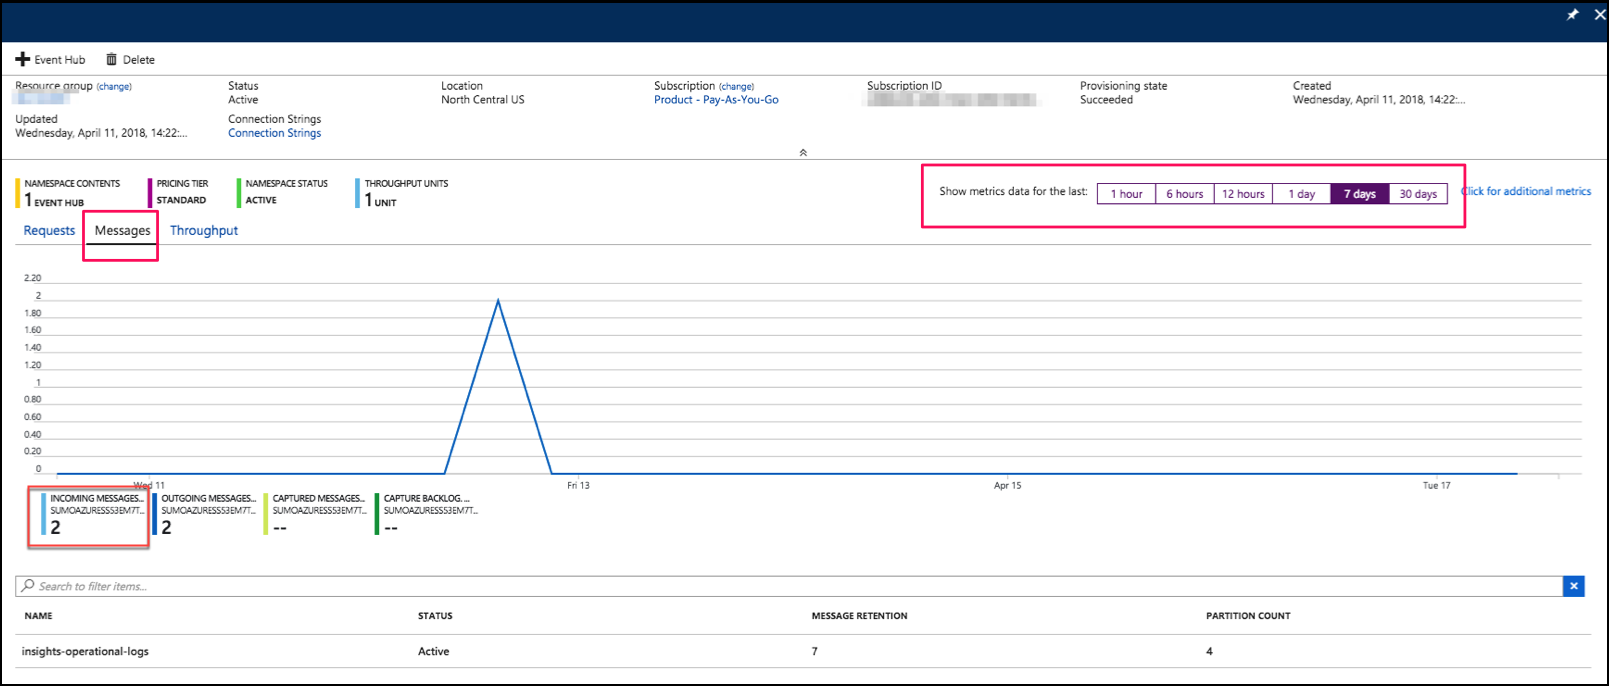
Verify Event Hub is receiving metrics
To verify that events are appearing in your event hub:
Navigate to the event hub in the Azure Portal.
Click the Messages link.
Message summary information appears below the chart. Check that the Incoming Messages count is greater than zero.