Telegraf Collection Architecture
This topic has information about using Telegraf to obtain metrics from an application and to send those metrics to Sumo Logic.
Telegraf is an open source, plugin-based collector: It uses input plugins to receive metrics from products like Redis or Nginx and output plugins to send the metrics to Sumo Logic. Input and output plugins are part of Telegraf, you simply have to configure them.
The collection architecture varies depending on whether you’re monitoring resources in a Kubernetes or a non-Kubernetes environment.
Key facts about Telegraf
Telegraf is a plugin-based agent for collecting and reporting metrics that is broadly used in monitoring pipelines because you can use it to collect from so many different applications and services.
Telegraf uses built-in input plugins to fetch metrics from the managed application or service, and output plugins to send collected metrics to another system, such as Sumo Logic.
Input plugins make Telegraf highly flexible: they can collect metrics directly from the system where Telegraf is running, pull metrics from a third party API, or use statsd and Kafka consumer services to listen for metrics. Input plugins are application-specific. For example, there are input plugins for Redis, Nginx, JMX, and so on.
Telegraf output plugins send the metrics that input plugins collect to another system. Like input plugins, output plugins are application- or service-specific. For example, there are Telegraf output plugins for Kafka, Prometheus, and of course Sumo Logic. The Sumo Logic output plugin sends the metrics collected by the input plugin to an HTTP Source running on a Sumo Logic Hosted Collector.
You can see lists of Telegraf’s built-in input plugins at https://github.com/influxdata/telegraf.
Telegraf in a non-Kubernetes deployment
The diagram below illustrates where Telegraf fits into a non-Kubernetes environment monitored by Sumo Logic. In this example, we’re running Redis on an Amazon EC2 host.
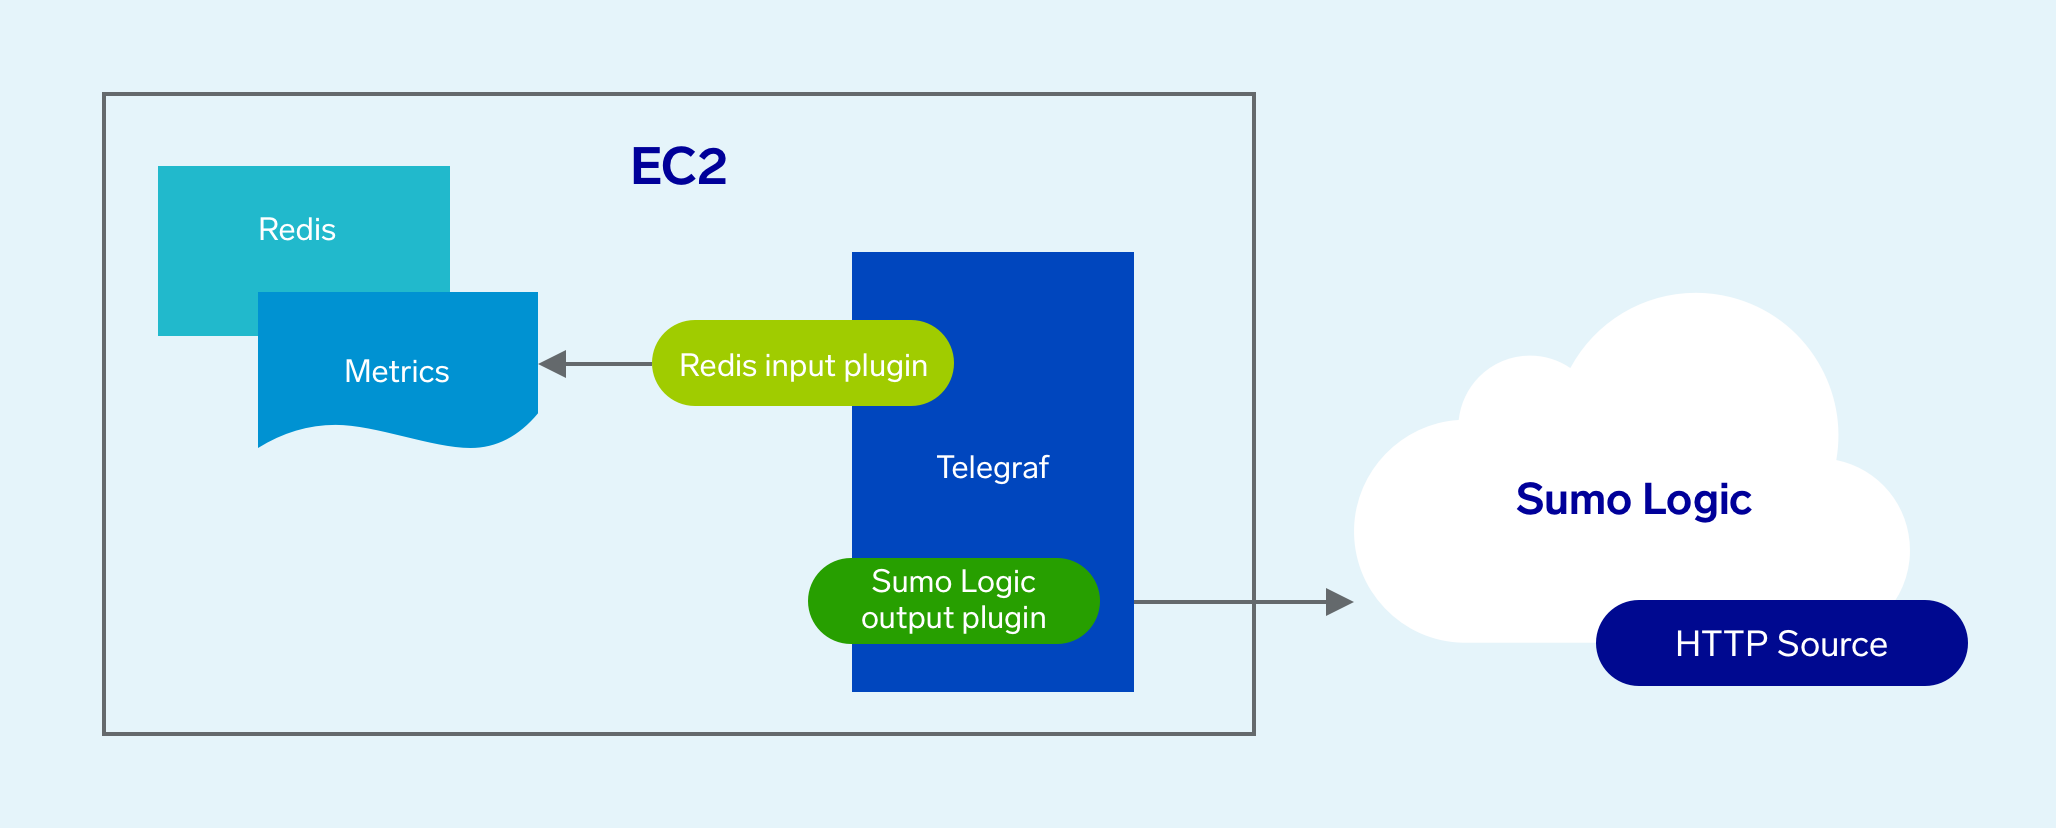
Metric collection pipeline
The metric collection pipeline for using Telegraf in a non-Kubernetes environment is simple: it’s all Telegraf. Telegraf runs on the same system as the monitored application, and uses application-specific input and output plugins to collect metrics and send them to Sumo Logic. In our example above Telegraf uses the Redis input plugin to obtain Redis metrics, and the Sumo Logic output plugin to send the metrics to Sumo Logic.
Configuration process
You install Telegraf on the system that hosts the application you want to monitor. For instructions, see Install Telegraf.
You configure the appropriate application-specific input plugin and the Sumo Logic output plugin in the Telegraf configuration file. For more information, see Configure Telegraf Input Plugins and Configure Telegraf Output Plugin for Sumo Logic.
There is one step that you’ll need to perform to enable this pipeline for some target applications. Some applications may not expose their metrics for another system to access, in which case you need to configure the application to expose the metrics so that Telegraf can collect them. For example:
- To collect metrics from Nginx, you need to configure it to expose metrics in the Nginx configuration file. For more information see the Step 2: Collect Metrics for Nginx ULM section of the Nginx app documentation.
- To collect JMX metrics from a Java application, you need to configure the application to use Jolokia, a JMX-HTTP bridge. For more information, see Step 2: Collect Metrics for JMX section of the JMX app documentation.
You select an existing HTTP Source on a Hosted Collection as the destination for the Telegraf-collected metrics, or configure a new collector and source, as desired.
Telegraf in a Kubernetes deployment
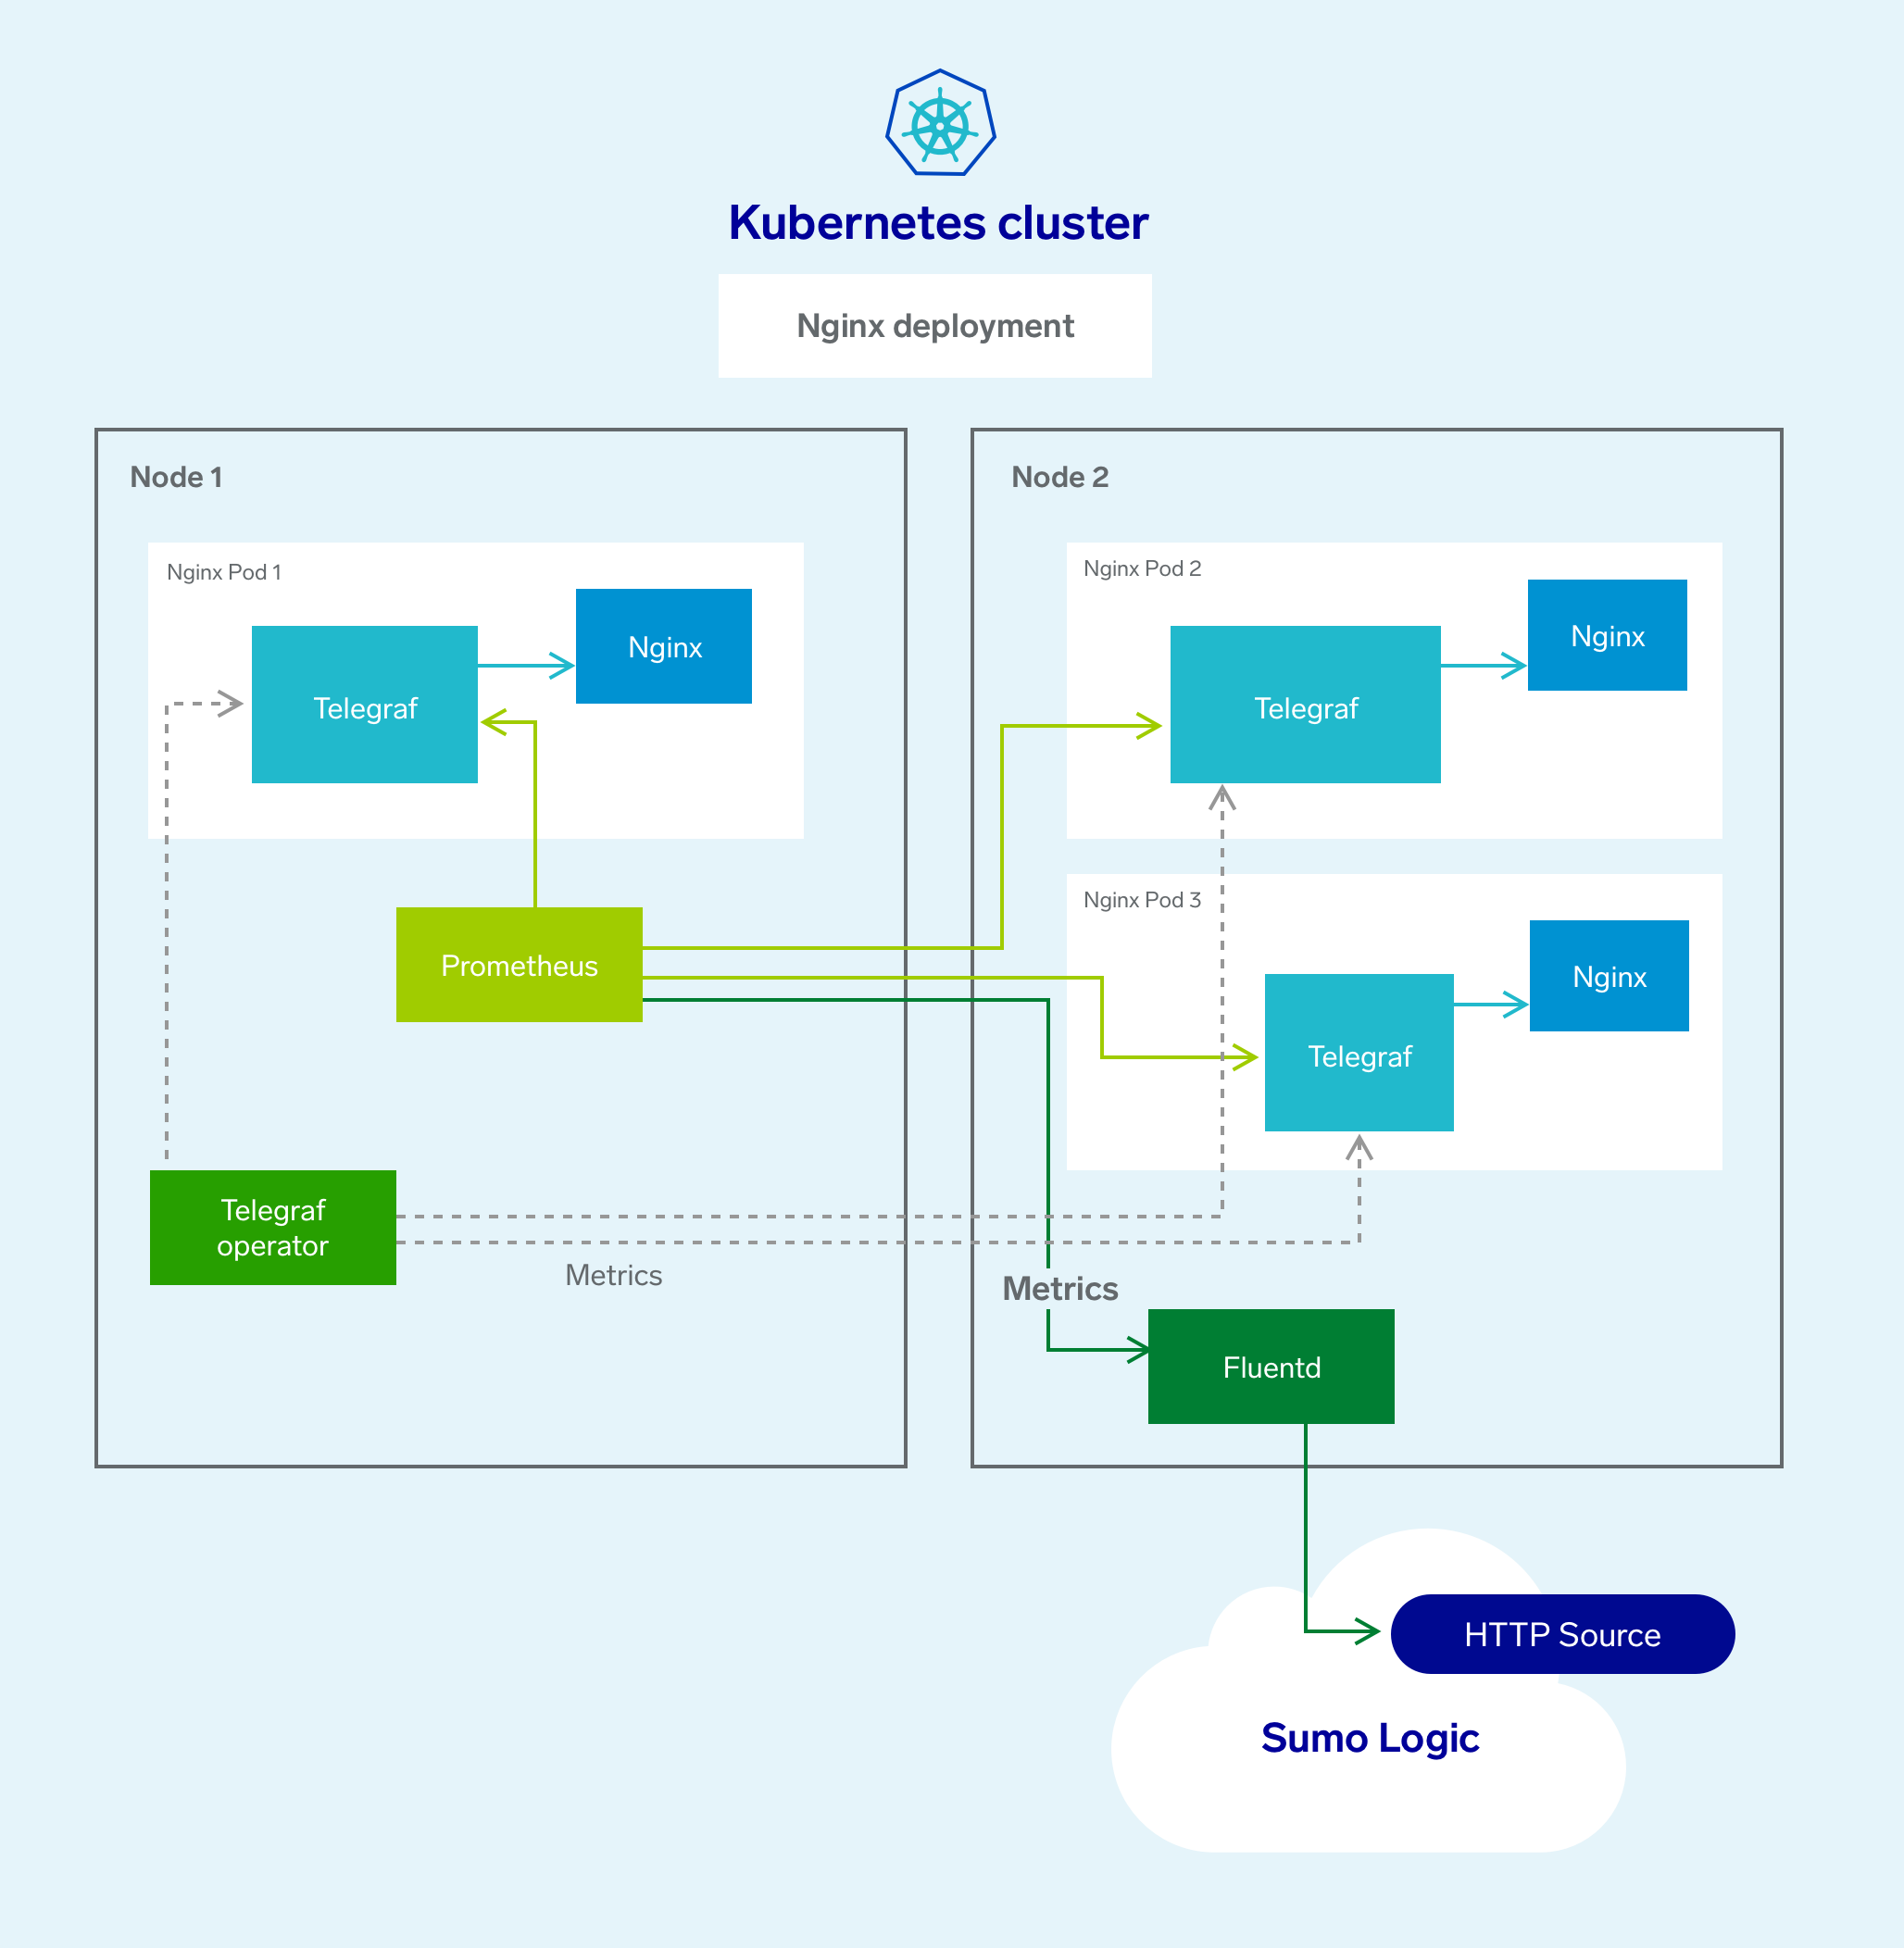
The diagram below illustrates where Telegraf fits into a Kubernetes environment monitored by Sumo Logic. In this example, we’re monitoring an Nginx deployment in a Kubernetes cluster. The cluster contains two nodes. Node 1 contains a single pod with an Nginx container. Node 2 contains two Nginx containers.
Metric collection pipeline
In the architecture shown above, there are three services that make up the metric collection pipeline: Telegraf, Prometheus, and Fluentd.
The first service in the pipeline is Telegraf. Telegraf collects metrics from Nginx. Note that we’re running Telegraf in each pod we want to collect metrics from. This is known as a sidecar deployment: Telegraf runs in the same pod as the containers it monitors. Telegraf uses an input plugin to obtain metrics, in this case, the Nginx input plugin. (For simplicity, the diagram doesn’t show the input plugins.) The injection of the Telegraf sidecar container is done by the Telegraf Operator shown above.
There is no need for the Telegraf sidecar if your application can already expose metrics in the Prometheus format. In this case, you need to configure the application so that Prometheus knows it should scrape metrics from it.
Prometheus is the next service in the pipeline—it’s job is to scrape metrics from each of the Telegraf containers. Prometheus knows what to scrape and how by referring to Kubernetes prometheus.io annotations attached to the pods in the cluster. Prometheus sends the metrics to Fluentd using the remote write capabilities of Prometheus.
Fluentd runs on one of the nodes in the cluster, and listens on its TCP port for metrics from Prometheus. Fluentd enriches the metrics with metadata and sends the metrics to an HTTP Source running on a Sumo Logic Hosted Collector.
The Sumo Logic Helm chart for Kubernetes collection packages all of these components up as part of the collection process for the Sumo Logic Kubernetes Solution.
Configuration process
To collect metrics from applications from any of the supported input plugins in Telegraf, you simply need to install the Sumo Logic Helm Chart for Kubernetes. (For the uninitiated, Helm is a Kubernetes package and operations manager.) Helm charts greatly simplify the process of deploying components to Kubernetes environments.
One item on the collection diagram we have talked about is Telegraf Operator. Why is it there? This relates to a key challenge of monitoring a Kubernetes environment, which is its dynamic nature: pods come and go, IP addresses change, and so on. The monitoring challenge is how will our metrics collector know the current state of the cluster? What pods are present? What are their IP addresses? In this configuration, Telegraf Operator handles the dynamic nature of a Kubernetes cluster. Telegraf Operator defines a common output destination for all collected metrics and configures Sidecar monitoring on application pods using annotations. More specifically, Telegraf Operator notices that pods have the annotations, and injects a Telegraf container to each. The annotations on the pods provide the instructions for the operator to configure each Telegraf sidecar.
First step, set up Kubernetes collection with Helm, as described on https://github.com/SumoLogic/sumologic-kubernetes-collection/blob/main/docs/installation-with-helm.md.
It’s easy to add Telegraf Operator to your Kubernetes deployment: you simply add an annotation, telegraf-operator.enabled=true, to your Kubernetes Helm chart, which will install the Telegraf operator in your cluster.
How do the metrics get to Sumo Logic? Prometheus gets the metrics from Telegraf. It knows how to connect to Telegraf via annotations that are added to the pods Telegraf collects from. We preconfigure Prometheus to get the metrics. Prometheus sends metrics to Fluentd, which sends the metrics on to the HTTP Source.
For example, suppose you are running Nginx in your Kubernetes cluster, and you have enabled the status module for Nginx. Adding the following to the Nginx deployment results in the annotation being added to each pod in the deployment. The following annotation instructs the Telegraf Operator to configure an Nginx input for telegraf to read those metrics.
telegraf.influxdata.com/inputs: |+
  [[inputs.nginx]]
    urls = ["http://localhost:8080/stub_status"]
In addition, add these annotations to tell Telegraf to make its metrics available to Prometheus, and instruct Prometheus to discover the metrics.
telegraf.influxdata.com/class: sumologic-prometheus
prometheus.io/scrape: "true"
prometheus.io/port: "9273"