This is a 2021 archive of Service Release Notes. The current Service Release Notes are here.
December 17, 2021 (Search)
New - Keyboard shortcuts are now available to generate comments in Search queries. Use command + / on macOS or control + / on Windows.
December 9, 2021 (Collection)
New - Our Cloud-to-Cloud Integration Framework has a new Source. The Google Workspace Source collects data from the Google Workspace Users API.
Update - The Okta Source, in addition to System Log data, now supports collecting User Inventory data.
November 30, 2021 (Apps)
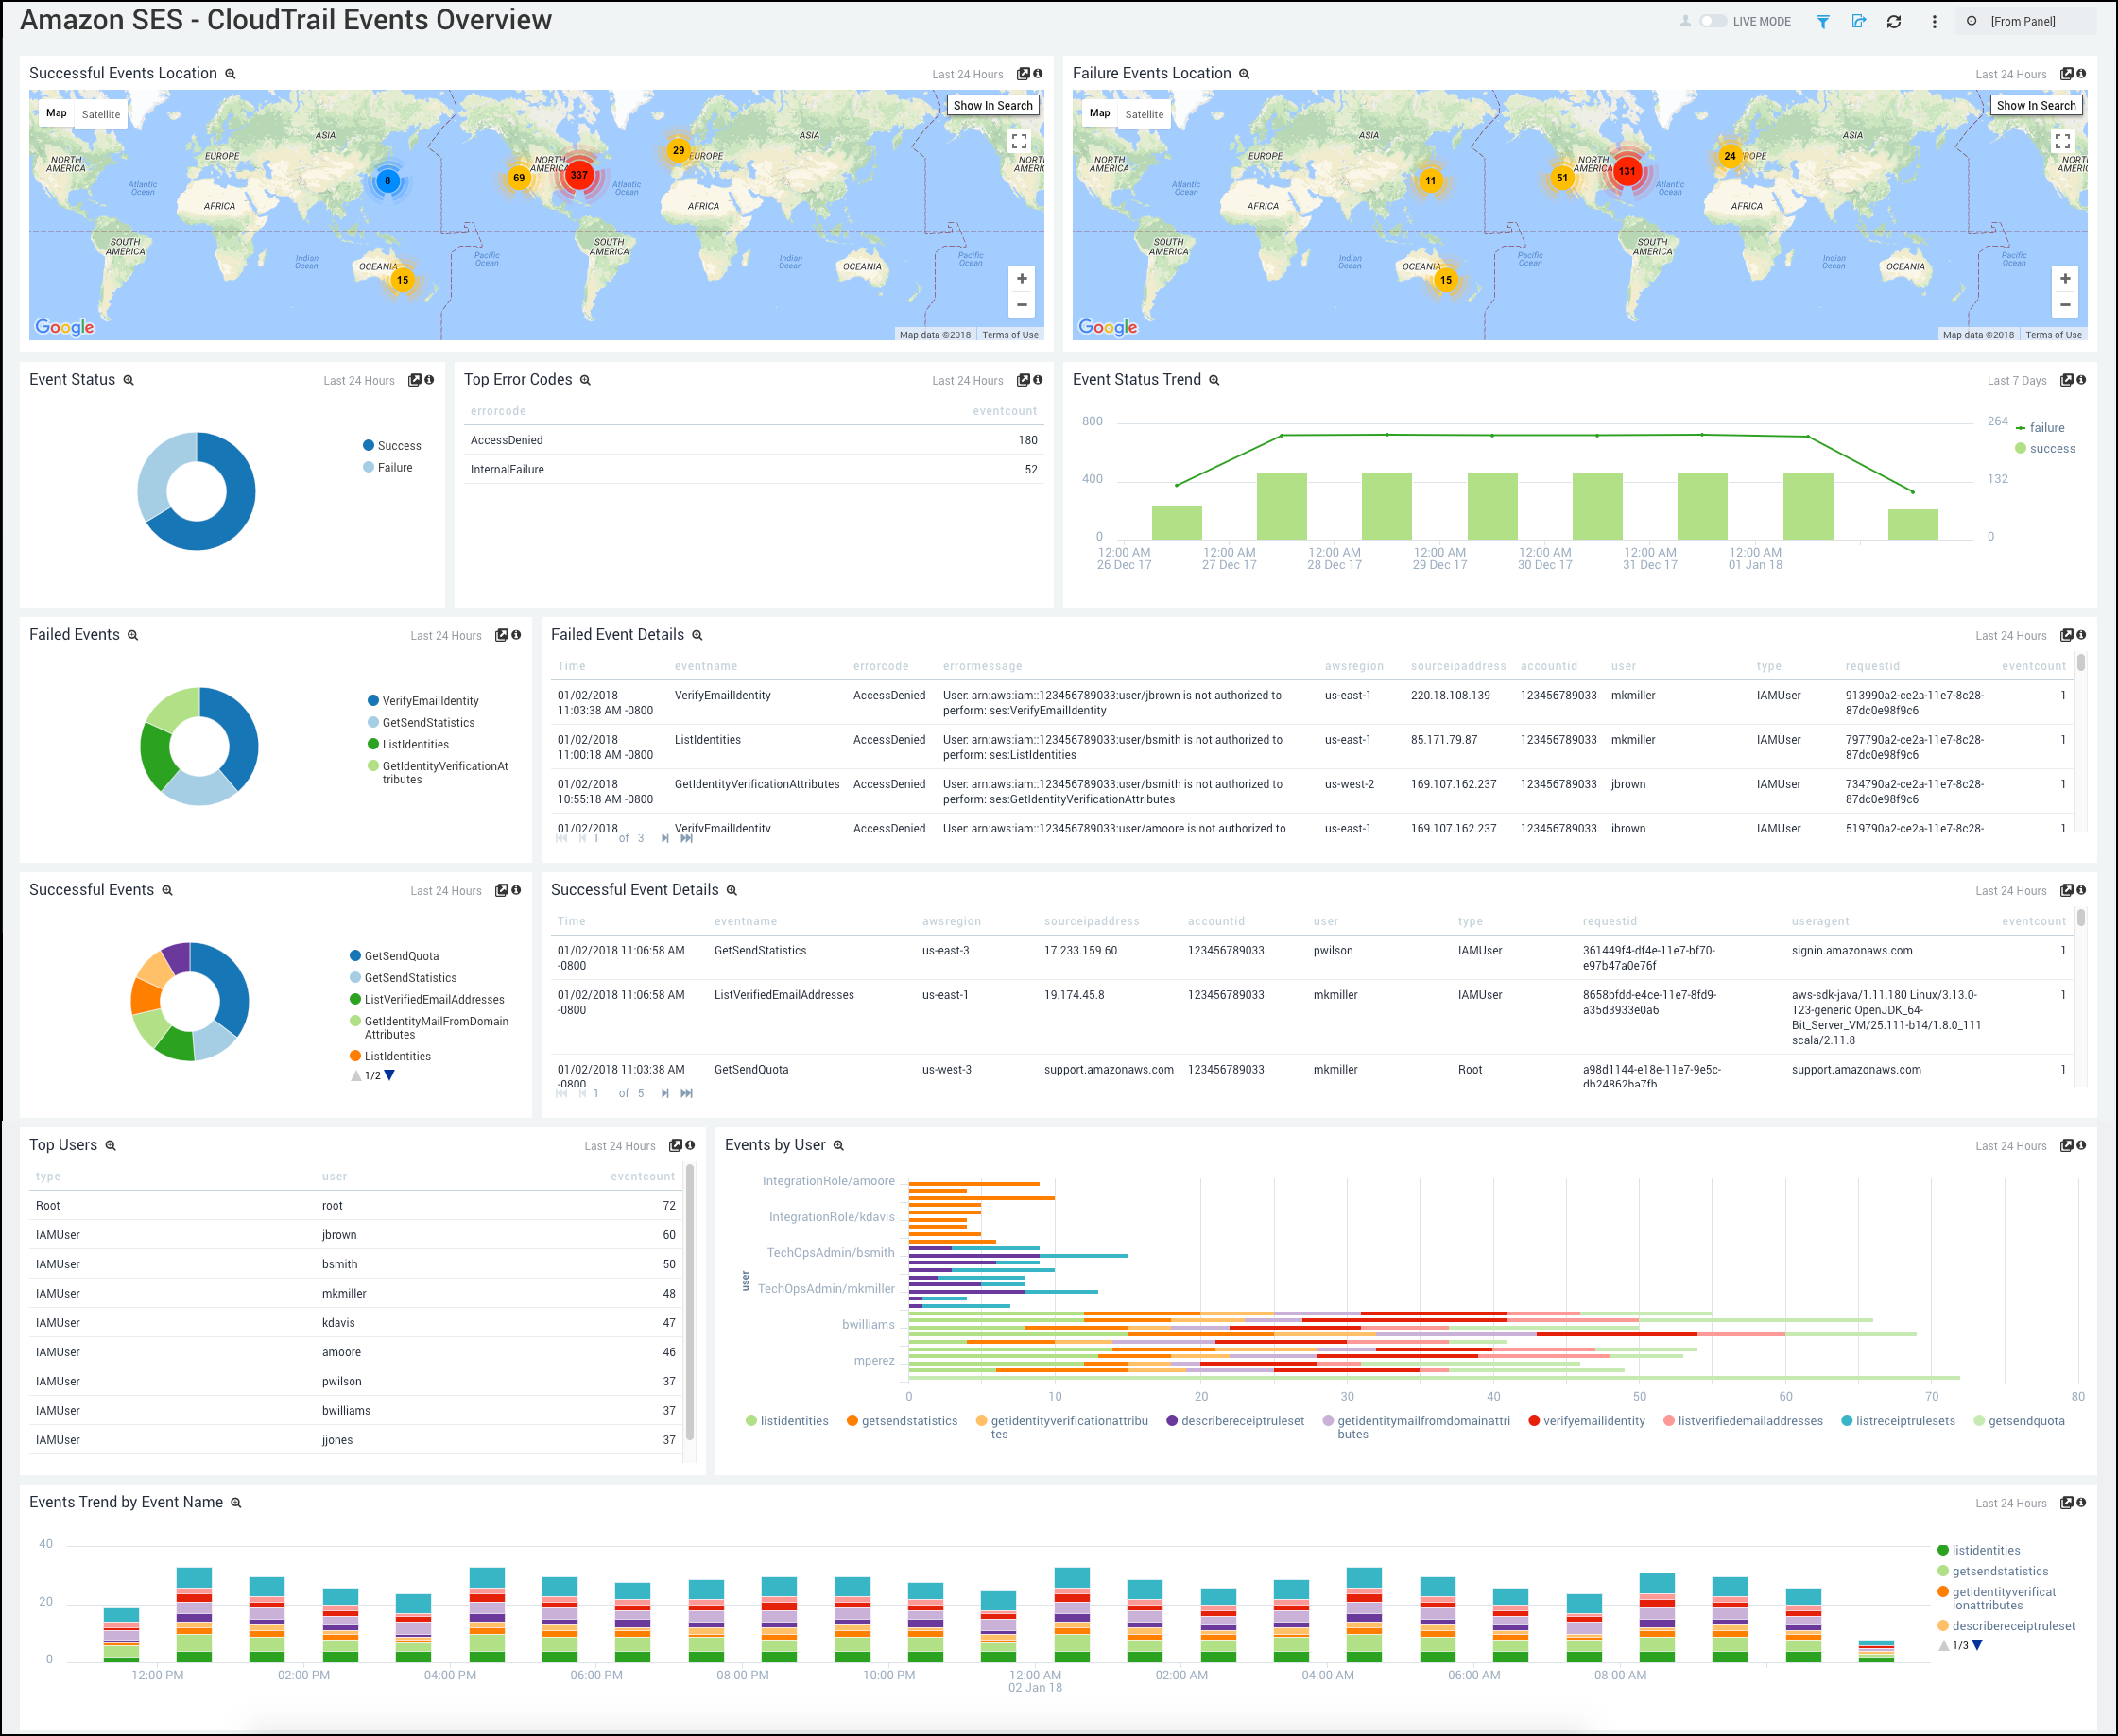
New - As an integration partner with Amazon, we are pleased to announce our new Amazon Inspector App. Amazon Inspector is an automated vulnerability management service that continually scans Amazon EC2 and container images for software vulnerabilities and network exposures. The Sumo Logic Inspector App helps reveal trends and identify anomalies from these findings.
November 18, 2021 (Apps)
New version - We are excited to announce the GA release of the updated Data Volume App. This release provides our customers an ability to view and track account usage for Traces, Cloud SIEM Enterprise, and Data Tiers. In addition to this customers will also be able to track usage in both native units as well as Sumo Logic credits. We have enhanced the existing "sumologic_volume" index and added new index categories for these key capabilities.
November 18, 2021 (Search)
Update - The fillmissing operator has a few improvements:
- Timeslice granularity is automatically defined based on the time used in the timeslice operator.
- Values has an all option that uses all the distinct values for the field from the query results.
- A new takeLast option can fill in values for non-key fields by taking the value from the previous timeslice.
November 17, 2021 (Monitors)
Update - Monitor auto resolution is now supported with generic webhooks and Lambda connections.
November 9, 2021 (Software Development Optimization)
New - The Software Development Optimization (SDO) solution offers integrations for Gitlab and CircleCI to monitor SDLC processes. This integration provides set up, configuration, and Field Extraction Rules (FERs), no longer requiring customers to create their own integrations and FERs. For details, see Set up the Software Development Optimization Solution guide for manual and Terraform instructions.
November 5, 2021 (Monitors)
Update - Monitors now offer an option to set an evaluation delay that offsets when the Monitor executes. This option allows you to account for any delays in ingestion, ensuring the Monitor only evaluates complete data.
October 29, 2021 (Monitors)
Update - Enterprise accounts can now have up to 1,000 Log Monitors. Previously they supported up to 300.
October 28, 2021 (Collection)
New - Our Cloud-to-Cloud Integration Framework has a new Source. The SentinelOne Mgmt API Source collects data from the SentinelOne Management Console.
Update - The Mimecast Source, in addition to SIEM data, now supports collecting DLP, Audit, and Hold Message List data from the Mimecast API.
October 27, 2021 (Traces)
New - Build custom Dashboards with new panels to view Service Maps filtered by service and application and Trace Lists filtered by a query to directly access trace views. Add panels to existing or new dashboards, setting filters and customized options.
October 27, 2021 (Apps)
New - We are excited to release the Sumo Logic GitLab app. The GitLab app allows you to can gain insights into the health of builds, deployments, pull requests, commits, and more to quickly understand which teams and processes need help to increase velocity and quality.
New - We are excited to release the Sumo Logic Host and Process Metrics app. The Sumo Logic App for Host and Process Metrics allows you to monitor the performance and resource utilization of hosts and processes that your mission critical applications are dependent upon. Preconfigured dashboards provide insight into CPU, memory, network, file descriptors, page faults, and TCP connectors. This app uses Telegraf, an open-source, plugin-based collector for the collection of both host and process metrics data.
Update - We are delighted to announce the availability of additional Logs and Metrics dashboards added for the Sumo Logic app for Istio. The Sumo Logic App for Istio provides visibility into the health and performance of Istio and its control plane components, including Mixer, Galley, Citadel, Pilot, and Envoy. The app dashboards also allow you to monitor how services and applications are performing in Istio Mesh, providing insights into service latency, errors, network traffic, and request workloads.
Update - We are pleased to release the additional Logs and Metrics dashboards added for the Sumo Logic app for HAProxy. HAProxy is a unified logs and metrics app that helps you monitor the availability, performance, and health of your HAProxy cluster. Preconfigured dashboards provide insights into active servers, visitor locations, sessions, errors, response time, and throughput.
Update - We are happy to announce the availability of additional Logs and Metrics dashboards added for the Sumo Logic Cassandra app. The Apache Cassandra is an open source NoSQL distributed database with high scalability and availability without compromising performance.
Update - We are delighted to announce the availability of additional Logs and Metrics dashboards added for the Sumo Logic Elasticsearch app. The Elasticsearch app is a unified logs and metrics app that helps you monitor the availability, performance, health, and resource utilization of your Elasticsearch clusters. Preconfigured dashboards provide insight into cluster health, resource utilization, sharding, garbage collection, and search, index, and cache performance.
Update - We are excited to release the additional Logs and Metrics dashboards added for the Sumo Logic Memcached app. The Memcached app is a unified logs and metrics app that helps you monitor the availability, performance, health, and resource utilization of your Memcached clusters. Preconfigured dashboards provide insight into uptime, operational metrics, cache performance, resource utilization, errors, warnings, and commands executed.
Update - We are pleased to announce the availability of additional Logs and Metrics dashboards added for the Sumo Logic ActiveMQ app. The ActiveMQ app is a unified logs and metrics app that helps you monitor the availability, performance, health, and resource utilization of your ActiveMQ messaging clusters. Preconfigured dashboards provide insight into cluster status, nodes, producers, consumers, destinations, resource utilization, message rates, and error logs.
Update - We are delighted to release the additional Logs and Metrics dashboards added for the Sumo Logic Akamai app. The Akamai SIEM API Source provides a secure endpoint to receive security events generated on the Akamai platform by leveraging the V1 SIEM API. It securely stores the required authentication, scheduling, and state tracking information.
October 14, 2021 (Traces)
New - Operation level health metrics describe performance and availability on the level of a single SQL query or API call. They are automatically generated from tracing data real time for the most active operations, enabling you to understand application service health on one level below: what operations is this service executing towards its peers and what's the performance of each of them individually. See Service Map and Dashboards.
October 6, 2021 (Collection)
Update - The Symantec Web Security Service Source now always uses structured logs to reduce errors and improve collection performance.
September 30, 2021 (Traces)
New - Lambda instrumentation for Java, NodeJS, and Python provides managed layers available directly from your AWS Lambda layer repository. Configure your Lambdas to attach to the layer appropriate for your language and enjoy new visibility in Sumo Logic. Lambda calls appear just as any other spans in your traces, providing immediate insights into Cloud Watch metrics related to this Lambda.
September 28, 2021 (Monitors)
New - Troubleshooting production issues is even more challenging with modern distributed applications. With our new alert response feature, your on-call teams can now also leverage curated insights that will help them get to the root cause quickly. The feature generates relevant insights as a context card using Sumo analytics to track what's occurring in your applications, helping your teams troubleshoot faster.
September 27, 2021 (Dashboard (New))
New - You can now easily share a snapshot of a Dashboard (New) with the new ability to export in PDF or PNG format.
September 24, 2021 (AWS Observability Solution)
Update - The AWS Observability Solution 2.3.0 release includes the deployment of the AWS Observability Solution using a Terraform script. This update also includes options for streamlined deployment to multiple AWS accounts and regions, dashboard changes, and bug fixes. Update to the latest version to take advantage of these features.
September 22, 2021 (Collection)
New - Our Cloud-to-Cloud Integration Framework has a new Source. The Cybereason Source provides a secure endpoint to receive authentication logs from the Cybereason Malops API.
September 20, 2021 (Manage)
New - You can now forward aggregate data from a Scheduled View to AWS S3. Previously, aggregate data was dropped and not included in forwarded file objects. Now, aggregate fields are automatically appended when your Scheduled View conducts aggregation.
September 15, 2021 (Collection)
New - Our Cloud-to-Cloud Integration Framework has a new Source. The Proofpoint On Demand Source collects data from the Proofpoint on Demand (PoD) Log Service.
September 14, 2021 (Search)
New - Search now provides Basic Mode, an easy-to-use, structured query builder to help you write and complete simple log searches quickly and easily. This mode is designed for new users that are not familiar with Sumo Logic search features and query language.
September 9, 2021 (Collection)
Update - The AWS S3 Source has the ability to collect objects from AWS S3 buckets that don't have versioning enabled and you cannot provide the ListObjectVersions permission, such as Cisco Umbrella. There is now a radio button with the option to have the Source use AWS versioned APIs.
September 7, 2021 (Search)
New - Search has several improvements to give you a cleaner experience. We've moved the search options to a menu and changed the look of search settings. See how to use the search page for details on the new layout.
September 1, 2021 (Alerts)
New - Our monitor capabilities provide a new alerting framework to support anomaly-based alerting for both logs and metrics data sources. It's a more flexible alert system, better equipped to identify true outliers in your ever changing environment and you can find it in Alerts > Monitors.
Anomaly-based alerting does not require a static alert threshold, offering a more flexible way to determine outliers in your data. Our system automatically creates dynamic baselines, and alerts the user, when there is an abnormal trend in the alerting KPI compared to its historic behavior.
You should definitely try out the new outlier support in monitors if you have custom KPIs that constantly change over time such as requests, latency, and errors. These KPIs constantly change based on external and internal factors such as changes in customer usage patterns, code changes, and feature releases.
August 27, 2021 (Manage)
New - We're making Cloud Flex Credits Subscriptions available to self-service trial and free accounts with new monthly and annual subscriptions. Customers who upgrade to a self-service paid subscription from a Trial, POV Trial, or Sumo Free subscription will now upgrade directly to Essentials (credit-based), and have the option of either an annual or monthly subscription. For more information, see Upgrade a Cloud Flex Credits Account.
August 24, 2021 (Search)
New - We've improved the style of our search tabs and added a lot of new functionalities.
- You can resize and reorder columns.
- Added keyboard accessibility.
- You can pin columns in the Aggregate tab.
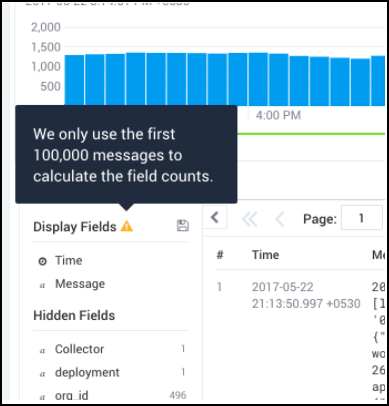
- The Messages tab now supports context menu options to copy the full message and expand or collapse rows.
- The Aggregates tab now supports context menu options to copy or modify your query based on your results.
- Page limit increased to 500.
- Tabs load faster.
August 23, 2021 (Apps)
New - Cyral enables teams to observe, protect, and control their databases, data pipelines, and data warehouses by intercepting requests in real-time, without impact to performance or scalability. The Cyral App for Sumo Logic provides dashboards and visualizations for Cyral customers that have chosen to send their logs to the Sumo Logic platform.
New - Tessian is the world's first Human Layer Security company that uses data science and machine learning to automatically stop data breaches and security threats caused by human errors. The Sumo Logic App for Tessian provides visibility into human layer risk drivers and easy access to cyber security events prevented based on Tessian data feeds across all modules - Defender, Guardian, Enforcer, and Constructor.
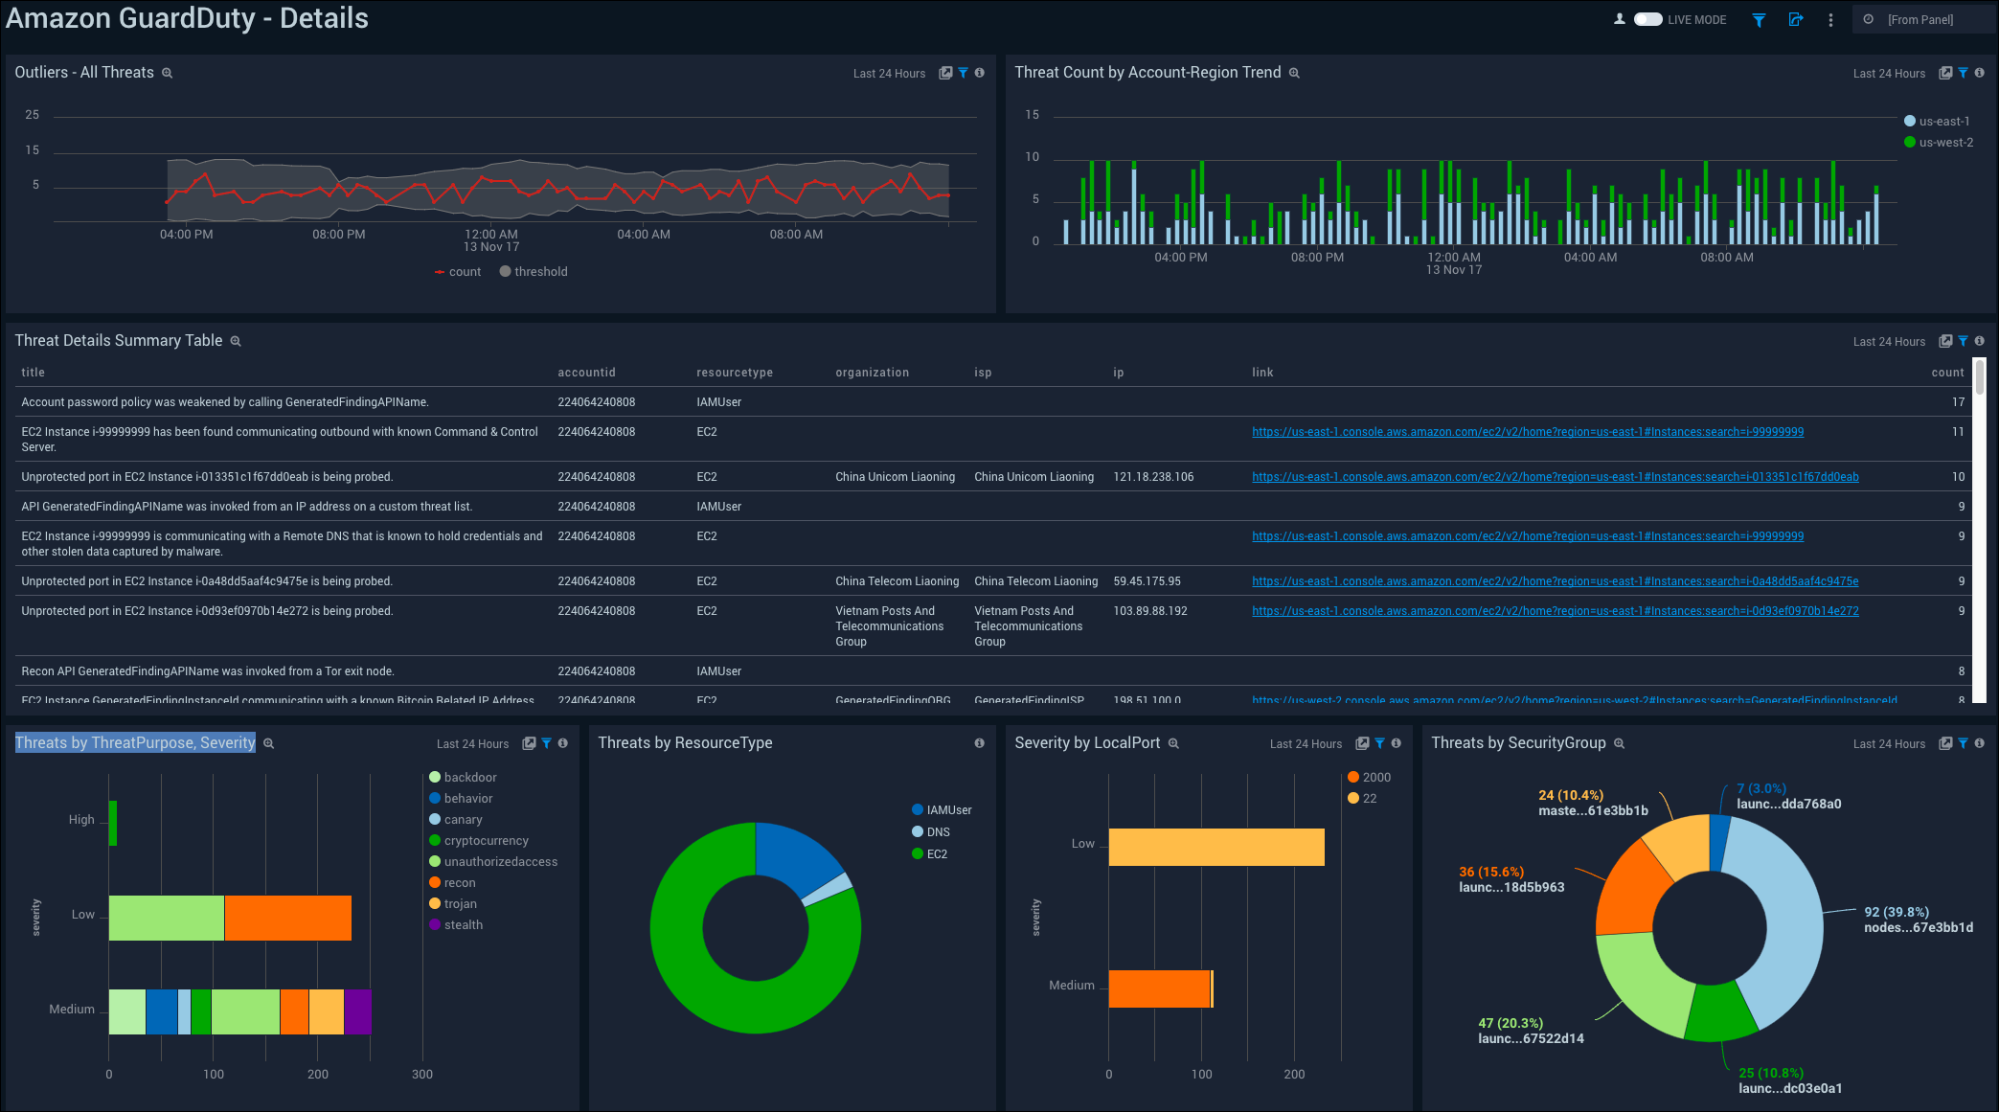
New - We are excited to release the Sumo Logic Amazon GuardDuty - Cloud Security Monitoring and Analytics app. The focus of GuardDuty is on protecting AWS accounts, workloads, and data with intelligent threat detection. The corresponding Sumo Logic dashboards are designed to surface the most relevant security insights from that data to yield actionable processes to tackle specific security concerns within your AWS infrastructure. Utilizing this app allows you to stay ahead of changing attack surfaces in a repeatable way via cloud security monitoring and analytics dashboards that provide operational security awareness for AWS GuardDuty data sources.
New - We are excited to release the Sumo Logic AWS Security Hub - Cloud Security Monitoring and Analytics. The Sumo Logic AWS Security Hub app is designed to extract key findings from the AWS Security Hub, which is designed to centrally view and manage security alerts and automate security checks. The additional level of analysis within these dashboards surfaces the most relevant findings and takes a focused approach to improve overall security posture. Finding types and severity levels act as leading indicators for security engineers to go into security incidents with the most relevant technical details to address active threats.
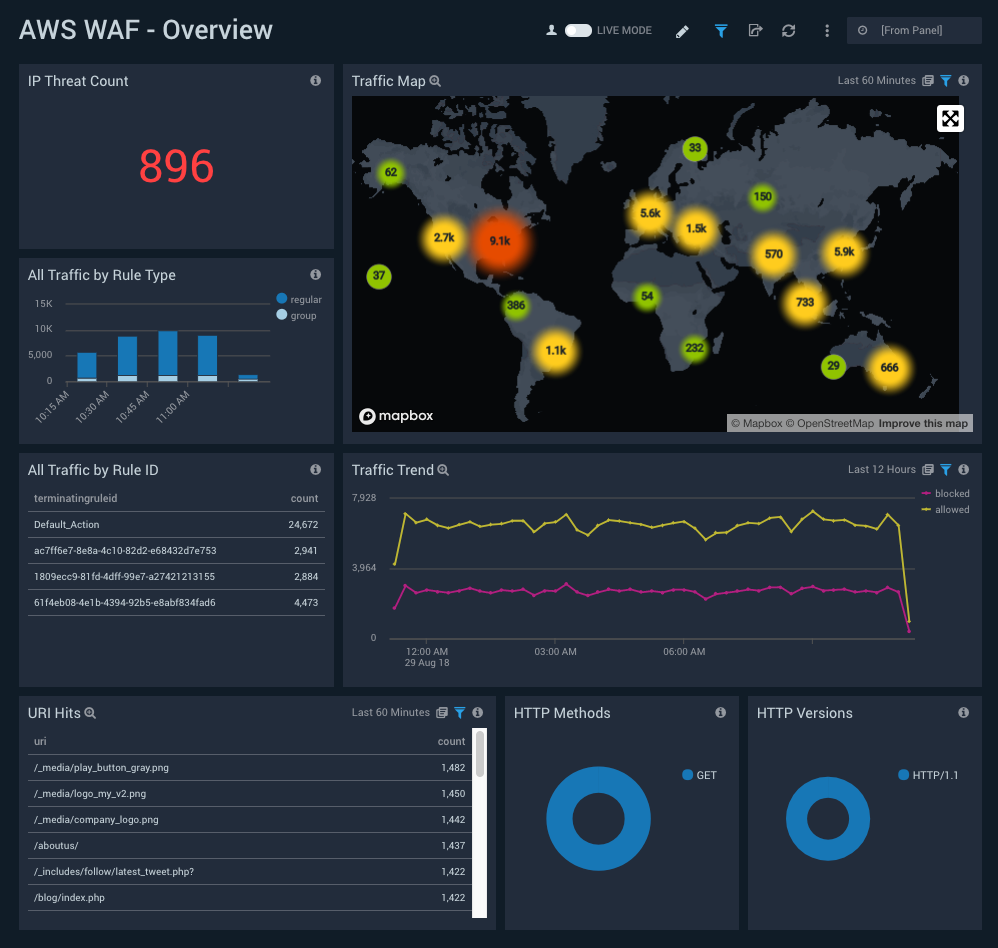
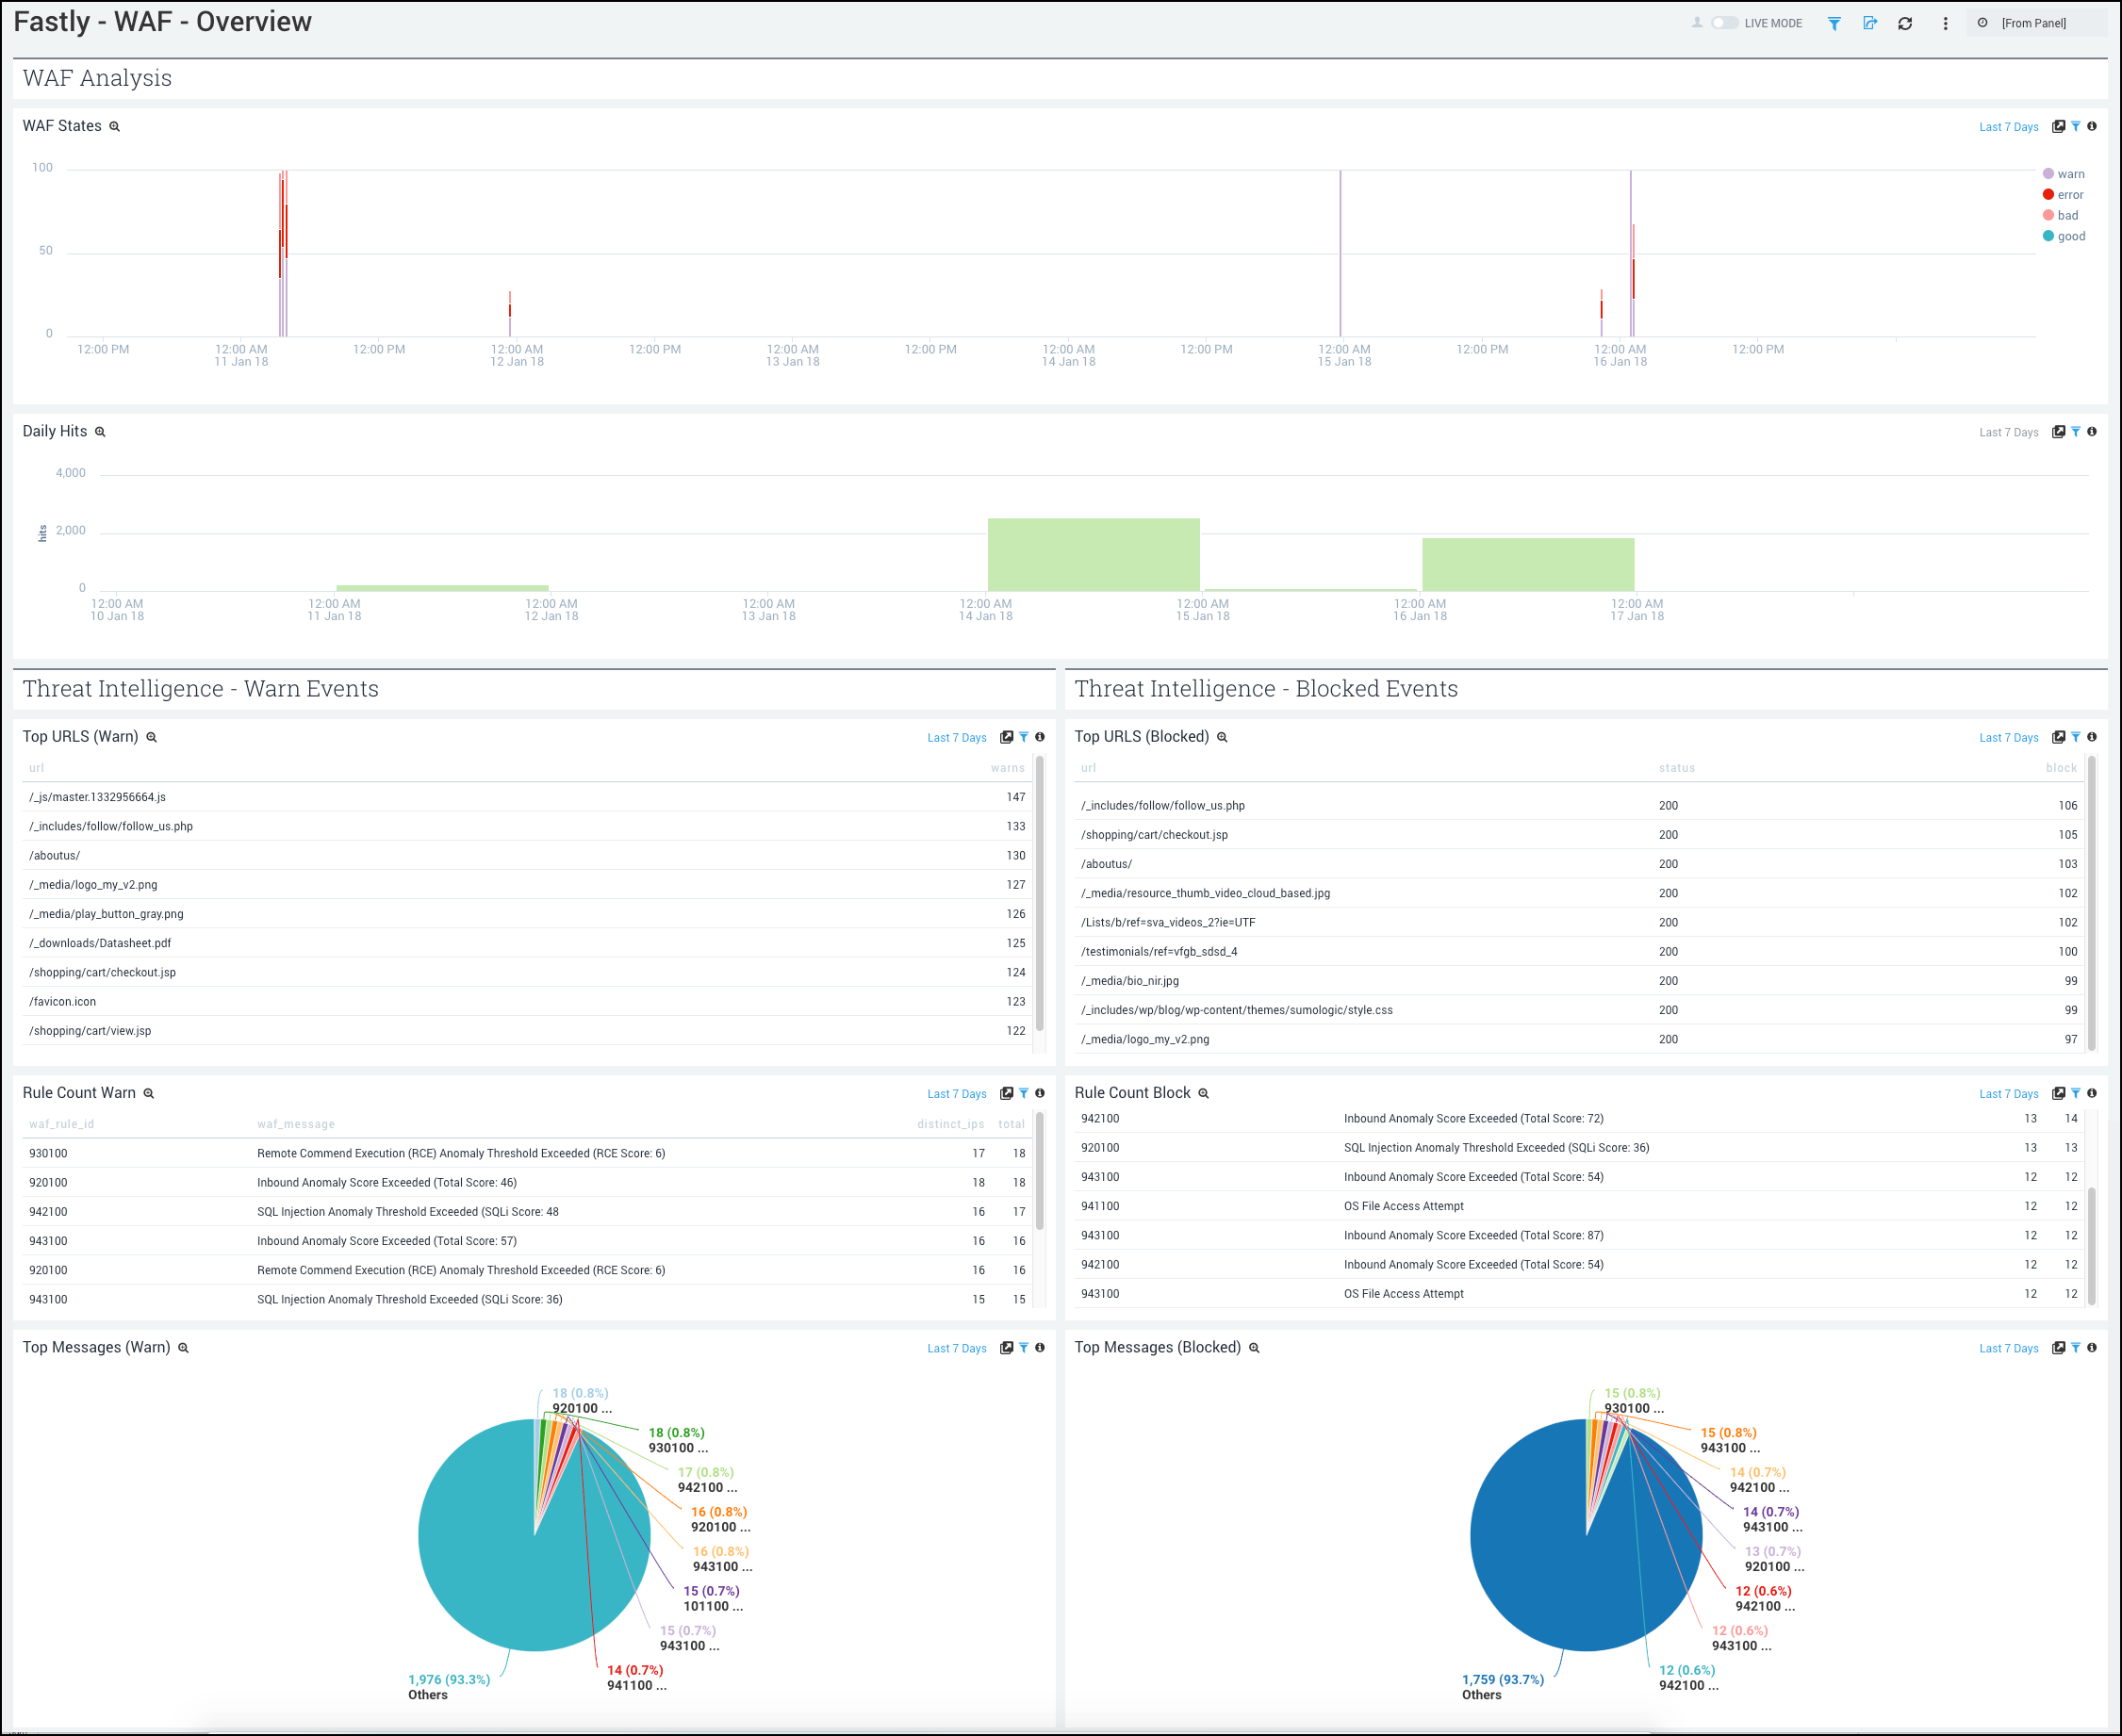
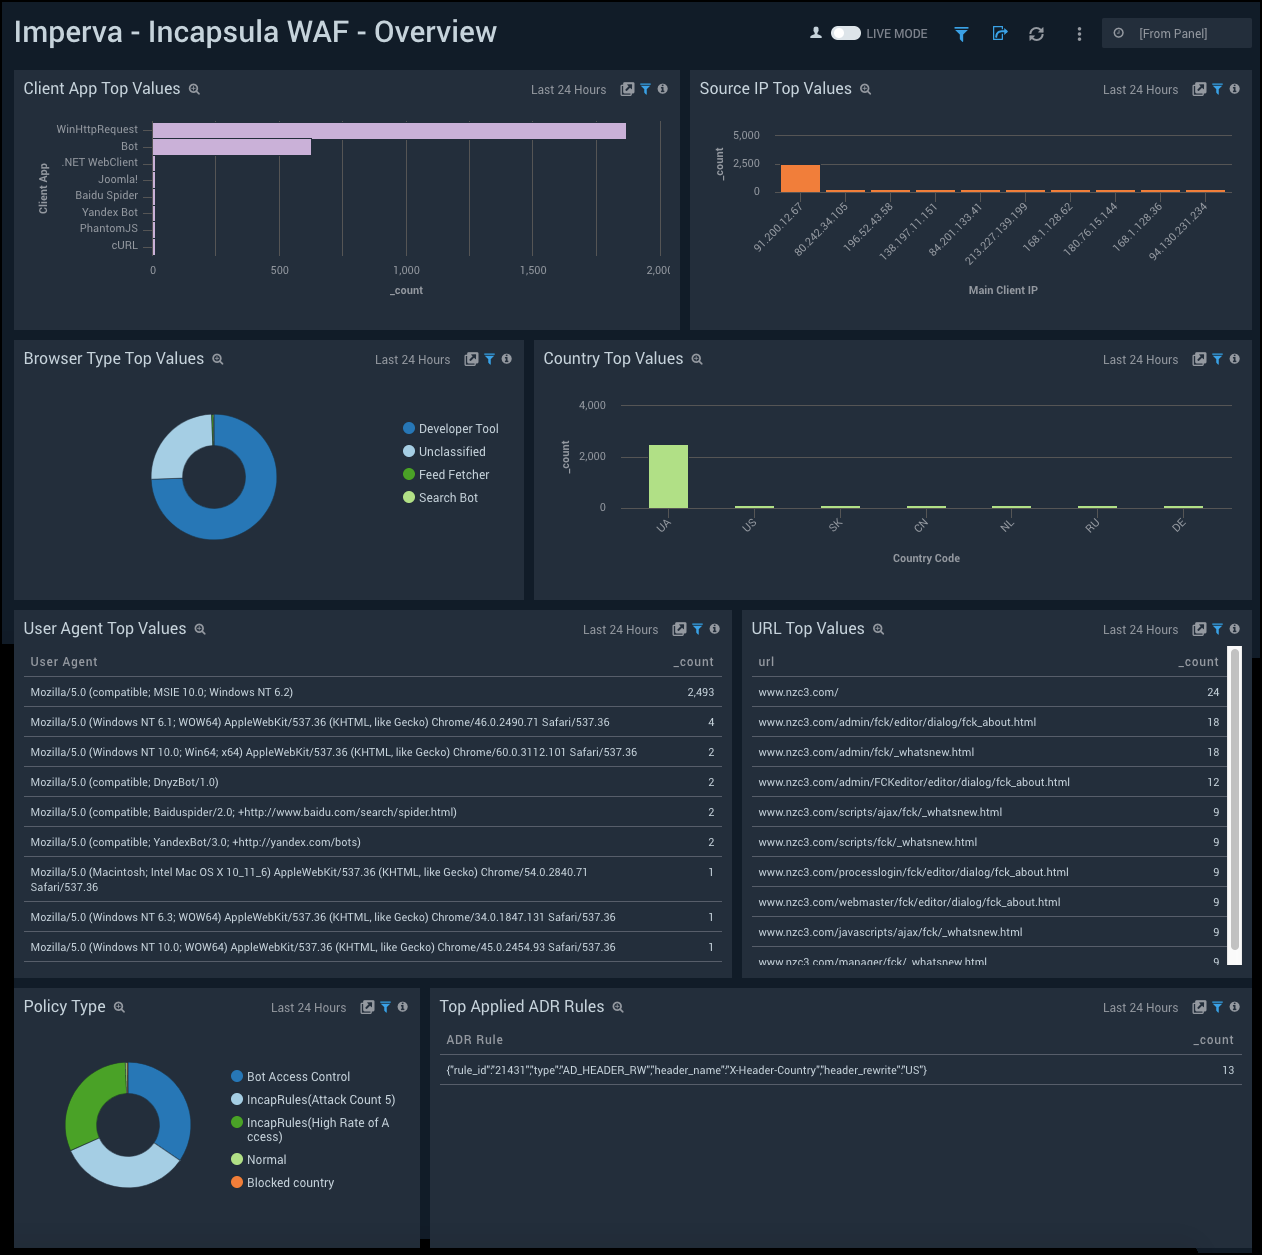
New - We are excited to release the Sumo Logic AWS WAF - Cloud Security Monitoring and Analytics. AWS WAF (web application firewall) data is a rich source of security findings, as it allows you to monitor the HTTP and HTTPS requests that are forwarded to CloudFront and let you control overall access to your content. Each dashboard within this application takes a different lens on AWS WAF data, from traffic patterns to threat intelligence, allowing you to truly identify the needles in the haystack that drives critical security concerns within your AWS infrastructure.
August 18, 2021 (Collection)
Update- We've improved the collection performance of our Mimecast and Netskope Sources.
August 18, 2021 (Traces)
New - Get insight into your customer's front end experience with Real User Monitoring (RUM). We are extending application Observability for you with tracing visibility to the browser. Gather full information about load, execution, and render of your JavaScript (React, Angular, etc) applications and attach this information to end-to-end trace modeling full browser-to-database performance of every user transaction in real-time, with no sampling.
And we are automatically aggregating the above data into metrics, dashboards and providing multi-dimensional analysis by geographical locations, browser, and OS types, measuring and visualizing on dashboards many different aspects of web page load events.
This data is gathered directly from your end-user devices and all collected data is OpenTelemetry compatible and uses no proprietary vendor code to achieve its result when collecting required data.
This gives you an unprecedented view of how your end users are interacting with your application, their experiences with it and allows you one click troubleshooting of problematic web front end areas by connecting the dots from browser to database, even on a level of a single web transaction.
August 16, 2021-16 (Manage)
Update - We are delighted to announce the availability of enhanced search functionality for searching across all Data Tiers: Continuous, Frequent, and Infrequent. Now, you can use the _dataTier search modifier to search all Data Tiers (_dataTier=all) in a single query. Or, you can search for data in multiple indexes in just the tiers you're interested in. With this improvement, you can manage costs by retaining your rarely queried data in the Infrequent tier, and know it's just a query away. For more information, see Searching Data Tiers.
August 12, 2021 (Traces)
New - We are excited to introduce a new Span Analytics experience to help you explore your trace data at the raw span level so you can understand the performance and behavior of your infrastructure.
August 12, 2021 (Collection)
New - Our Cloud-to-Cloud Integration Framework has a new Source. The Carbon Black Inventory Source provides a secure endpoint to receive data from the CB Devices API.
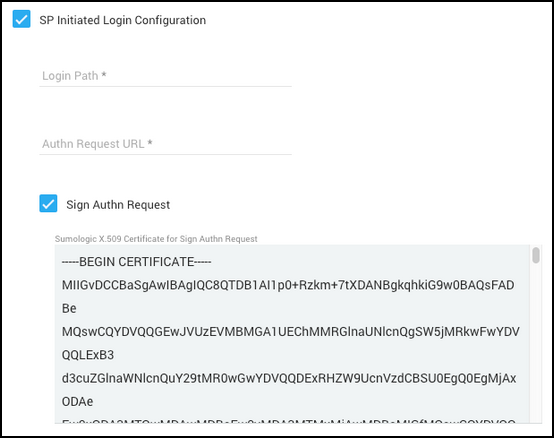
August 12, 2021 (Security)
Update - We made a small but useful change to our SAML support. Now, if you have multiple Sumo Logic SAML integrations and use SP-Initiated logins, the EntityID Sumo Logic sends with authentication requests is unique for each of your integrations. The benefit: this means Sumo Logic SAML supports IdPs that require a unique EntityID for each integration. The EntityID is displayed in the SAML configuration details pane.
The unique Entity ID is provided in SAML configurations created after August 11, 2021. For existing SAML configurations, the Entity ID remains unchanged but is now displayed along with other configuration details.
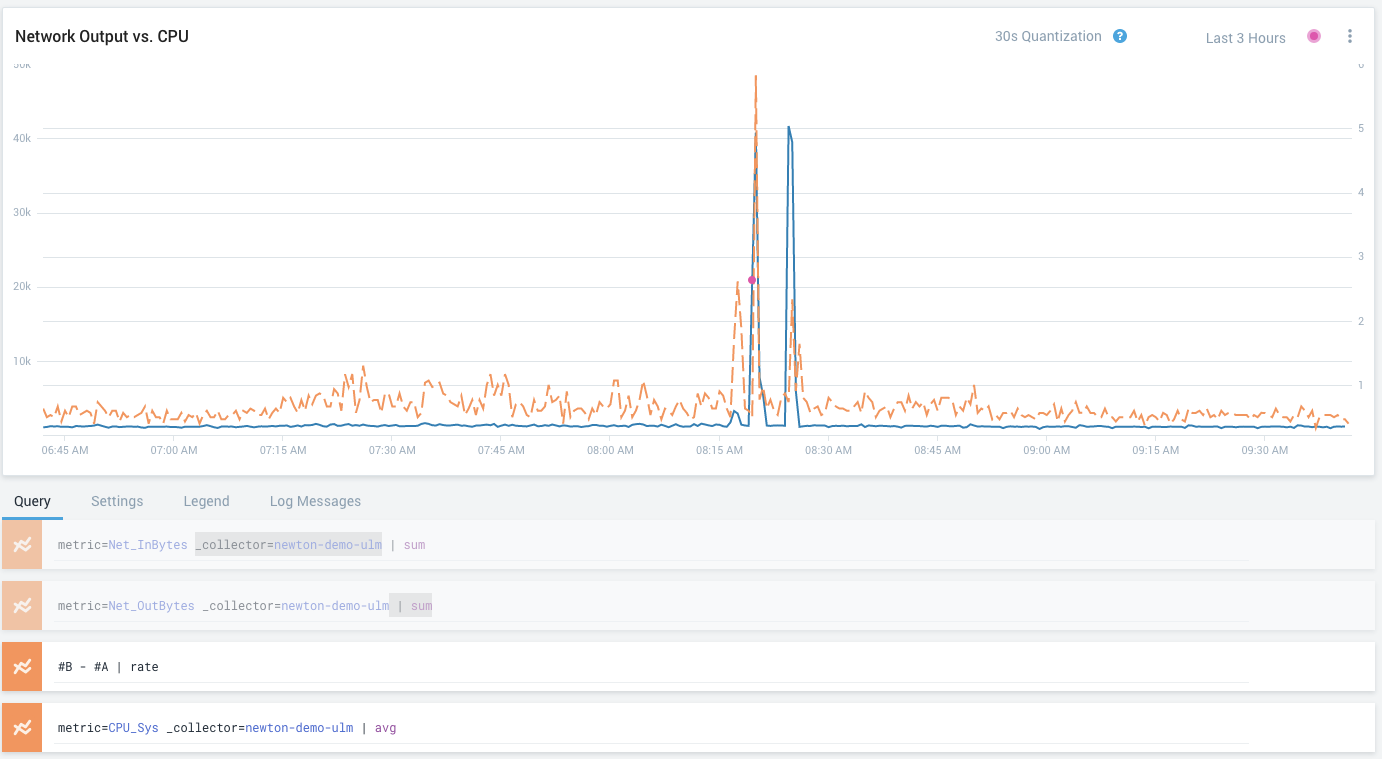
August 11, 2021 (Metrics)
Update - We've added a run button to the Metrics Explorer, to the right of the query builder area. Previously, metric queries ran automatically. Now, metric queries are run only when you click the run button, or when you press Enter on your keyboard. (Depending on how you've set your Preferences, you might use Alt+Enter rather than Enter to run queries.)
August 10, 2021 (Alerts)
New - We have a new ServiceNow connection that supports creating either Events or ITSM Incidents and has the option to authenticate with an Authorization Header. You can still use the legacy connection to create Events if needed.
August 9, 2021 (Apps)
New - We are excited to release the Sumo Logic Memcached app. The Memcached app is a unified logs and metrics app that helps you monitor the availability, performance, health, and resource utilization of your Memcached clusters. Preconfigured dashboards provide insight into uptime, cache hits/misses, resource utilization, errors, and commands executed.
Update - We have updated the Sumo Logic Varnish app. The Varnish app provides dashboards that help you analyze log and metric events generated by Varnish servers. This app allows you to identify traffic sources, monitor and improve application and website workflows, and understand how customers use your product.
August 9, 2021 (Manage)
Coming Soon - We're happy to announce that on August 23, 2021, Sumo Logic will roll out a new Service Status Page with an enhanced look and feel. You can preview that page here but there is no action to take at this time. In about two weeks we will switch status.sumologic.com to the new page.
August 6, 2021 (Search)
New - The Search Query Language has a new operator, isReservedIP checks if an IPv4 address is reserved as defined by RFC 5735 and returns a boolean.
August 1, 2021 (Apps)
New - We are pleased to announce the release of the Elasticsearch app. The Elasticsearch app is a unified logs and metrics app that helps you monitor the availability, performance, health, and resource utilization of your Elasticsearch clusters. Preconfigured dashboards provide insight into cluster health, resource utilization, sharding, search, and index performance.
July 21, 2021 (Apps)
Update - We've updated the Apache Tomcat app. The Apache Tomcat app is a unified logs and metrics app that helps you monitor the availability, performance, health and resource utilization of your Apache Tomcat servers. Preconfigured dashboards provide insight into visitor locations, traffic patterns, errors, resource utilization, garbage collection, web server operations and access from known malicious sources.
July 3, 2021 (Apps)
New - We are excited to announce the release of ActiveMQ app. The ActiveMQ app is a unified logs and metrics app that helps you monitor the availability, performance, health, and resource utilization of your ActiveMQ messaging clusters. Preconfigured dashboards provide insight into cluster status, nodes, producers, consumers, destinations, resource utilization, message rates and error logs.
July 1, 2021 (Collection)
New - Our Cloud-to-Cloud Integration Framework has a new Source. The Palo Alto Cortex XDR Source provides a secure endpoint to receive alerts from the Get Alerts Incident Management API.
July 1, 2021 (Alerts)
Update - We've added a new Scheduled Search alert type. Now, Cloud SIEM Enterprise (CSE) users can use Scheduled Searches to generate CSE Signals. That means you can use the results of any Sumo Logic query to automatically create Signals in CSE without replicating logic in CSE. This extends the real time alerting and notification capabilities of CSE with the analytics capability of Sumo Logic's core query engine.
For more information, see Generate CSE Signals With a Scheduled Search.
June 30, 2021 (Search)
New - The Search Query Language has two new operators.
- isNaN returns true if a string value is not a number, false otherwise.
- isInfinity returns true if a string value is a positive or negative infinity, false otherwise.
June 29, 2021 (Apps)
New - We are happy to announce the release of RabbitMQ app. The Sumo Logic App for RabbitMQ app is a unified logs and metrics app that helps you monitor the availability, performance, health, and resource utilization of your RabbitMQ messaging clusters. Preconfigured dashboards provide insight into cluster status, exchanges, queues, nodes and error logs.
June 28, 2021 (Dashboard (New))
Update - We've updated the interface to create a text panel. In addition to improvements on how you configure visual settings, we've added a preview of how your panel will look allowing you to see your text panel in real time before you add it to your Dashboard (New).
June 28, 2021 (Collection)
Update - Sources in the Cloud-to-Cloud Integration Framework need updates over time to maintain data collection. Updates can vary in severity and may not require any input from you. See Cloud-to-Cloud Source Versions for details on how to upgrade and how versions are structured.
June 28, 2021 (Traces)
Update - You can set custom filters to quickly investigate traces you're interested in.
June 23, 2021 (Apps)
New - We are excited to announce the release of Zscaler Internet Access (ZIA) app. The Sumo Logic App for ZIA collects logs via Cloud Nanolog Streaming Service (NSS) to populate pre-configured searches and Dashboards in order to visualize and provide insight into threats, DNS, web traffic behaviors, security, user browsing activities, and risk.
June 22, 2021 (Collection)
New - Our Cloud-to-Cloud Integration Framework has a new Source. The Akamai SIEM API Source provides a secure endpoint to ingest security events from the Akamai platform.
June 20, 2021 (Apps)
New - We are proud to release the Sumo Logic Nginx Plus Ingress app. The app is a unified logs and metrics app that helps you monitor the availability, performance, health and resource utilization of your Nginx Plus Ingress web servers. Preconfigured dashboards and searches provide insight into server status, location zones, server zones, upstreams, resolvers, visitor locations, visitor access types, traffic patterns, errors, web server operations and access from known malicious sources.
New - We are also excited to announce the release of the Global Intelligence for Apache Tomcat App. The App is a companion to the Apache Tomcat application and helps DevOps and infrastructure engineers compare server and user activity patterns associated with their Apache Tomcat servers against other Sumo Logic customer's servers. Such comparisons can help diagnose potential load, throughput or error issues in Apache Tomcat clusters and avoid operational incidents arising from sub-optimal configurations of Tomcat servers.
June 18, 2021 (Collection)
Update - The Netskope Source provides the option to collect specific event types. Alert events are always collected.
June 18, 2021 (Search)
Update - The ASN Lookup operator now supports IPv6 addresses.
June 14, 2021 (Apps)
New - We are proud to release the Sumo Logic Cassandra app. The Apache Cassandra is an open source NoSQL distributed database with high scalability and availability without compromising performance.
June 11, 2021 (Apps)
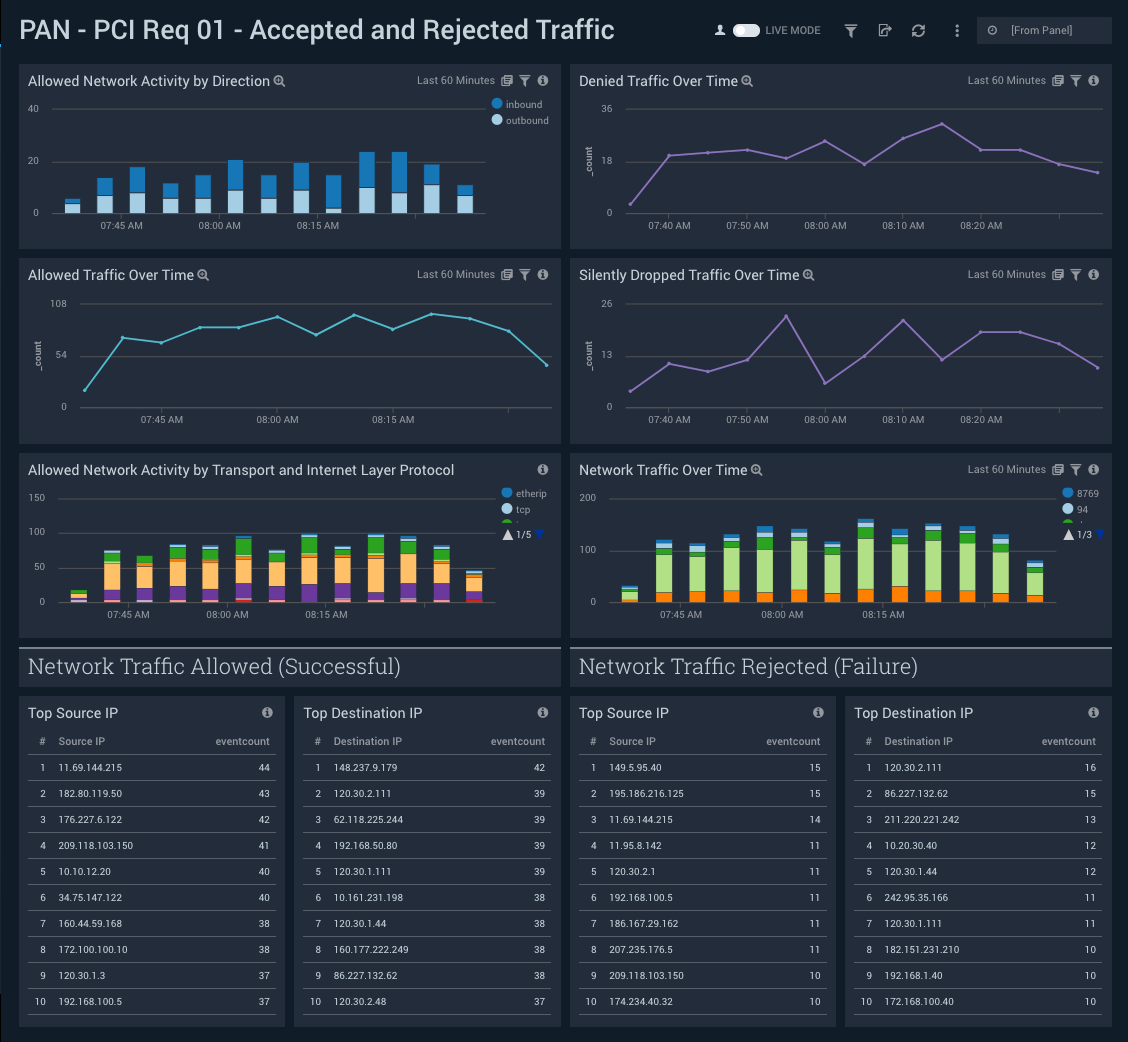
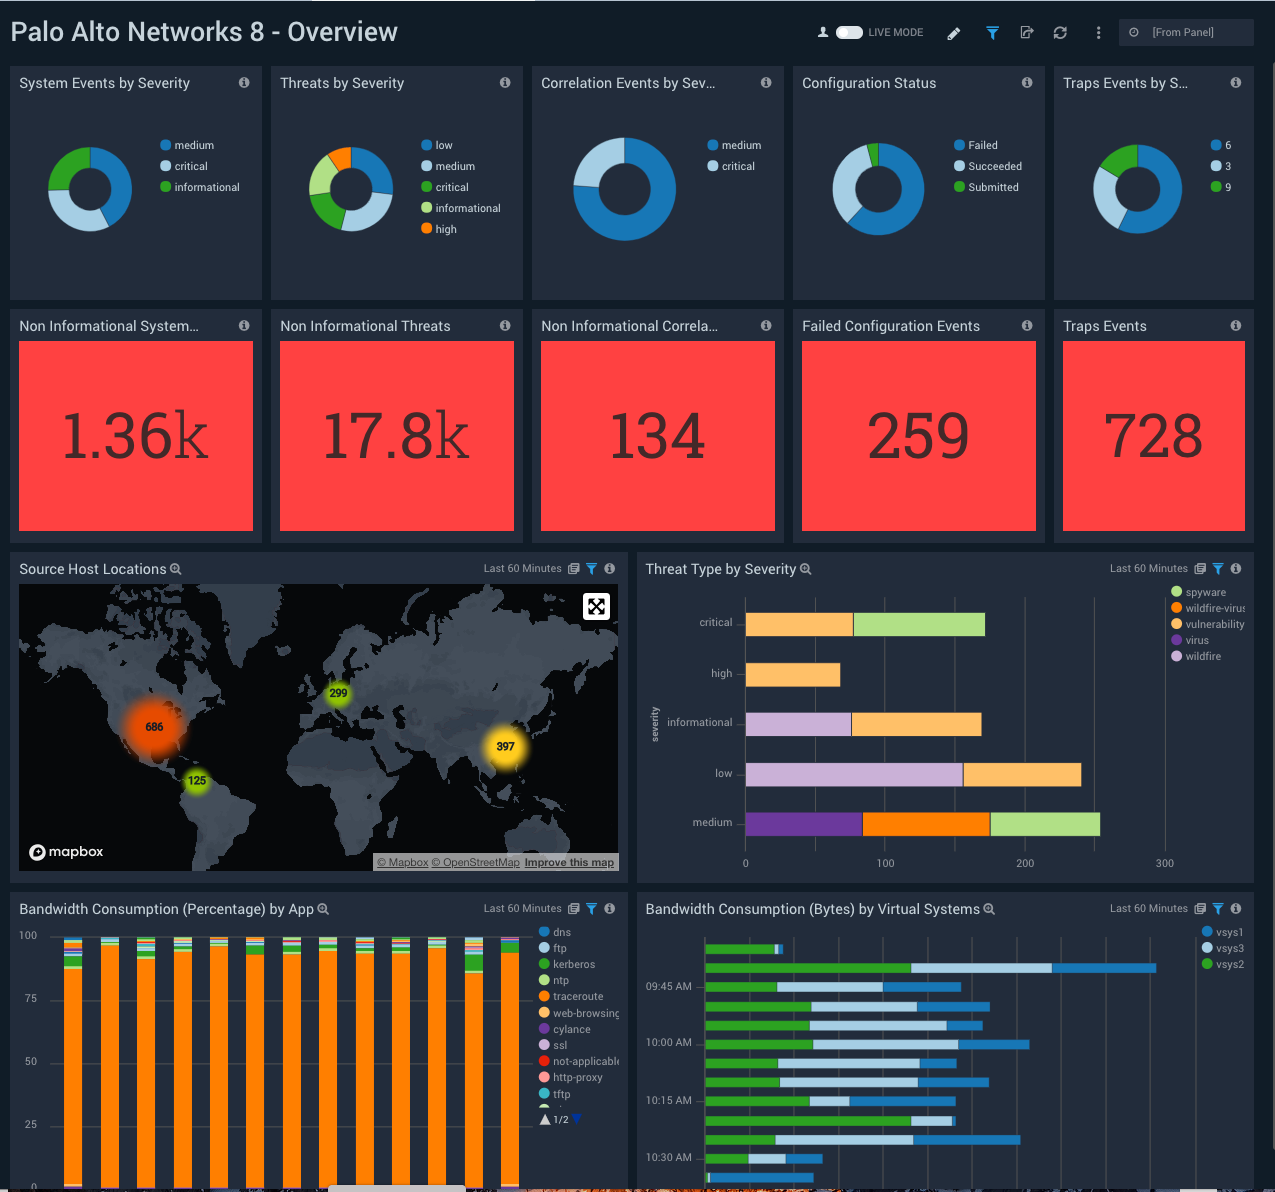
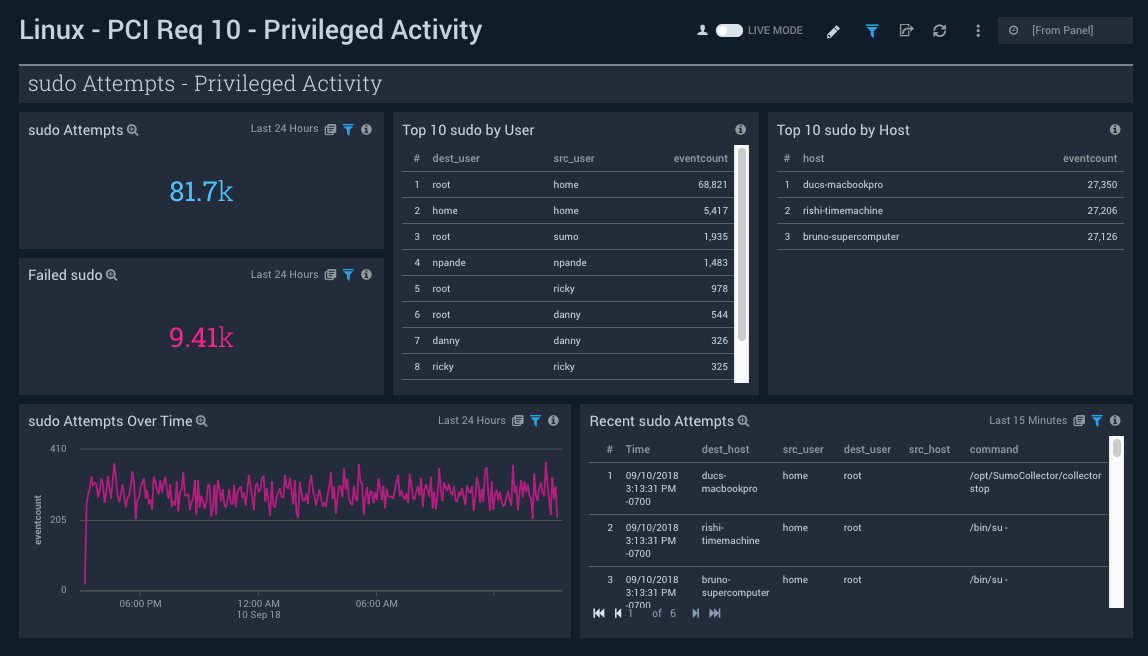
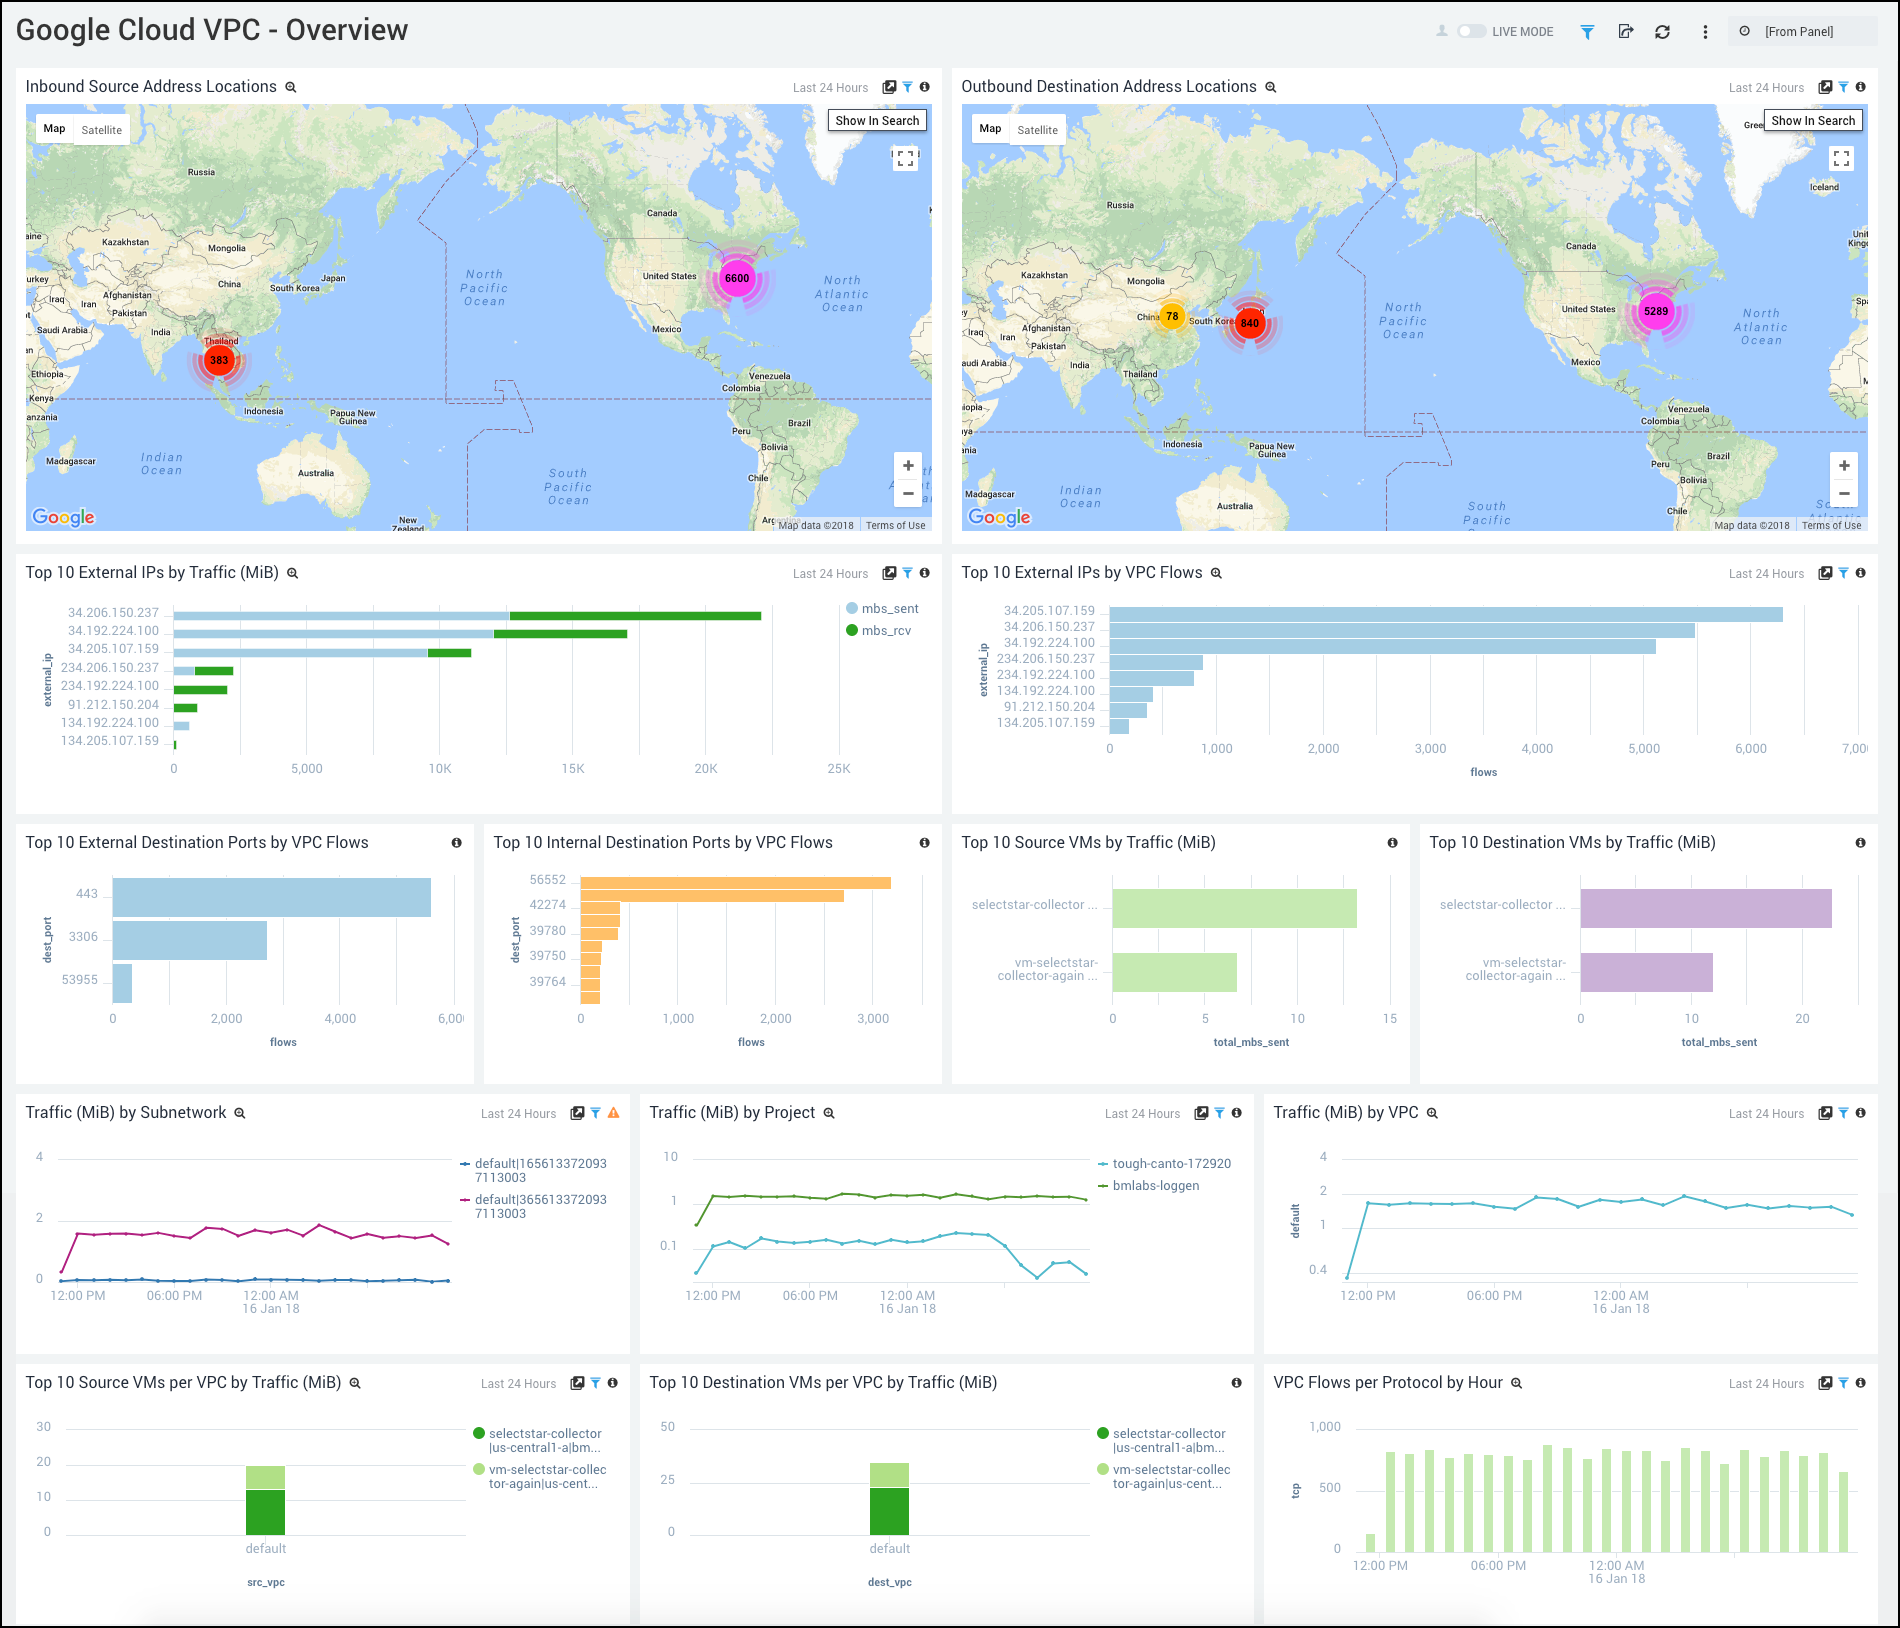
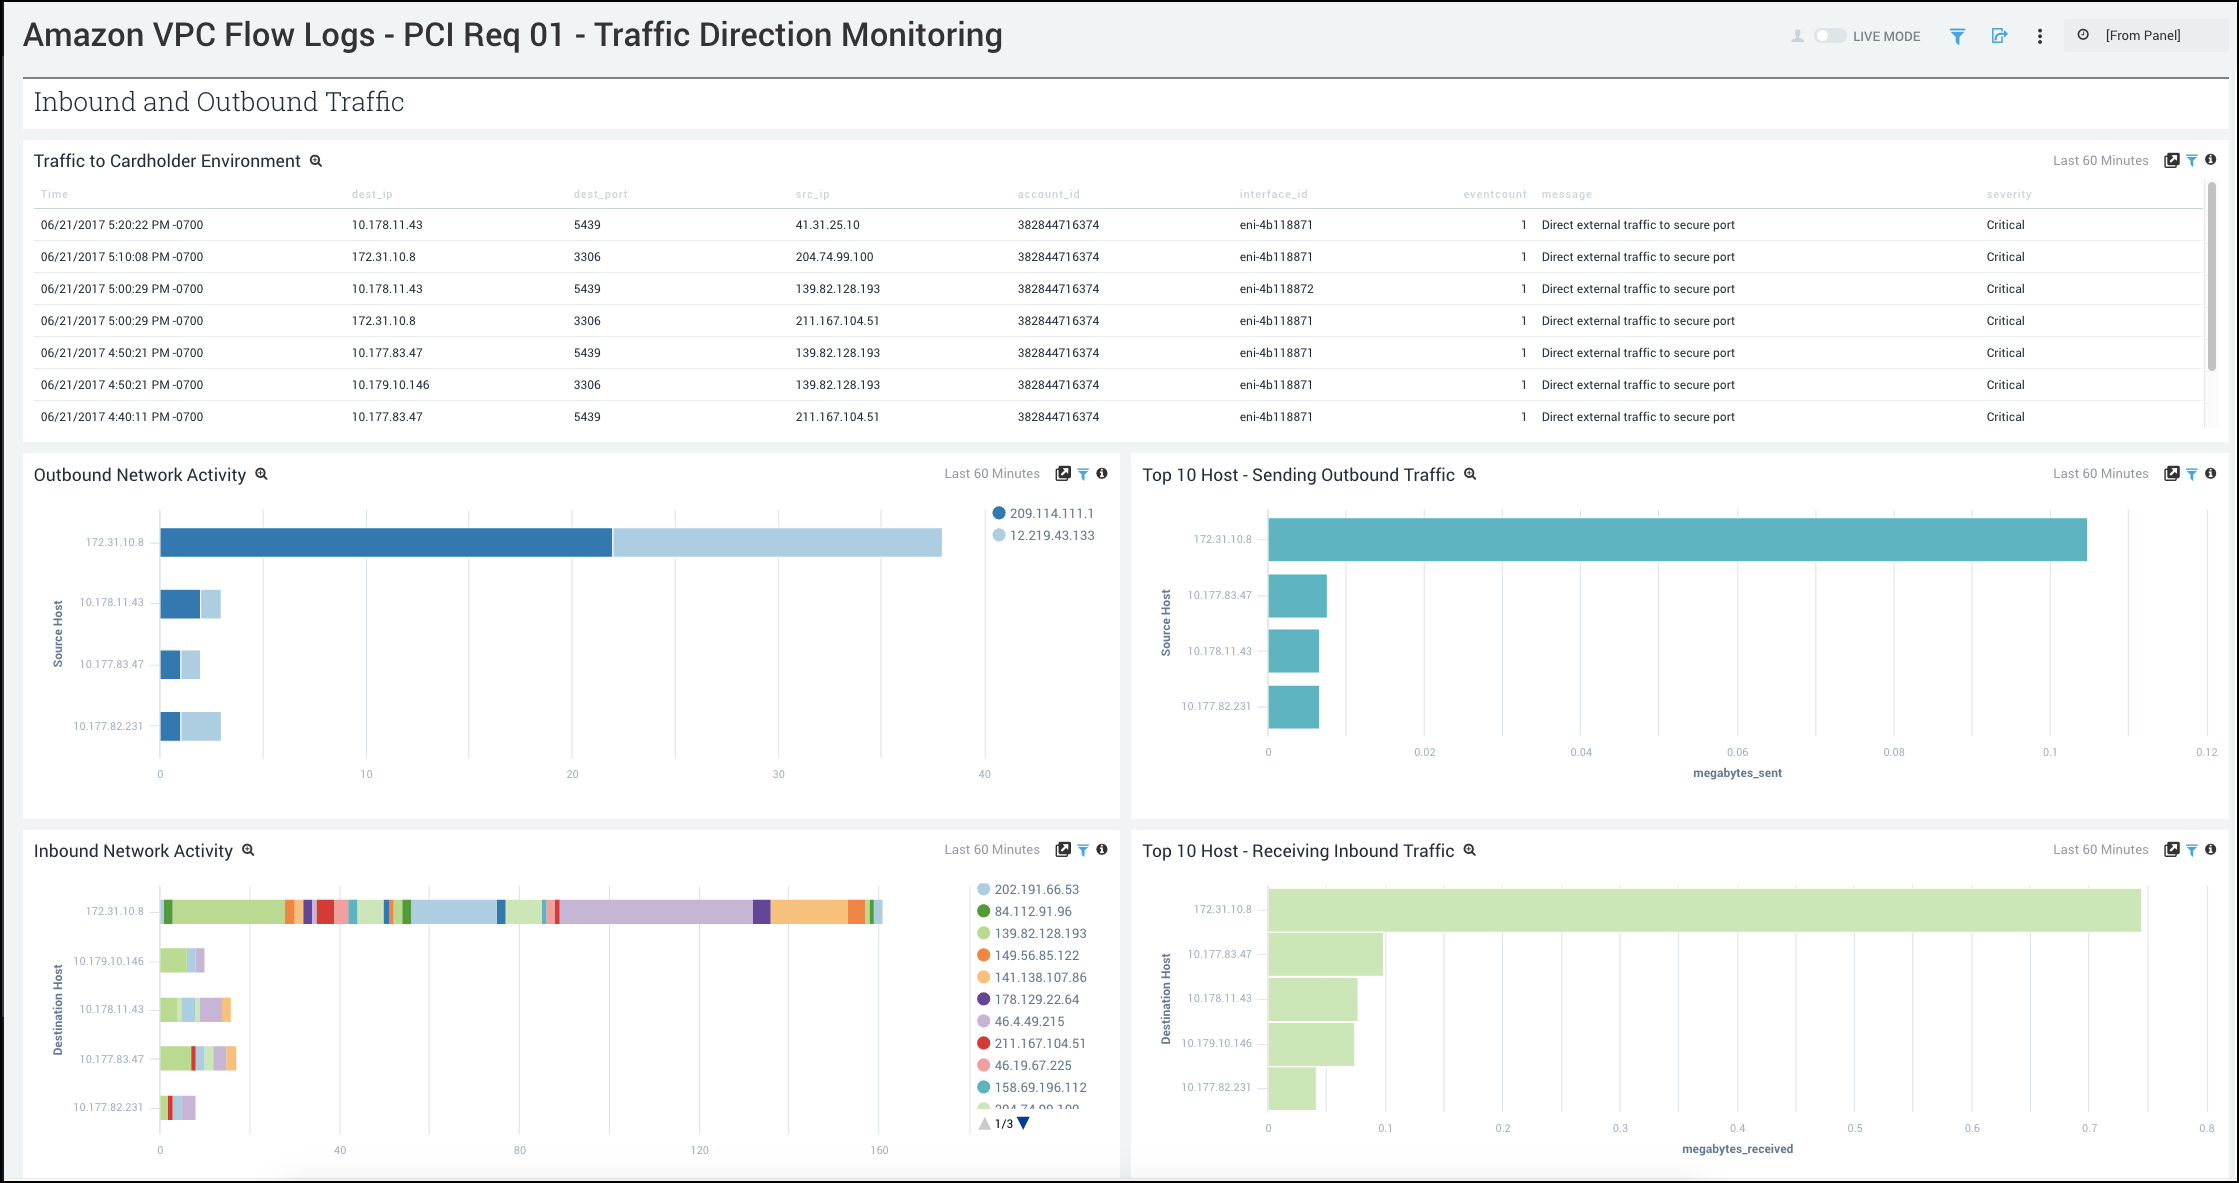
New - We are excited to announce the launch of the Security Monitoring & Analytics Apps. These apps are a new way to get an understanding of your day to day security operations. For this release we are providing new dashboards for five data sources: Windows, Linux, AWS Cloud Trail, AWS VPC Flows, and Palo Alto Networks Firewalls. All dashboards are using our latest features to provide practical security insights for all security practitioners.
June 10, 2021 (Collection)
New - Our Cloud-to-Cloud Integration Framework has another new Source: that's two this week! The Symantec Web Security Service (WSS) source provides a secure endpoint to ingest Symantec Web Security Services Access Logs. Symantec Web Security Service delivers a broad set of advanced cloud-delivered network security capabilities. With this new integration, Security customers can take advantage of the rich set of security information available from the WSS Access Logs.
June 8, 2021 (Collection)
New - Our Cloud-to-Cloud Integration Framework has a new Source. The CSE AWS EC2 Inventory Source provides a secure endpoint to ingest AWS EC2 inventory. Cloud SIEM Enterprise (CSE) users can forward this data to Cloud SIEM Enterprise to provide more context to Entities.
June 7, 2021 (Apps)
New - We are excited to announce the launch of the Nginx Plus web server App. The app is an unified logs and metrics app that helps you monitor the availability, performance, health and resource utilization of your Nginx Plus web servers. Preconfigured dashboards and searches provide insight into server status, location zones, server zones, upstreams, resolvers, visitor locations, visitor access types, traffic patterns, errors, web server operations and access from known malicious sources.
Update - There is a new release for the Microsoft SQL Server app. The is an unified logs and metrics app that provides insight into your SQL server performance metrics and errors. The App consists of predefined Dashboards, providing visibility into your environment for real-time or historical analysis on backup, latency, performance counter, restore, mirroring, database monitoring, general health and operations of your system.
June 3, 2021 (Search)
New - The Search Query Language has a new operator, values, that allows you to quickly determine all the values a field has.
June 2, 2021 (Collection)
New - Our Cloud-to-Cloud Integration Framework has a new Source, the CrowdStrike Falcon Data Replicator (FDR) Source provides a secure endpoint to ingest Falcon Data Replicator events using the S3 ingestion capability by consumed SQS notifications of new S3 objects.
Update - You can use a Windows Event Source to collect forwarded events from a Windows Event Collector.
June 2, 2021 (Apps)
Update - There is a new release for the MongoDB app.The app now provides insight into your MongoDB environment, allowing you to track overall system health, queries, logins and connections, errors and warnings, replication, and sharding.
June 1, 2021 (Search)
New - We've added several new operators to our Search Query Language:
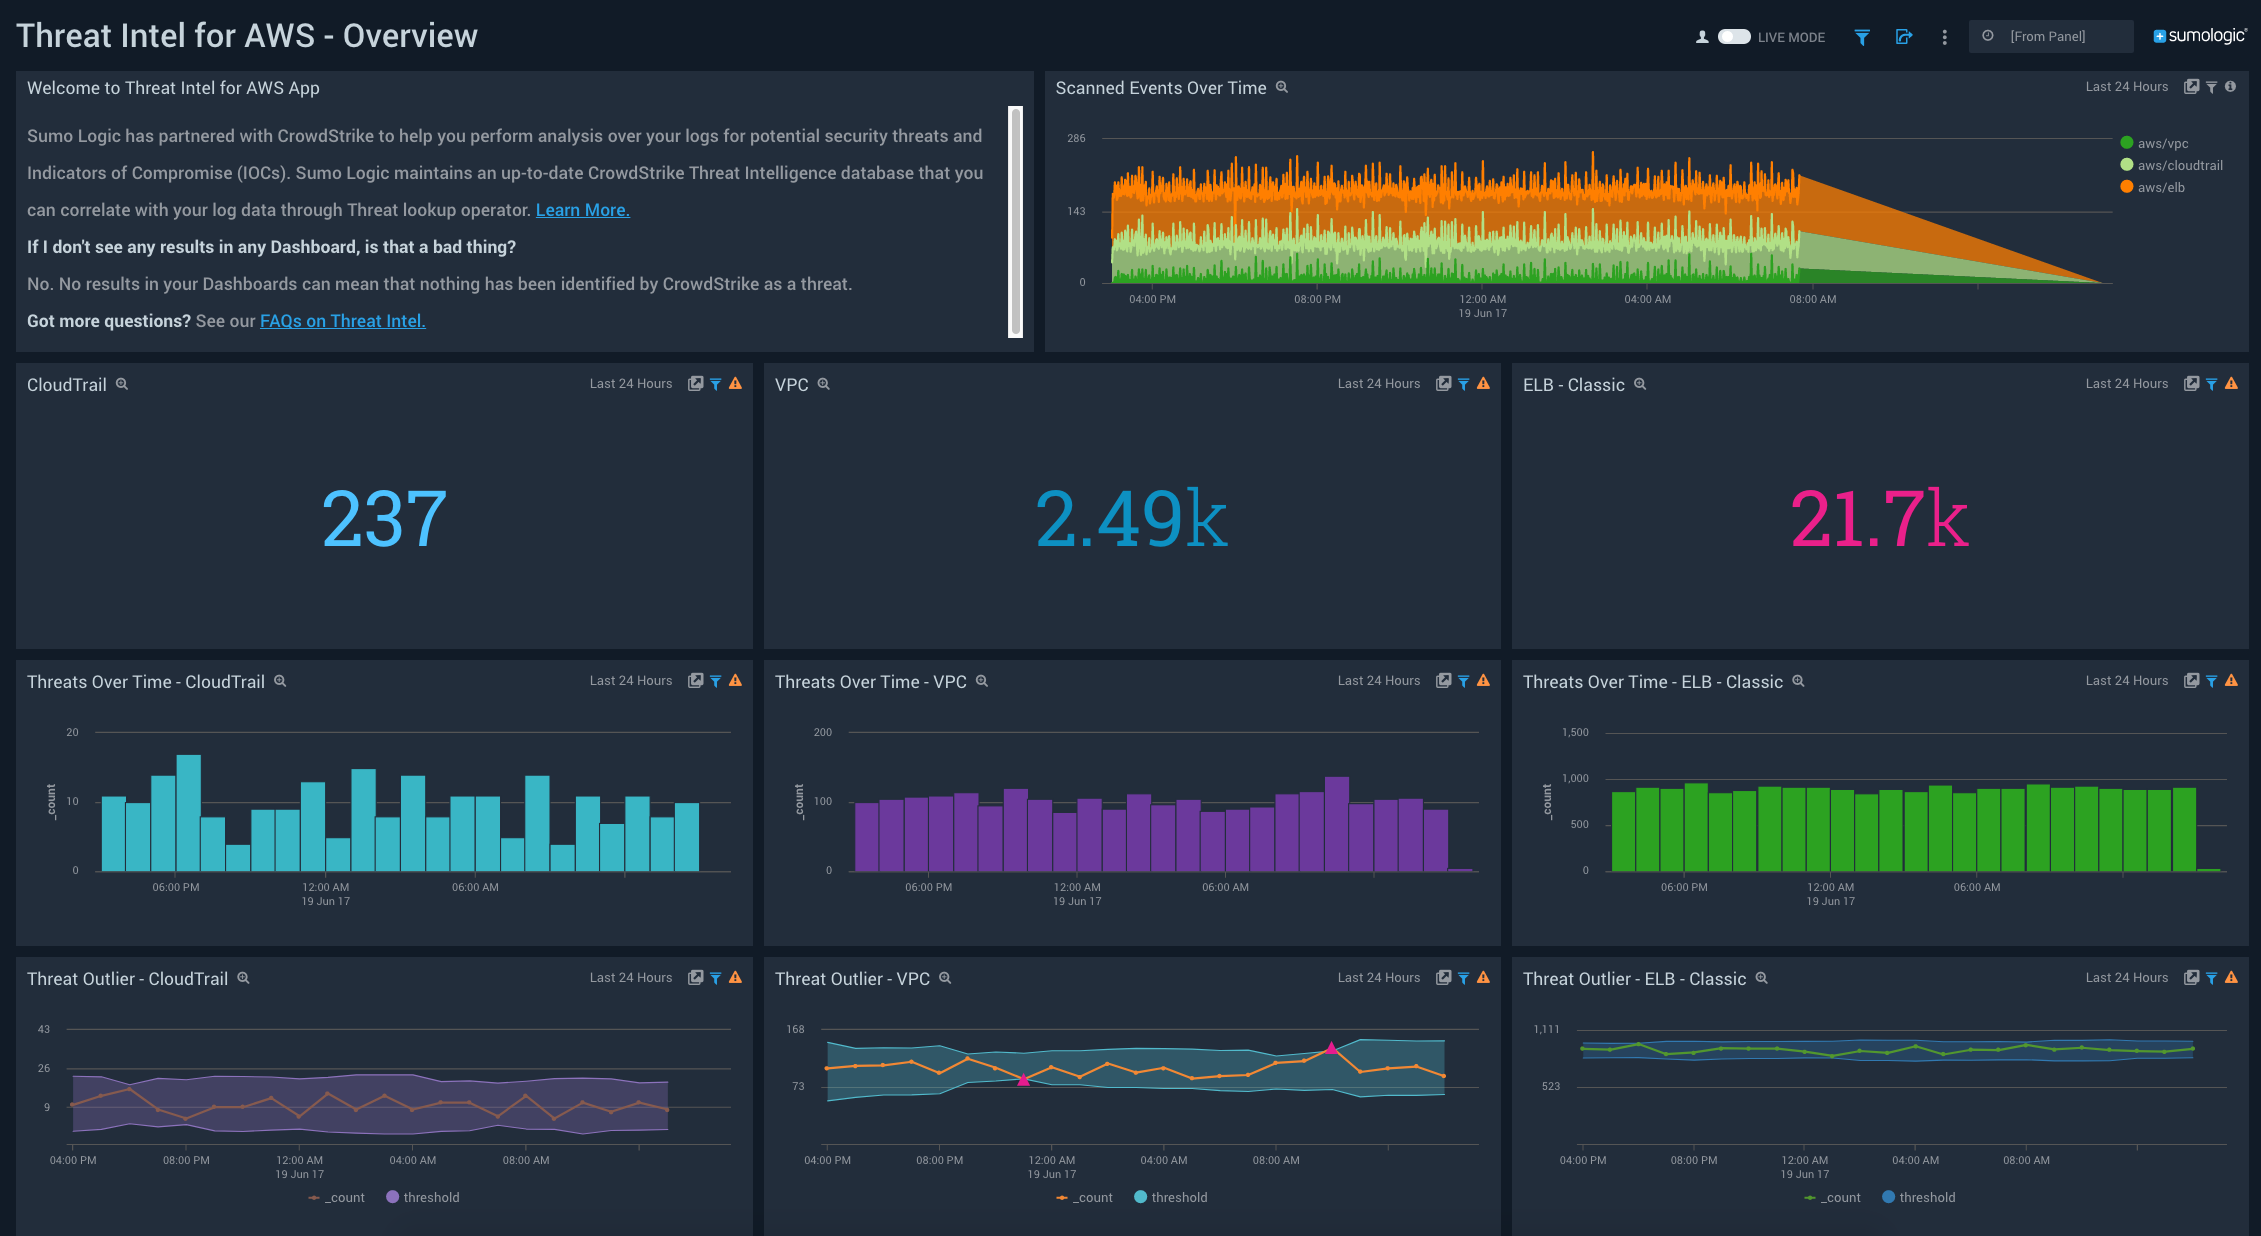
- The threatip operator correlates CrowdStrike's threat intelligence data based on IP addresses from your log data, providing security analytics that helps you to detect threats in your environment, while also protecting against sophisticated and persistent cyber-attacks. This operator uses the same lookup as the Threat Intel Quick Analysis App but is simplified for only IP threat lookups.
- The geoip operator provides geographical location data to create Map Charts. This operator provides the same data as a Geo Lookup operation with a simpler syntax.
- The merge operator has a new strategy,
takeDistinct, that allows you to identify only distinct values of a field.
May 27, 2021 (Apps)
New - We are excited to announce the launch of the Zscaler Private Access App, which assists in collecting logs from Zscaler using the Log Streaming Service (LSS) to populate pre-configured searches and Dashboards. The dashboards also provide easy-to-access visual insights into user behaviors, security, connector status, and risk.
Update - There is a new release for the Apache app. The app now helps you monitor the availability, performance, health and resource utilization of Apache web server farms. The pre-configured dashboards and searches provide insight into visitor locations, visitor access types, traffic patterns, errors, web server operations, resource utilization and access from known malicious sources.
May 26, 2021 (Metrics)
New - What's good for the logs is good for the metrics. That's why we're extending the processing rules feature to support metrics as well as logs. Now, you can configure include or exclude rules for your metric sources for increased control over the metrics you ingest to Sumo Logic. For more information, see Metrics Include and Exclude Rules.
May 24, 2021 (Collection)
New - The Microsoft Graph Security API Source provides a secure endpoint to receive alerts from the Microsoft Graph Security API endpoint.
May 20, 2021 (Traces)
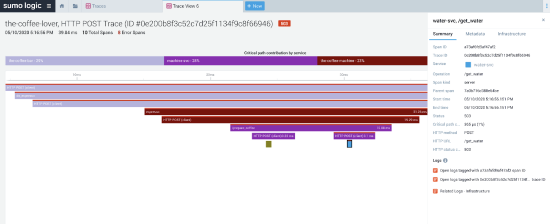
New - We are proud to release the support of the Search Query Language for Traces. This allows you to not only find and diagnose transaction traces that match any custom criteria, but also make advanced analysis on the top of trace span data using the Search Query Language, the same way as for log data, in the same familiar interface.
This capability allows you to access raw tracing data on a span level, treat it as structured or unstructured data for analysis, and filter, transform, or aggregate any part of the tracing span message (a single atomic request/response representation) to deliver meaningful results to drive smarter decisions.
May 17, 2021 (Apps)
New - The Sumo Logic App for HAProxy is a unified logs and metrics app that helps you monitor the availability, performance, and health of your HAProxy cluster. Preconfigured dashboards provide insights into active servers, visitor locations, sessions, errors, response time, and throughput.
May 10, 2021 (Apps)
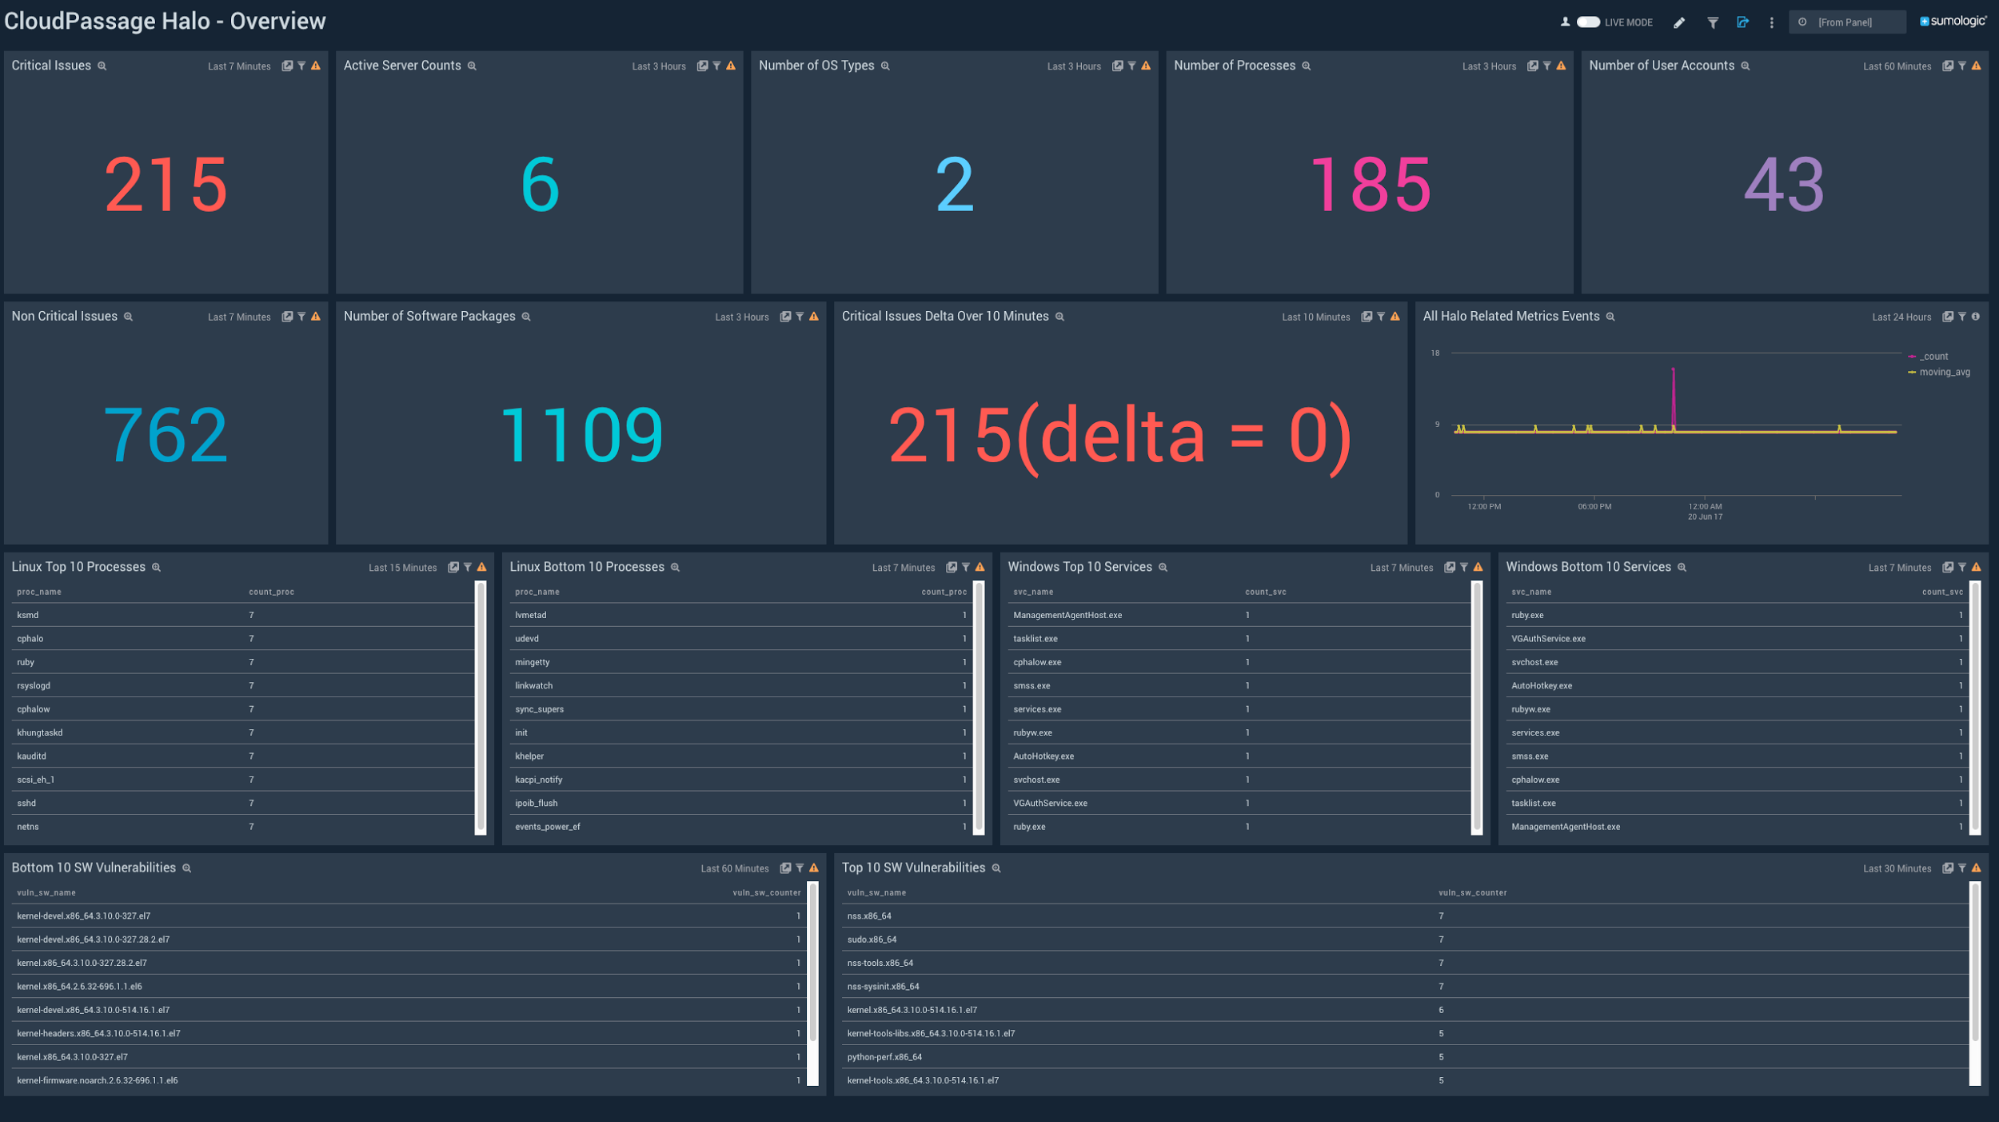
PCI Compliance for Windows Legacy App
Update - The Payment Card Industry (PCI) Compliance for Windows Legacy App is updated to offer dashboards to monitor system, account, and user activity to ensure that login activity and privileged users are within the expected ranges. The PCI Compliance for Windows Legacy App covers PCI requirements 2, 6, 8, and 10.
PCI **Compliance for Windows JSON App**
New - The Payment Card Industry (PCI) Compliance for Windows JSON App is released. This App offers dashboards to monitor system, account, and user activity to ensure that login activity and privileged users are within the expected ranges. The PCI Compliance for Windows JSON App covers PCI requirements 2, 6, 8, and 10.
CatchPoint
New - The CatchPoint App for Sumo Logic provides a central location for the Catchpoint tests in your account. View at-a-glance information surrounding your recent Errors. The Node Map provides a geographical overview of your test runs, while the Tests widget lets you search for and quickly access your synthetic data.
Cybereason
New - The Cybereason App for Sumo Logic enables Security Operations teams to leverage the Cybereason Malop™ to detect and end attacks faster.
Nucleon
New - Nucleon is a distributed, high-performance invisible, and non-invasive platform that is tailored to secure environments from different common threats such as professional hacking groups, APTs, and others. The Nucleon App for Sumo Logic helps in identifying the overall number of threats, their sources by country, and their targeted segments(critical_infrastructure, energy, fintech, governments, health_care, municipality, general, telecom).
Workday App and Workday C2C source
New - We are very excited to release a new app for Workday and C2C source. The Workday app is built for IT and security teams to get insights into Workday related authentication activity, user activity, and administrator activity. These dashboards are tailored to highlight critical events for general security monitoring and compliance reporting. Collection of data is done via a cloud-native-collector that provides a secure endpoint to receive user and sign-on data via the Workday APIs.
May 7, 2021 (Apps)
New - The Global Intelligence for Apache App is a companion to the Apache App and helps DevOps and infrastructure engineers compare server and user activity patterns associated with their Apache servers against other Sumo Logic customer's servers. Such comparisons can help diagnose potential load, throughput, or error issues in Apache clusters and avoid operational incidents arising from sub-optimal configurations of Apache clusters.
May 4, 2021 (Manage)
New - We're making it easier to create and manage multiple Sumo Logic accounts. You can use the new Sumo Logic Organizations (Sumo Orgs) feature to create, provision, and manage multiple "child" orgs from a "parent" org. An authorized user can use the UI or API to estimate required credits for child orgs, based on expected log and metrics ingestion levels. It's easy to allocate credits, and to monitor child orgs' utilization. Sumo Orgs is great for Sumo Logic Service Providers as well as Enterprise users. In particular, Sumo Orgs eases the process of provisioning and managing POV Trial orgs in multiple Sumo Logic deployments.
Sumo Orgs is available in Enterprise subscriptions on the Credits model.
May 4, 2021 (Apps)
AWS Observability
Update - We're happy to announce the release of our AWS Observability Solution 2.2.0 which includes:
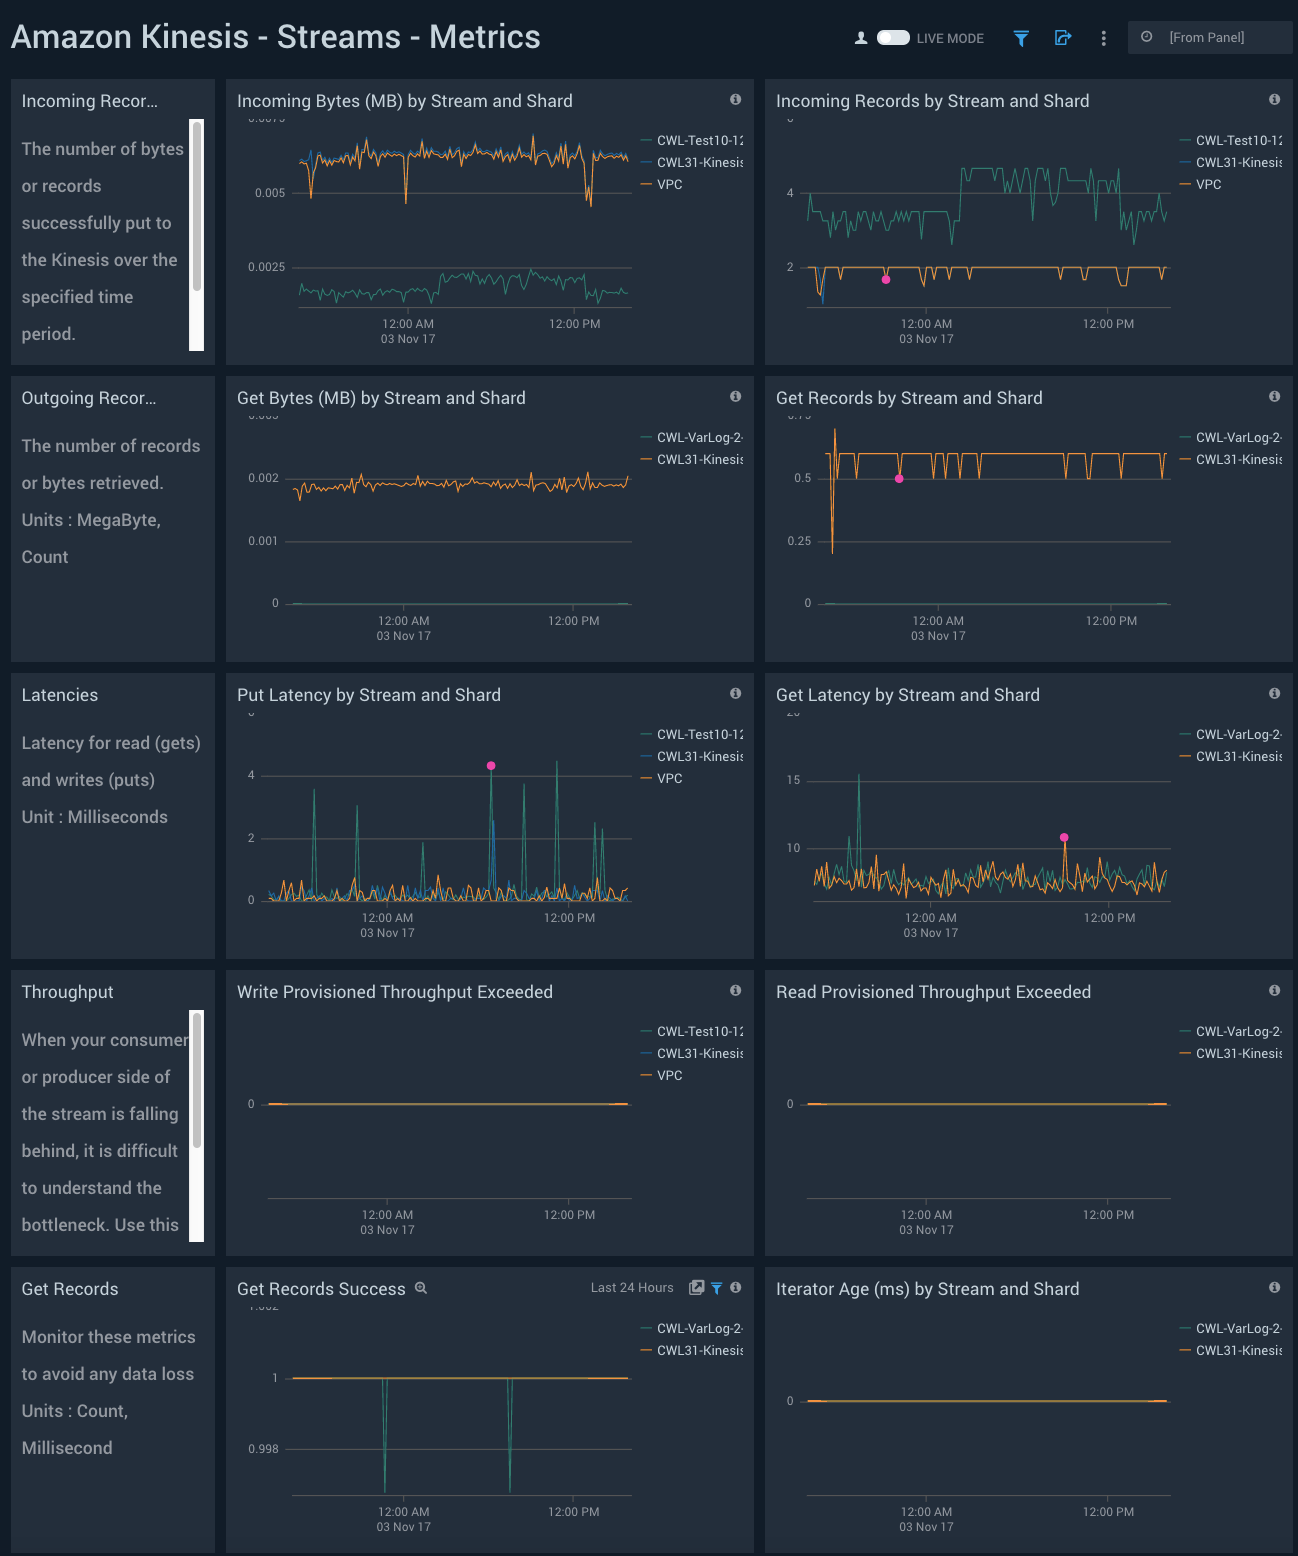
- New performance and cost-savings. We've added support for collecting AWS CloudWatch metrics and AWS CloudWatch logs through new Amazon Kinesis logs and metrics sources for Sumo Logic. These new sources enable you to collect logs and metrics data from AWS in the most performant and cost-effective manner.
- AWS benchmarks in-context with AWS Observability. Global Intelligence for AWS CloudTrail DevOps helps you accelerate root cause analysis for incidents by providing error rate and configuration insights benchmarked from Sumo Logic's AWS customers for nine AWS services: EC2, Lambda, Auto Scaling, S3, ELB, RDS, DynamoDB, ElastiCache and Redshift. In this release, the benchmark dashboards are integrated with AWS Observability solution at the account-region level.
Update to the latest version to take advantage of these new features.
May 3, 2021 (Metrics)
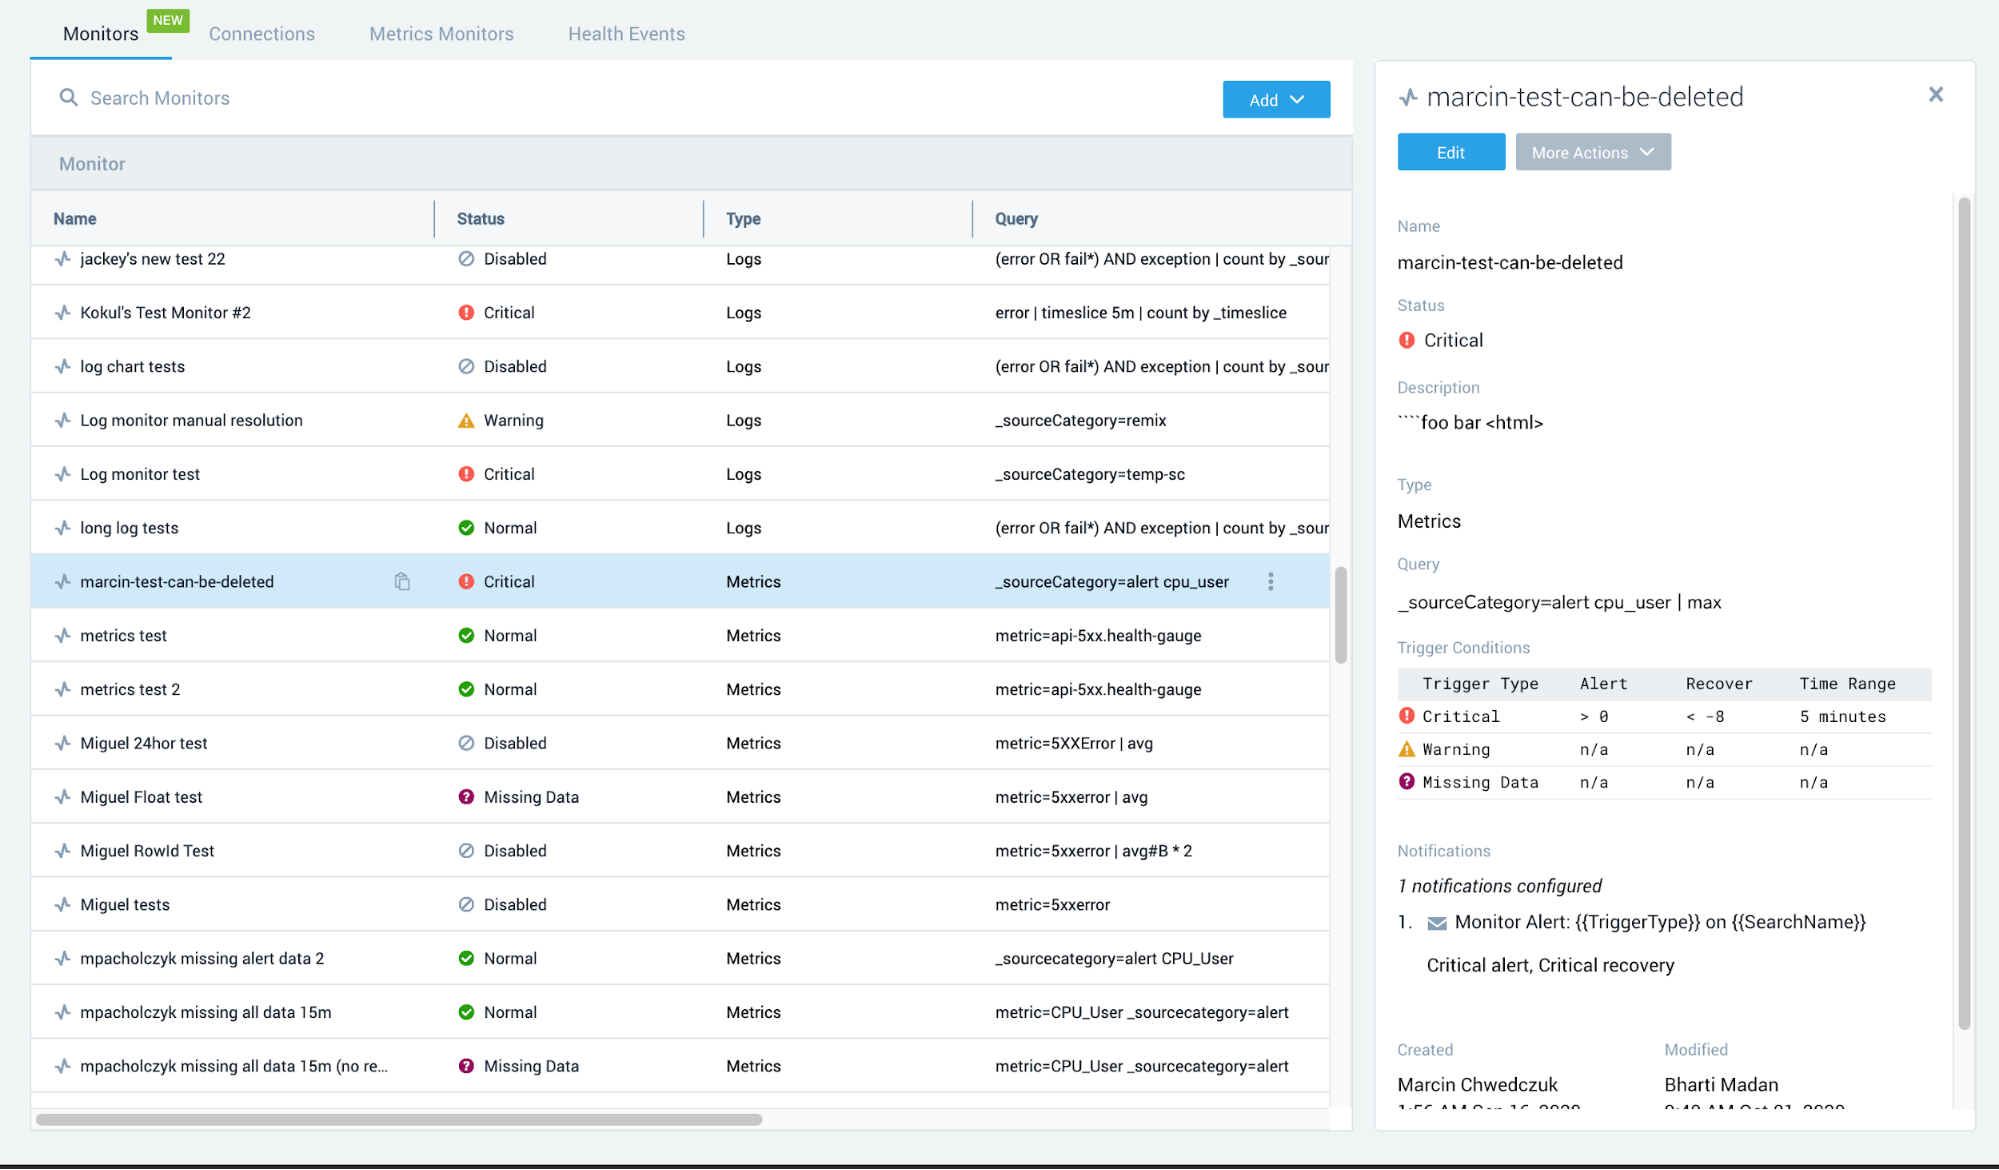
Deprecation - We have completed the deprecation of old-style Metric Monitors. Old Metric Monitors have been migrated to the new Monitors framework and removed. For information about the deprecation process, see Metrics Monitors Deprecation FAQs.
April 30, 2021 (Apps)
Redis
Update - We've released a new version of the Redis app that includes pre-packaged alerts. New features include updated dashboards that allow you to visualize, search and alert by Redis clusters and hosts. Alerts are based on Sumo Logic monitors, leverage metrics and logs, and include preset thresholds for connections, replication, memory fragmentation, communication failures, resource utilization and other critical conditions.
PostgreSQL
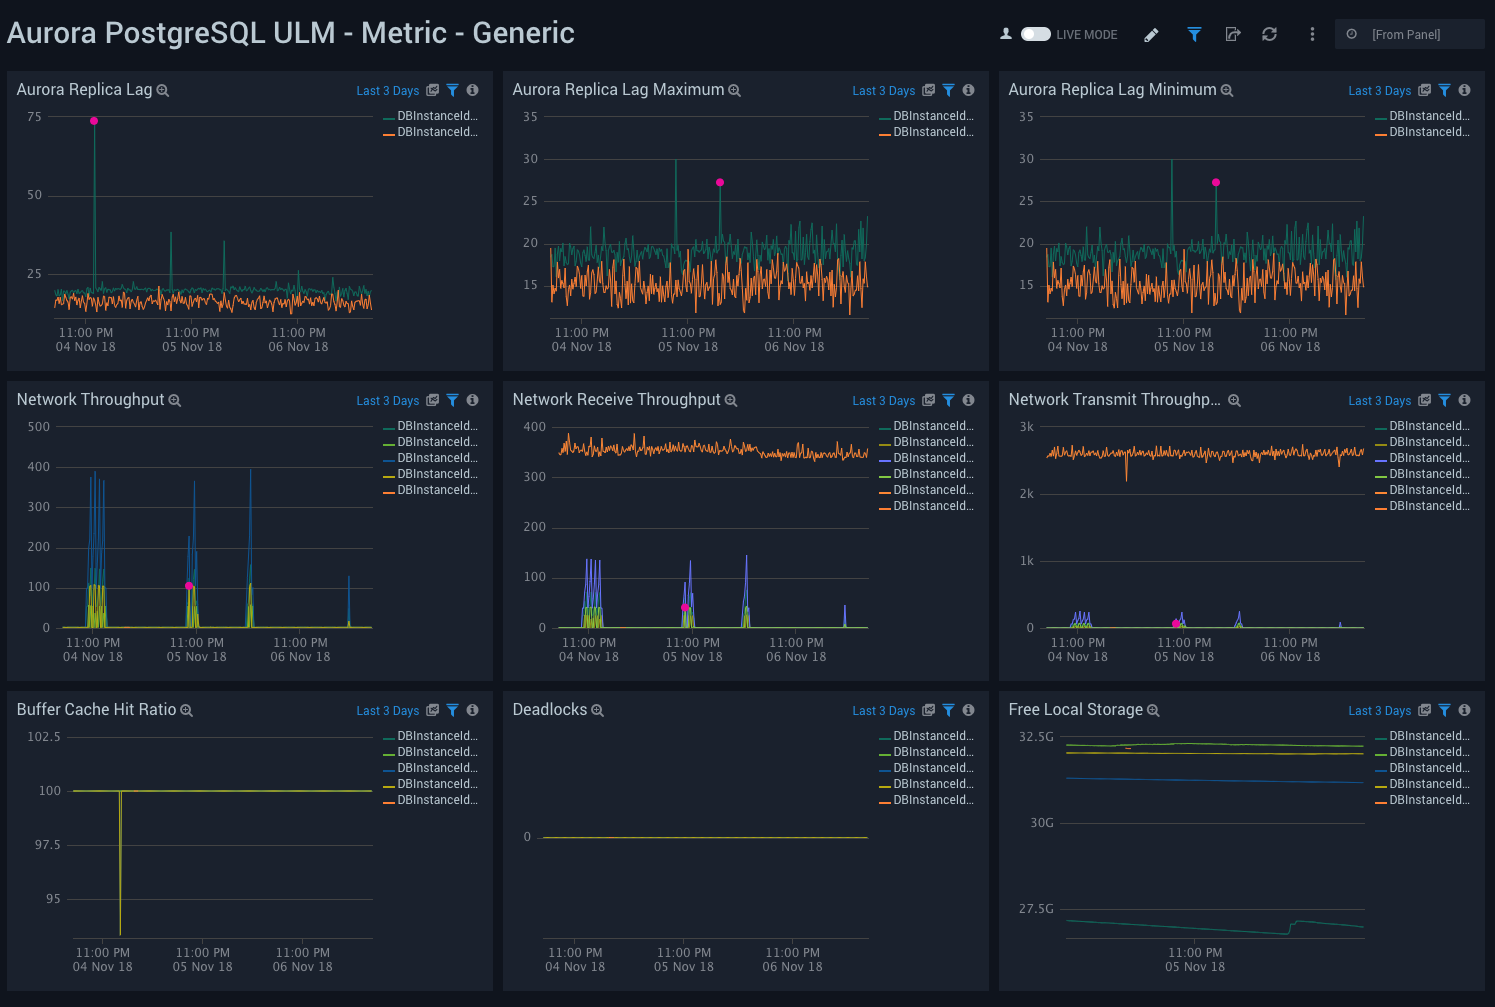
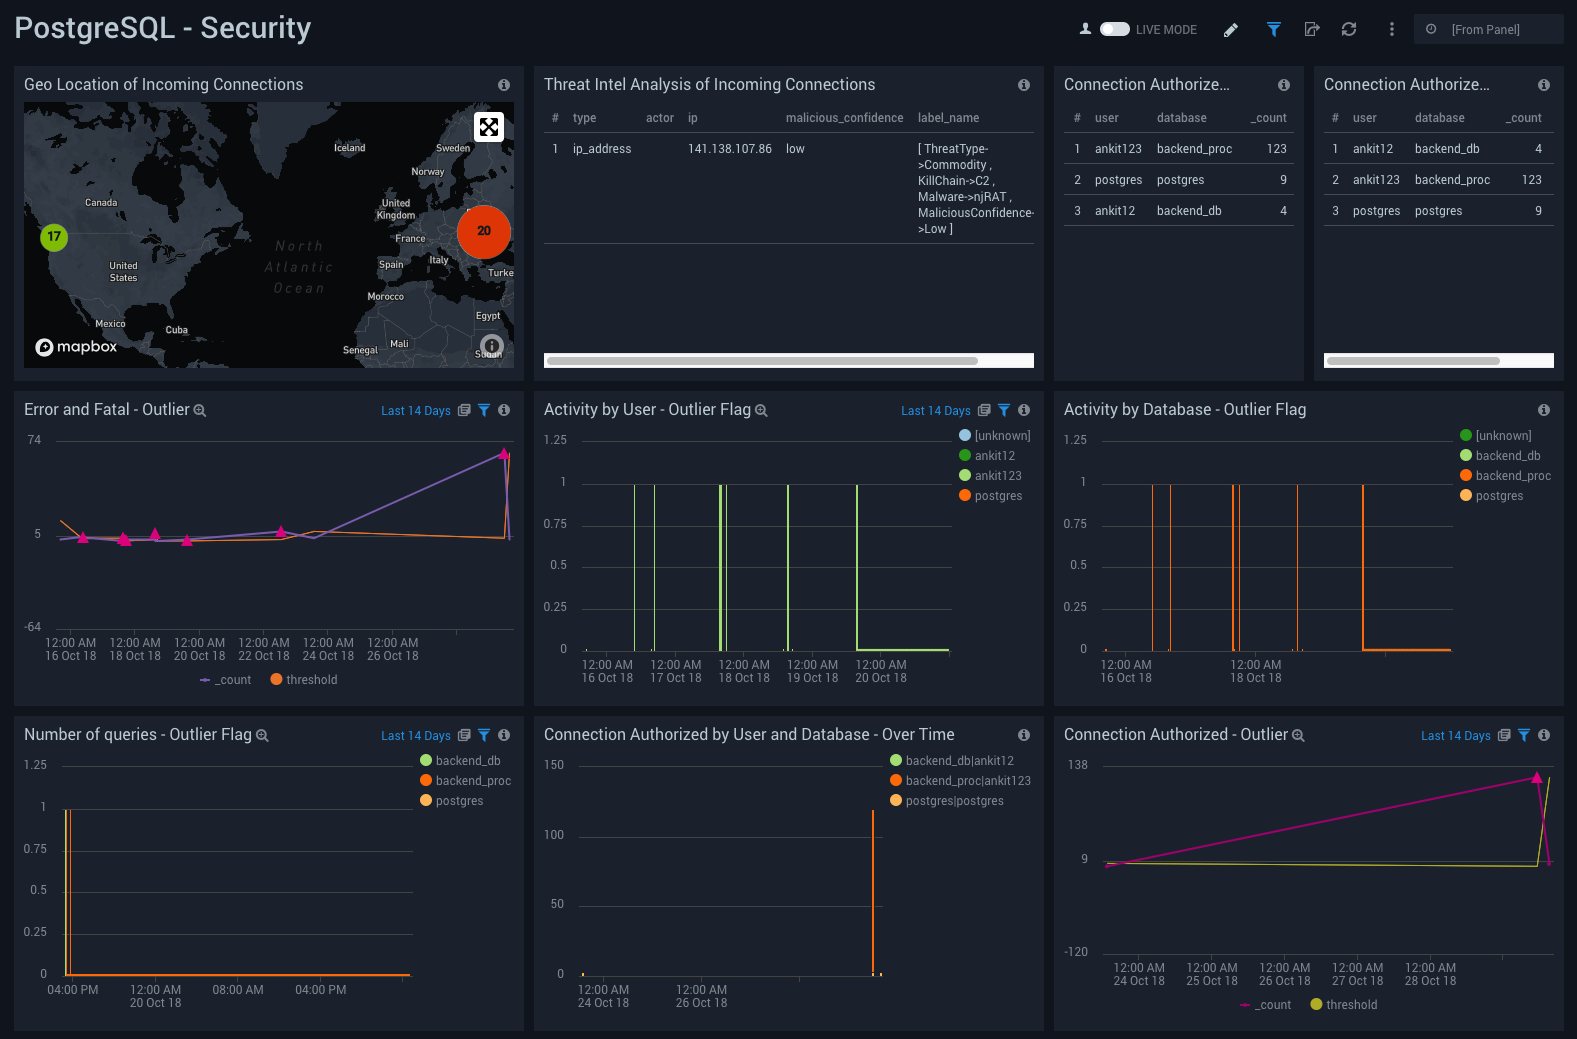
Update - We've released a new version of the PostgreSQL app that includes pre-packaged alerts. New features include support for collecting PostgreSQL metrics data using Telegraf, and for monitoring PostgreSQL in Kubernetes environments. Out-of-the-box dashboards provide insight into the health of your PostgreSQL clusters, deadlocks, replication status, query performance, slow queries, incoming connections, failed authentications and error logs. Alerts are based on Sumo Logic monitors, leverage metrics and logs, and include preset thresholds for connections, slow queries, commit rates, deadlocks, replication, locks, compression and other critical conditions.
New Sumo Logic App for Kafka with Pre-packaged Alerts
New - The Sumo Logic App for Kafka is a unified logs and metrics app that helps you monitor the availability, performance and resource utilization of Kafka messaging/streaming clusters. Preconfigured dashboards provide insights into cluster status, throughput, broker operations, topics, replication, zookeepers, node resource utilization and error logs. We also have pre-packaged alerts to help you monitor your Kafka cluster. Alerts are based on Sumo Logic monitors, leverage metrics and logs, and include preset thresholds for high resource utilization, disk usage, errors, failed connections, under replicated and offline partitions, unavailable replicas, consumer replica lag and other critical conditions.
New Pre-Packaged Alerts for Nginx ULM and Nginx Ingress ULM
Update - We've released pre-packaged alerts to help you monitor your Nginx ULM and Nginx Ingress ULM clusters. These alerts are built based on Sumo Logic monitors, leverage metrics and logs and include preset thresholds for dropped connections, critical event log messages, access from known malicious sources and 4xx and 5xx errors.
April 29, 2021 (Apps)
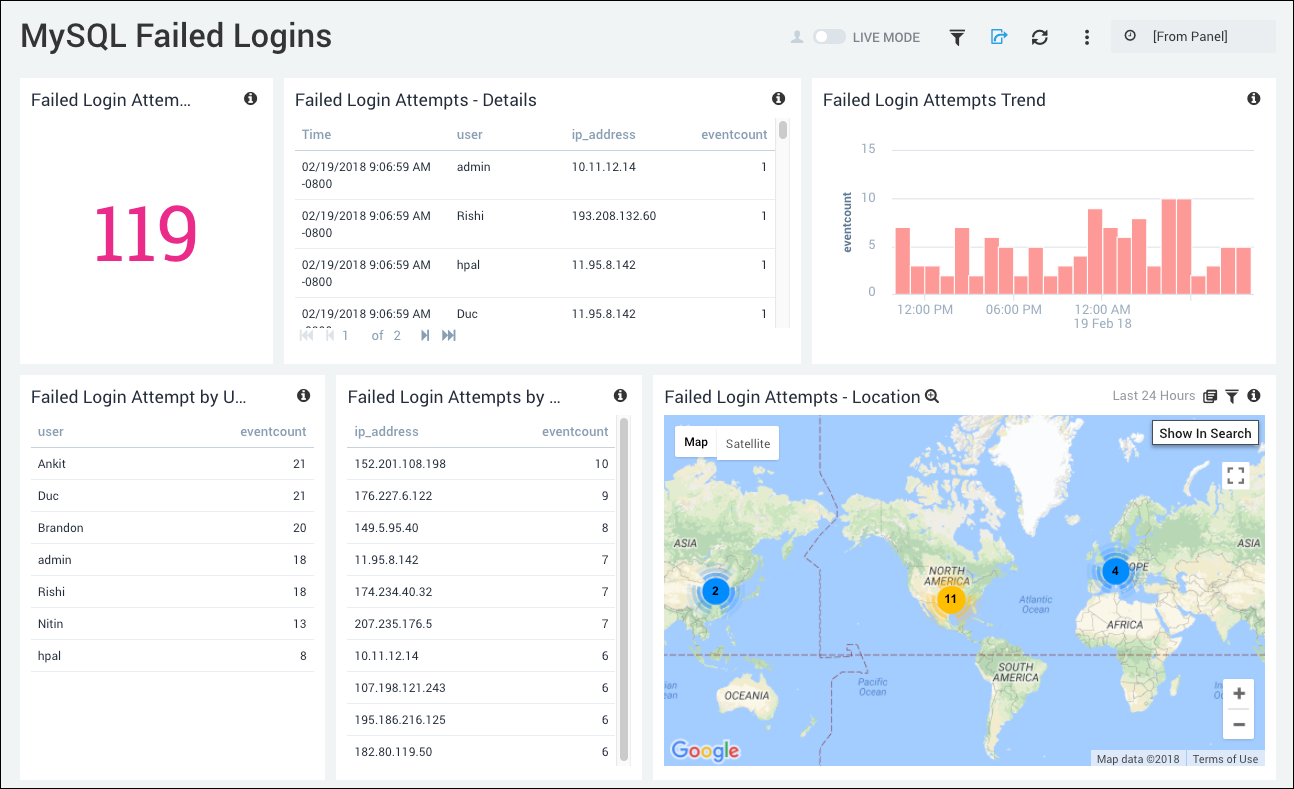
Update - We've released a new version of the MySQL app that includes pre-packaged alerts. New features include support for collecting MySQL metrics data using Telegraf, and for monitoring MySQL in Kubernetes environments. Out-of-the-box dashboards and searches provide insight into the health of your MySQL clusters, replication status, error logs, query performance, slow queries, Innodb operations, and failed logins. Alerts are based on Sumo Logic monitors, leverage metrics and logs, and include preset thresholds for connections, query run times, slow queries, resource utilization, errors, and other critical conditions.
April 29, 2021 (Search)
Update - The syntax of a URL to run a log search has changed. We've added parameters for the query, start time, and end time. The previous syntax is still supported, however, we recommend you start using the new syntax.
April 21, 2021 (Dashboard (New))
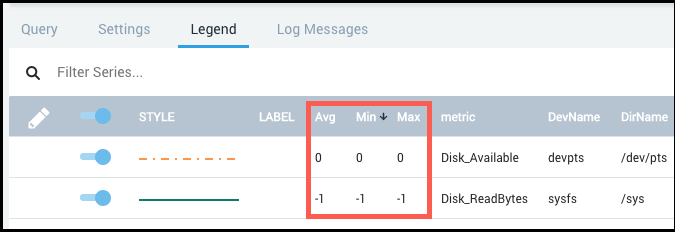
Update - We've made it easier to change what items are displayed in charts. You can now click on an item in the Legend to quickly only show it in your chart. If you want to toggle just one legend item, just hold the shift key and then click the item.
April 16, 2021 (Alerts)
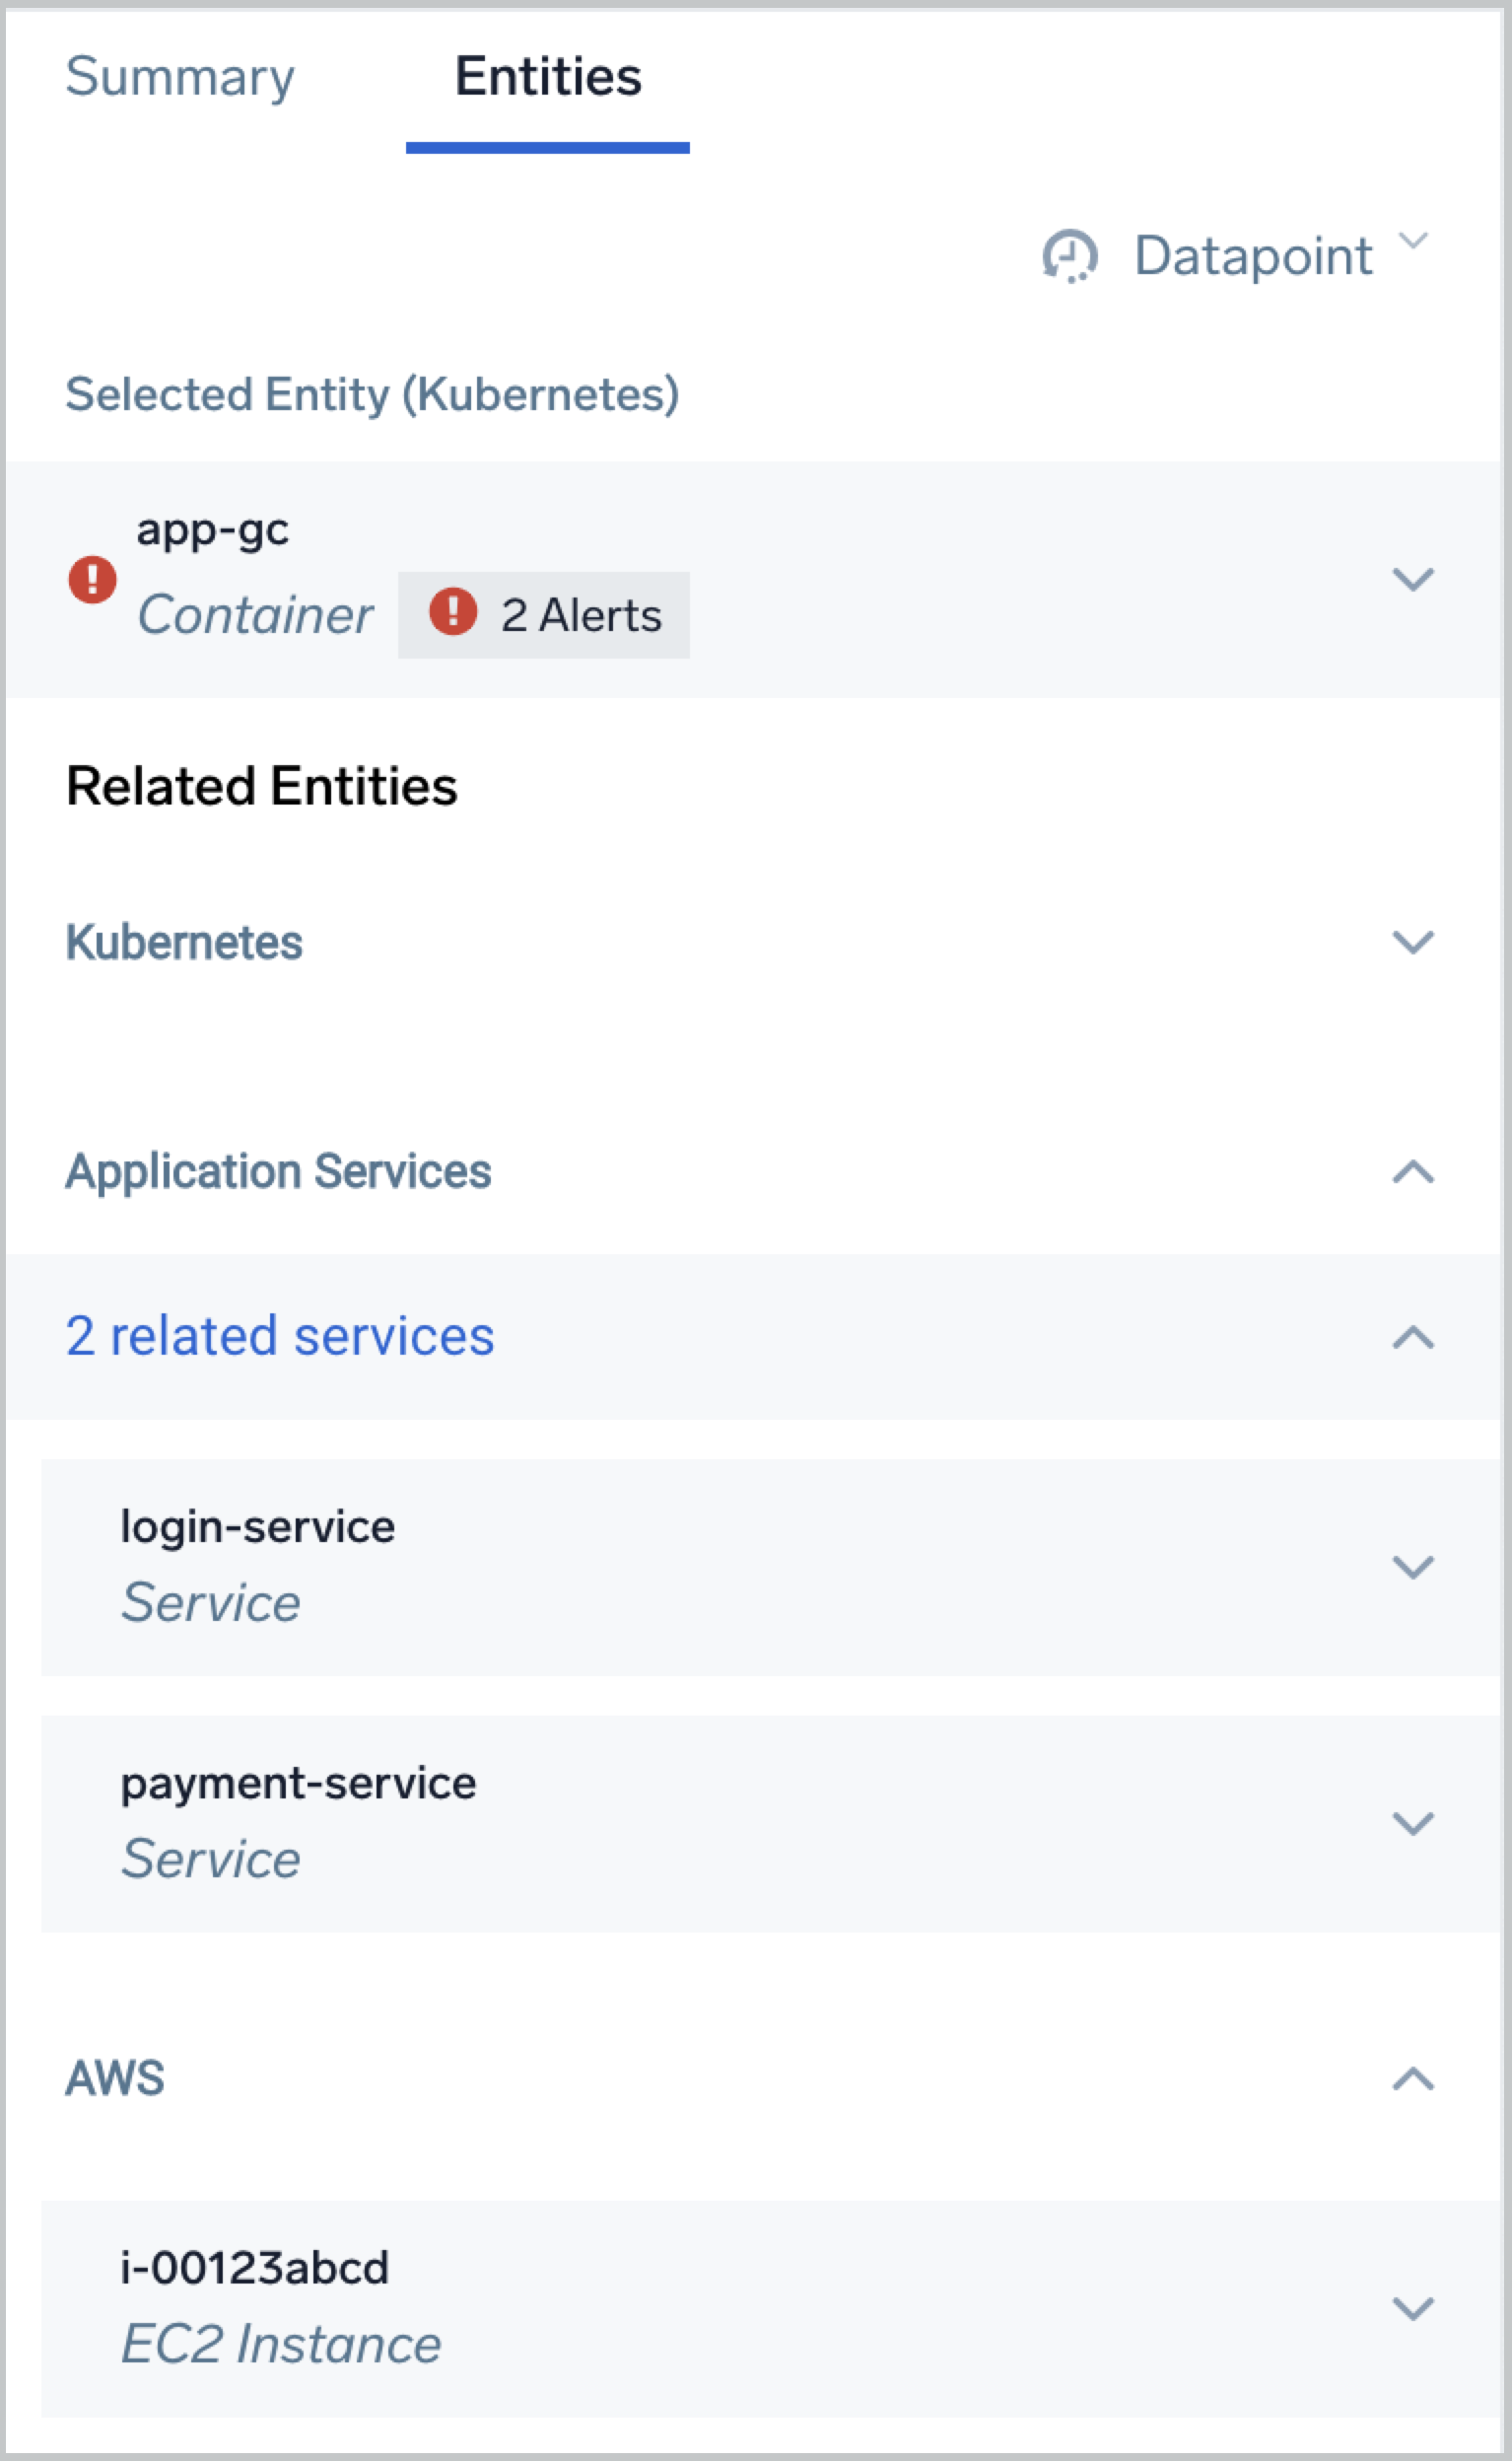
New - The Infrastructure tab now shows any triggered Monitors with a Critical, Warning, or Missing Data status for the given entity. You can click on them to view the Monitor on the Monitors page.
April 15, 2021 (Alerts)
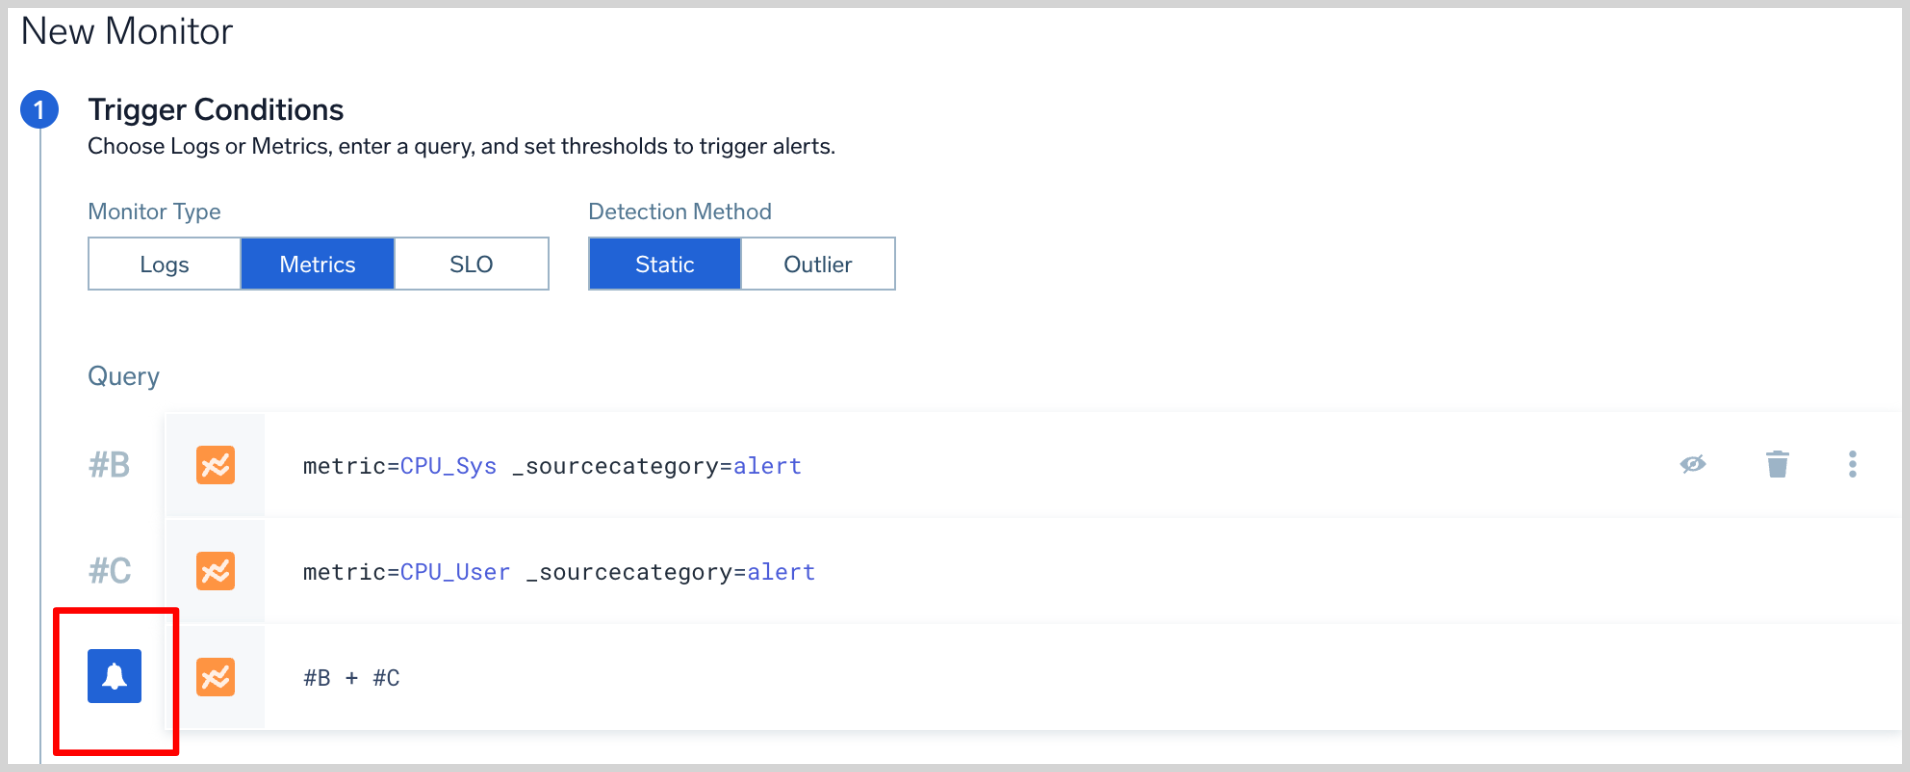
New - Log Search and Metrics Explorer now provide an option to add a Monitor based on your existing query.
Update - You now have the ability to specify a location when creating a new Monitor.
April 14, 2021 (Metrics)
Planned deprecation - The muted monitors that were automatically migrated during Round 2 have been deleted. Deprecation of old-style monitors will occur on May 3. Any of your monitors that were not automatically migrated should be manually migrated by that date. For more information, see Metrics Monitors Deprecation FAQs.
April 13, 2021 (Security)
Update - We've updated the UI for deleting a Sumo Logic user's account. The UI now provides an explicit option for deleting a user's content in addition to the user account. For more information, see Delete a User.
Update - We've enhanced role search filters: now you can grant access to Scheduled Views and Partitions in a role search filter. For more information, see Construct a Role Search Filter.
April 13, 2021 (Search)
Update - Searching the Infrequent data tier just got easier. You can now use wildcards in queries against the Infrequent data tier. For example:
_dataTier = Infrequent (_index=app_*)
For more information, see Searching Data Tiers.
April 8, 2021 (Alerts)
Update - The alert variable ResultsJson.fieldName now supports the ability to return a specific result by providing an array index value in bracket notation. For example, {{ResultsJson.fieldName}}[0] will only return the first result.
April 7, 2021 (Search)
Update - The LogReduce operator now provides an optimize option that provides up to 10x speedup over classic LogReduce on datasets with hundreds of thousands of logs.
April 6, 2021 (Dashboard (New))
Update - Dashboard (New) now supports Dynamic Parsing and Receipt Time. You can set the options under the general settings of a panel built to display log data.
April 1, 2021 (Alerts)
Update - The alert variable Results.fieldName is now supported in email notifications. This allows you to include the value of a specific field from your results.
March 31, 2021 (Metrics)
Update - We've implemented some limitations on the number of metrics metadata tags that Sumo Logic will accept, and the length of metadata keys and values. Limiting the volume and length of metrics metadata ensures that noisy sources of metrics don't inundate your account with excessive metadata. For more information, see Metrics Metadata Limits.
March 30, 2021 (Metrics)
Planned deprecation - Round 2 of automatic migration is complete. We'll start deleting the old monitors on April 13. For information, see Metrics Monitors Deprecation FAQs.
March 25, 2021 (Explore)
Update - Explore now offers the ability to filter your view so you can focus on specific entities and sections of your system.
March 24, 2021 (Traces)
New - We're excited to announce our Service Map and Dashboards. A Service Map is a high-level out-of-the-box overview of your environment created from distributed tracing data. Service Maps provide you a real-time view of:
- Your microservices and connections between them, to give you insight into their dependencies and relations.
- Health and load of each microservice reflected in size and color, so you can immediately ascertain potential problems and bottlenecks in your application infrastructure.
Read more about how our Service Map & Dashboards Provide Insight into Health and Dependencies of Microservice Architecture
Interested in training? Register for an Enhanced Tracing with Sumo Logic webinar on 3/25/21 from 9am-11am PST.
March 22, 2021 (Metrics)
Planned deprecation - Round 1 of automatic migration is complete and the old monitors have been deleted. Round 2 of automatic migration will start on March 29. For more information, see Metrics Monitors Deprecation FAQs.
March 16, 2021 (Manage)
Update - Scheduled View queries now provide syntax highlighting and support multiple lines and comments.
March 16, 2021 (Alerts)
Update - We have resolved a discrepancy in the notification payload of Real Time Scheduled Searches.
Previously, the payload for subsequent real time alerts in a given time range would incrementally report the results and omit the records that were already present in the previous alert.
For example, if the Scheduled Search initially returned 10 records, the first alert notification would contain 10 records in the payload. If the next run contained the same 10 records plus 1 additional, the notification payload would only contain the single new record.
Going forward, we will ensure that the records sent in the notification payload will always contain all the records returned in the Scheduled Search. Following the above example, the next run of the Real Time Scheduled Search would return 11 records. This change ensures that the payload will always match the results of the search in Sumo Logic.
March 12, 2021-12 (Collection)
New - Our Cloud-to-Cloud Integration Framework has the following new Sources:
March 11, 2021 (Metrics)
Planned deprecation - Round 1 of automatic migration is complete. Most monitors were successfully migrated and are now muted---we'll start deleting them on March 18. If you have monitors that were not successfully migrated, we'll let you know which monitors weren't migrated and why. For information about how to manually migrate those monitors, see Metrics Monitors Deprecation FAQs.
March 8, 2021 (Apps)
Update - We have updated our Enterprise Audit - Security Management App to now support ServiceAllowlist audit events.
March 4, 2021 (Observability)
Update - We're delighted to announce several enhancements to Root Cause Explorer. Root Cause Explorer now supports two additional AWS namespaces, as well as Events of Interest detection on Kubernetes and Trace metrics. Cause-impact analysis is now informed by Sumo Logic Tracing's Service Map, AWS X-ray, Kubernetes entities, and AWS inventory relationships. You'll also notice new filters and search builders at the top of the page to correlate Events of Interests at the service, orchestrator, AWS infrastructure, and host levels to speed up the identification of root causes. You can use the Infrastructure tab for an Event of Interest to pivot to dashboards, logs, metrics and, trace searches to take the next steps in root cause analysis.
March 1, 2021 (Metrics)
Planned deprecation - We're starting the next step in the process of Metrics Monitors today: we're beginning the first of two rounds of migrating old-style monitors to new Monitors. The next milestone is March 15, when we'll remove the old monitors that were successfully migrated in the first round. For more information, see Metrics Monitors Deprecation FAQs.
February 26, 2021 (Dashboard (New))
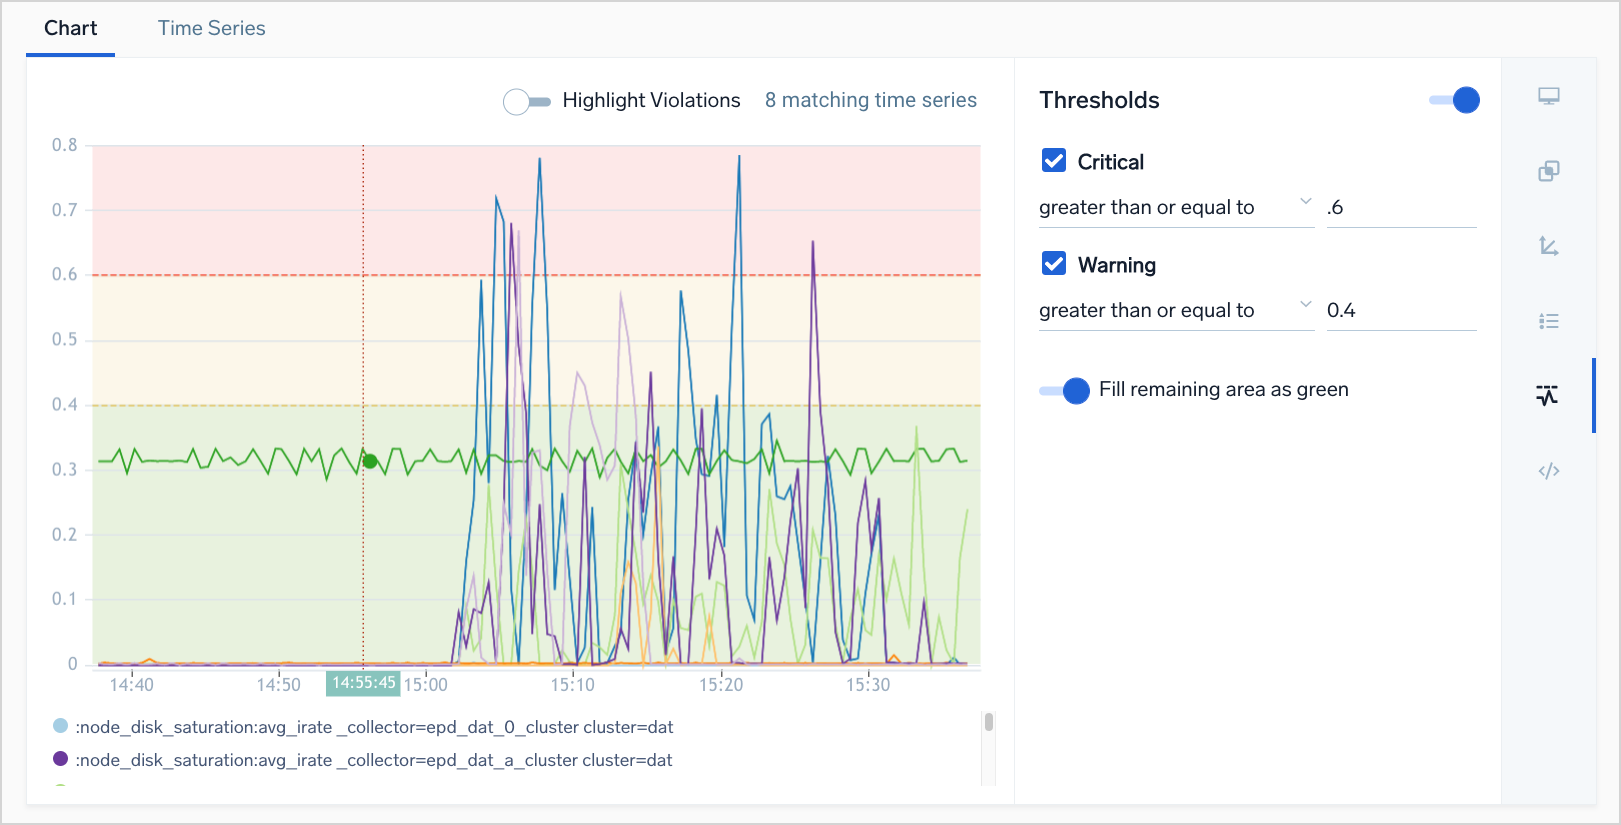
Update - Dashboard (New) is all about visual control! We're happy to announce that you can now add units to your charts to make them even easier to consume. With the updated chart units on dashboard panels, you can select a base unit and the chart will auto-adjust the unit as the numbers scale, making the data immediately understandable. See how to modify chart axes for details.
February 25, 2021 (Apps)
Update - We are excited to announce out-of-the-box alerts for Kubernetes. We have also updated the dashboards and views in the Kubernetes App to accelerate entity-based troubleshooting of Kubernetes environments.
New - We are excited to announce a new Microsoft Teams app that provides out-of-the-box dashboards to monitor users, teams, channels and permission changes.
February 23, 2021 (Alerts)
New - Microsoft Teams webhook connection is now available to send notifications from alerts to Microsoft Teams.
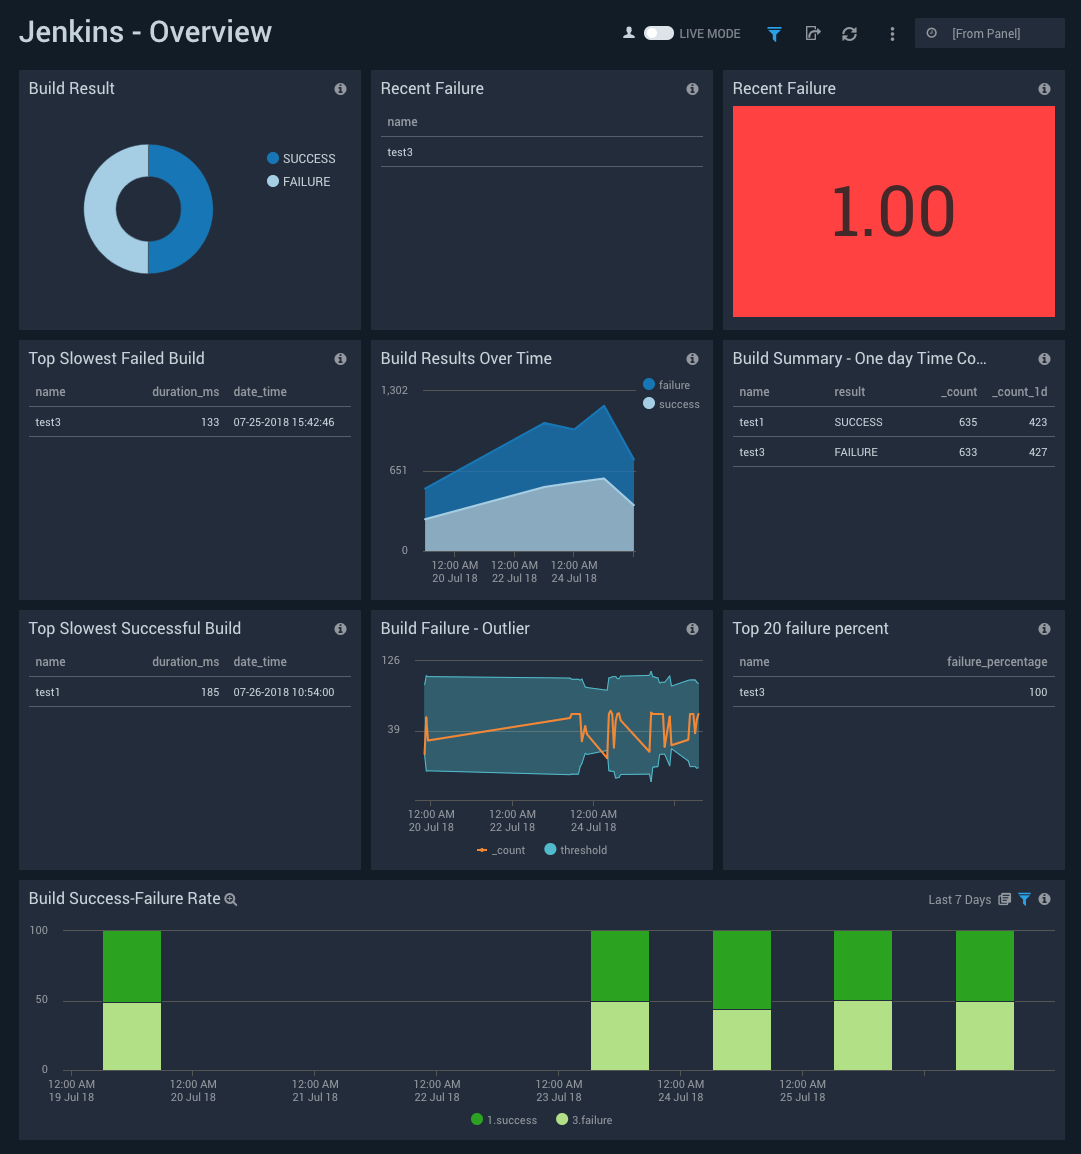
February 23, 2021 (Sumo Logic Jenkins Plugin)
Update - We are happy to announce a new version v2.2.1 of the Sumo Logic Jenkins plugin. The plugin has been updated with a new Jenkins pipeline step SumoSDOEvent which can be used to send instrumented events to Sumo Logic.
February 22, 2021 (Metrics)
Planned deprecation - We've taken the next step in the process of Metrics Monitors today: the ability to create new Metrics Monitors from the UI and API is disabled. For more information, see Metrics Monitors Deprecation FAQs.
February 15, 2021 (Metrics)
Planned deprecation - We're planning to deprecate the Metrics Monitors feature in favor of the Monitors feature we released late last year, which unifies the alert experience across logs and metrics. Important to note: Sumo Logic will automatically migrate most of your existing metrics monitors. The deprecation process will occur in stages, starting next week and culminating in early May. Today, affected customers will receive an in-product communication describing the deprecation process and schedule and what to expect. For more information, see Metrics Monitors Deprecation FAQs.
February 12, 2021 (Security)
Update - We're releasing a change to audit logging for monitors on Monday, February 15. We've improved the audit logging we do when you import, copy, or delete a monitor. We now log an audit event for every object created or deleted by an import, copy, or delete operation.
February 10, 2021 (Manage)
Update - We made the process of transferring a deleted user's content to another user more comprehensive. Now, when you select a new owner for the deleted user's Library content, scheduled views will be transferred to the new owner, as well as the user's folders, searches, scheduled searches, and dashboards. For more information, see Delete a User.
February 5, 2021 (AWS Observability)
Update - We are excited to announce support for ECS, ElastiCache, and Network Load Balancers as well as out-of-the-box alerts for all supported services. As part of this release we have documented changes included in each version of our CloudFormation installation template, which will help you understand when to upgrade.
February 3, 2021 (Manage)
Update - There are two changes to the Partitions page in the Sumo Logic UI. What we previously called the General Index is now the Default Continuous Partition. This is where any data you ingest that isn't assigned to a partition goes. You'll also notice that the Partitions page now lists Sumo Logic internal indexes, like the Audit Event Index and the Data Volume Index. This gives you the flexibility to manage the retention period for each index independently. By default, each internal index has the same retention period as the Default Continuous Partition.
January 22, 2021 (Metrics)
Update - We've made a small change to the Metrics Explorer that makes a big difference: Advanced Mode now supports auto-complete. Now, just as in Basic Mode, you can construct metric queries in Advanced Mode by selecting metadata fields, dimensions, metrics, and operators from pull-down lists.
January 22, 2021 (Infrastructure)
Update - We've updated the troubleshooting links in the Infrastructure tab to be easier to understand. The original buttons have been replaced with a dropdown menu with labels next to the buttons.
Update - The Infrastructure tab now provides a time option to select if the displayed Entities and Environments are related to the current time or the moment of time around the data point you clicked on.
January 20, 2021 (Alerts)
Update - When we released Monitors (our new alerting framework), we introduced new template variables to be used within Notifications for full customizability of what information is provided in the notification. We are pleased to announce that we are extending support of these variables to Scheduled Searches and Metrics Monitors pages.
January 15, 2021 (Dashboard (New))
Update - Dashboard (New) now offers a dark theme. Dark Theme makes dashboards pop by putting light colored visualizations and text on top of a darker background. This enables you to build gorgeous dashboards with eye-catching contrast.
Update - Categorical column and bar charts from metrics queries now have a Group By setting that lets you group data by other dimensions.
January 11, 2021 (Alerts)
Update - The payload editor for webhook connections provides syntax highlighting, indentation, and validation.

 \
We've made it easier for you to Manage Logs and Metrics settings by removing the generic Settings area. This should help you easily locate which settings you want to manage for Logs or Metrics:
\
We've made it easier for you to Manage Logs and Metrics settings by removing the generic Settings area. This should help you easily locate which settings you want to manage for Logs or Metrics: