Create a Monitor
This topic shows you how to create a monitor.
Step 1: Open New Monitor window
From your Monitors page
- Go to the Monitors page by clicking Manage Data > Monitoring > Monitors.
- Click on the Add button > New Monitor to add a new Monitor. The creation dialog box will appear.
From your Dashboard
- From a Dashboard, hover your mouse over a panel, click the kebab icon, then Open in Log Search.
- From your log search view, click the kebab icon in the upper right corner, then Create a Monitor.
From your Log Search
- Click the kebab icon in the upper right corner, then Create a Monitor.
From your Metrics Explorer
Creating a monitor based on the threshold values defined in the Metrics page can save time and effort. By using the pre-filled monitor editor, you can quickly create a monitor with the same threshold values as defined in the Metrics page. This will ensure that the monitor is using the same criteria as the Metrics page, providing consistency in monitoring.
To create a monitor from the Metrics Explorer, follow the steps below:
- Open the Metrics Explorer page and enter the metrics query to create a monitor from it.
- In the Threshold section, define the critical and warning thresholds for your metrics query.
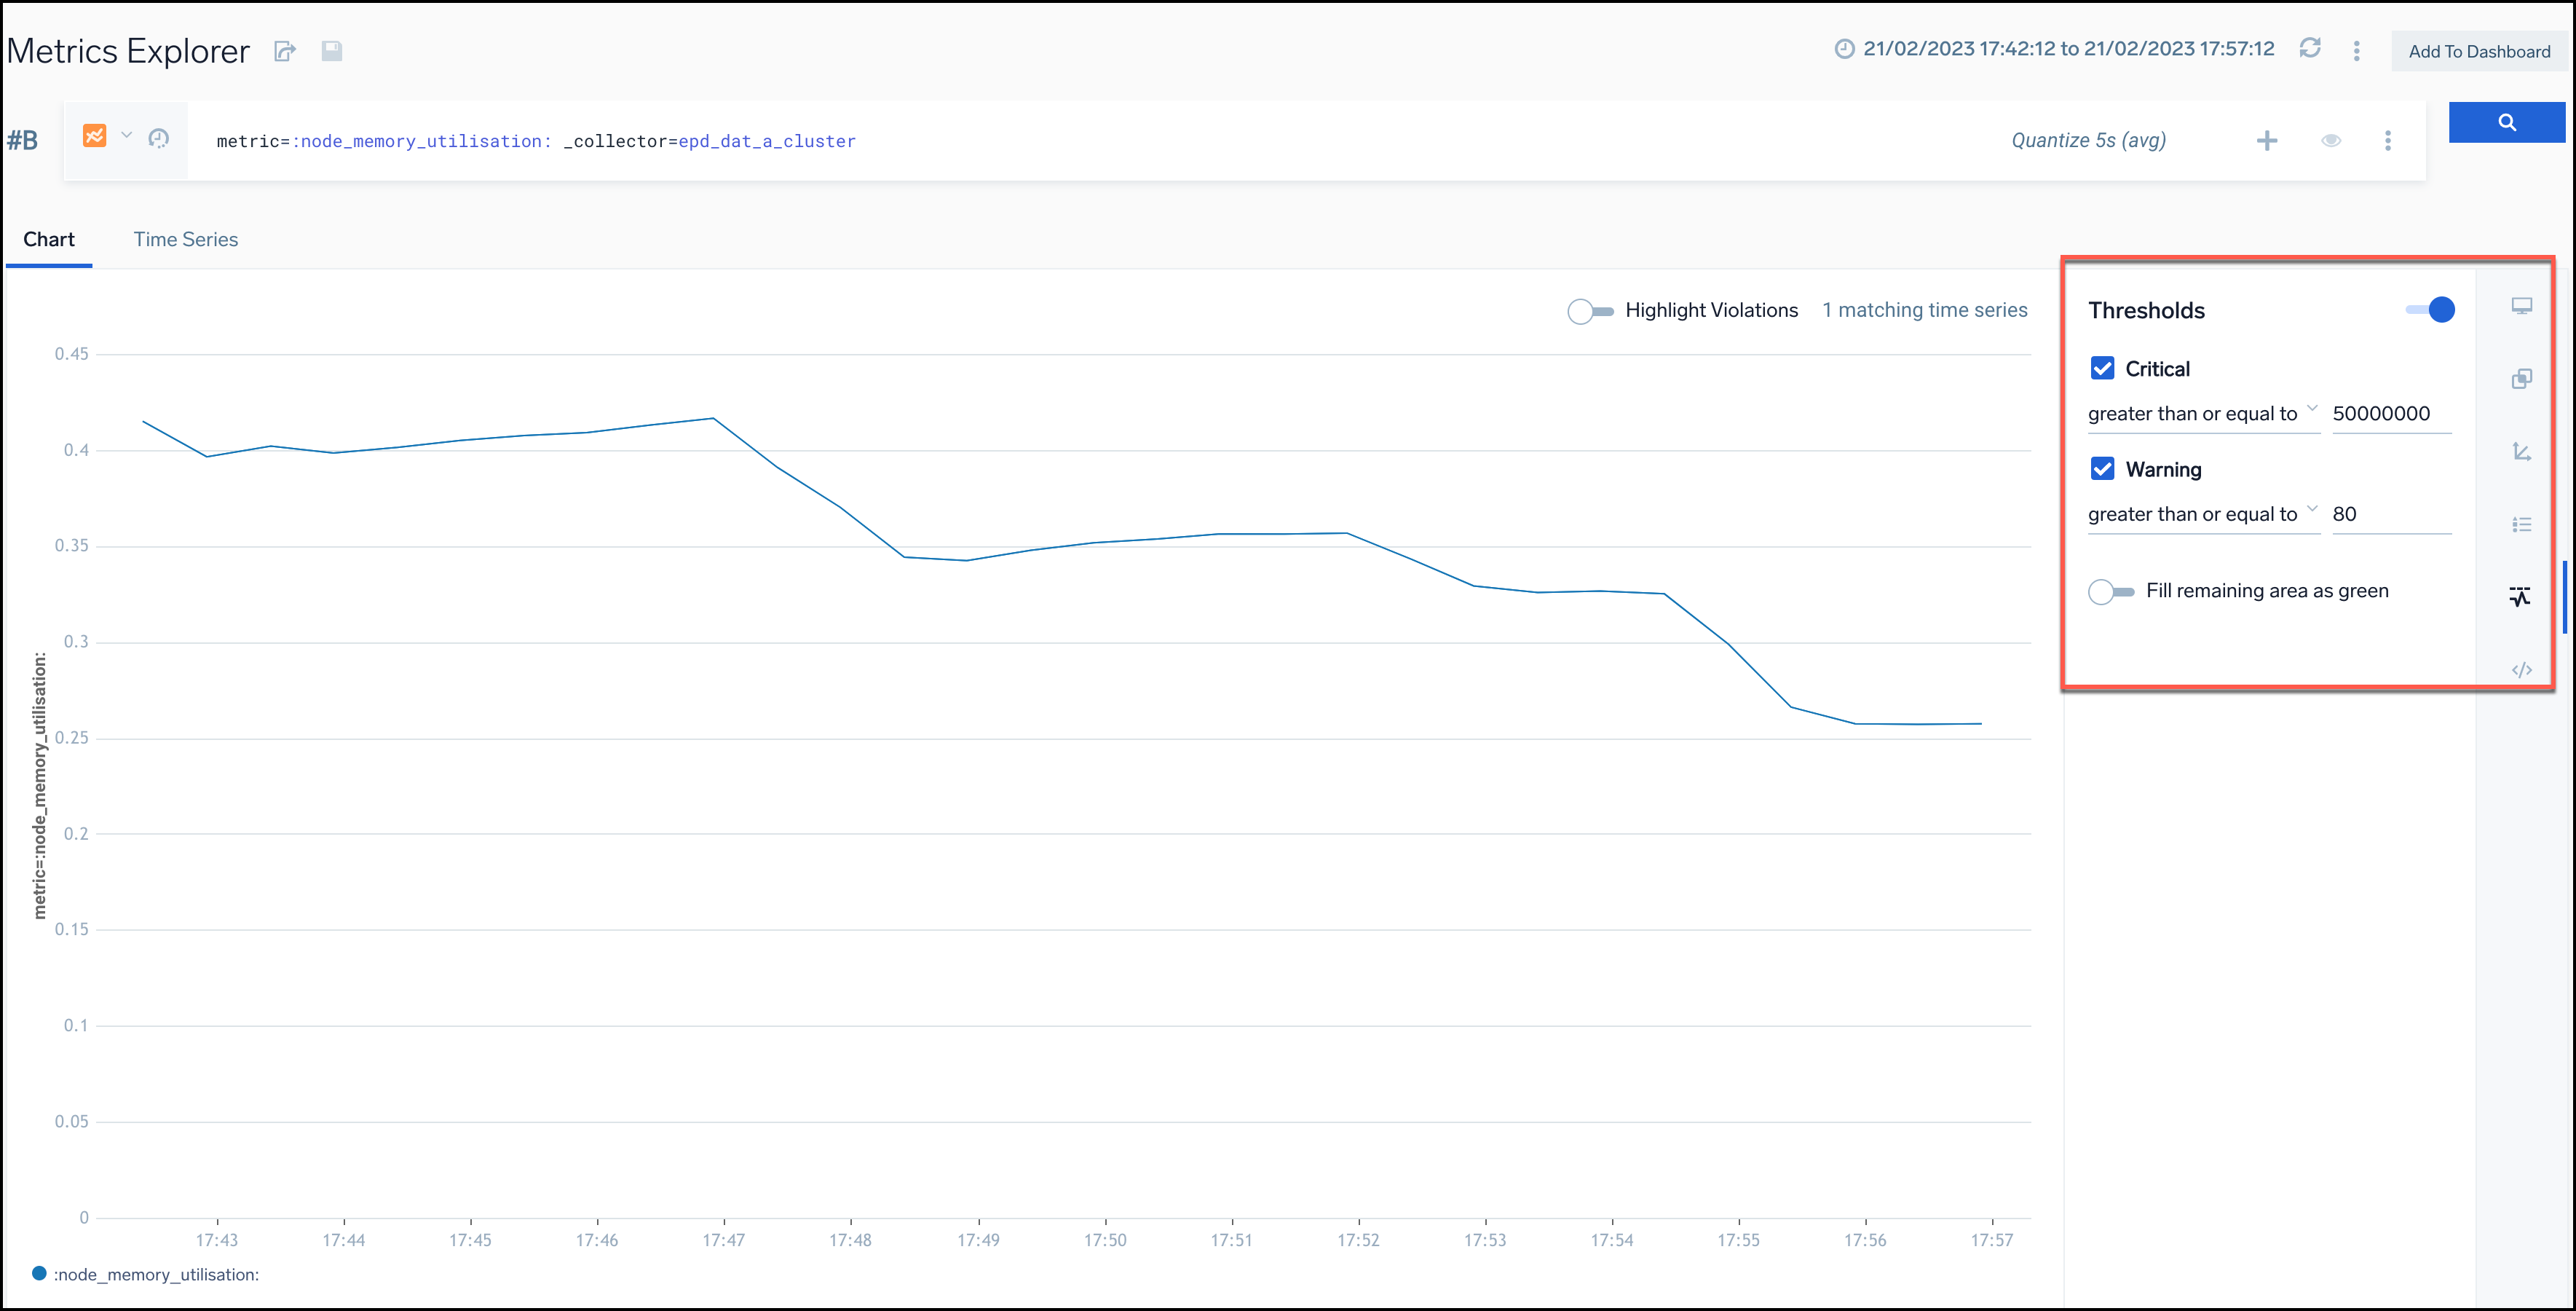
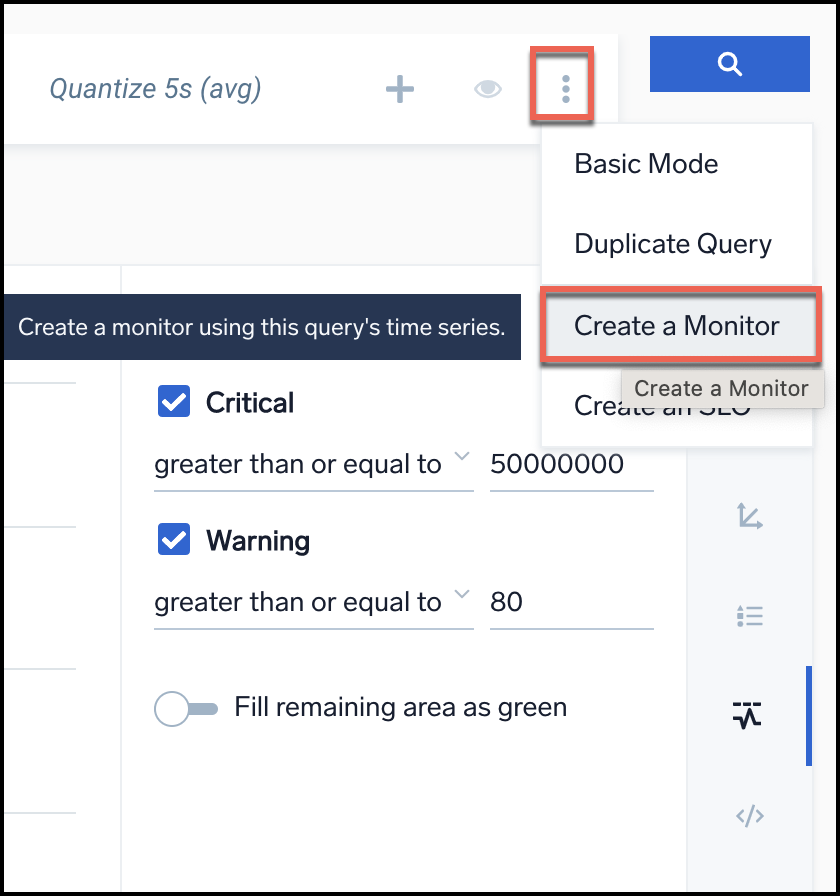
- Click the Create a Monitor button located at the top right of the page.
- The Monitor Editor will open with prefilled data based on the threshold values set on the Metrics page.
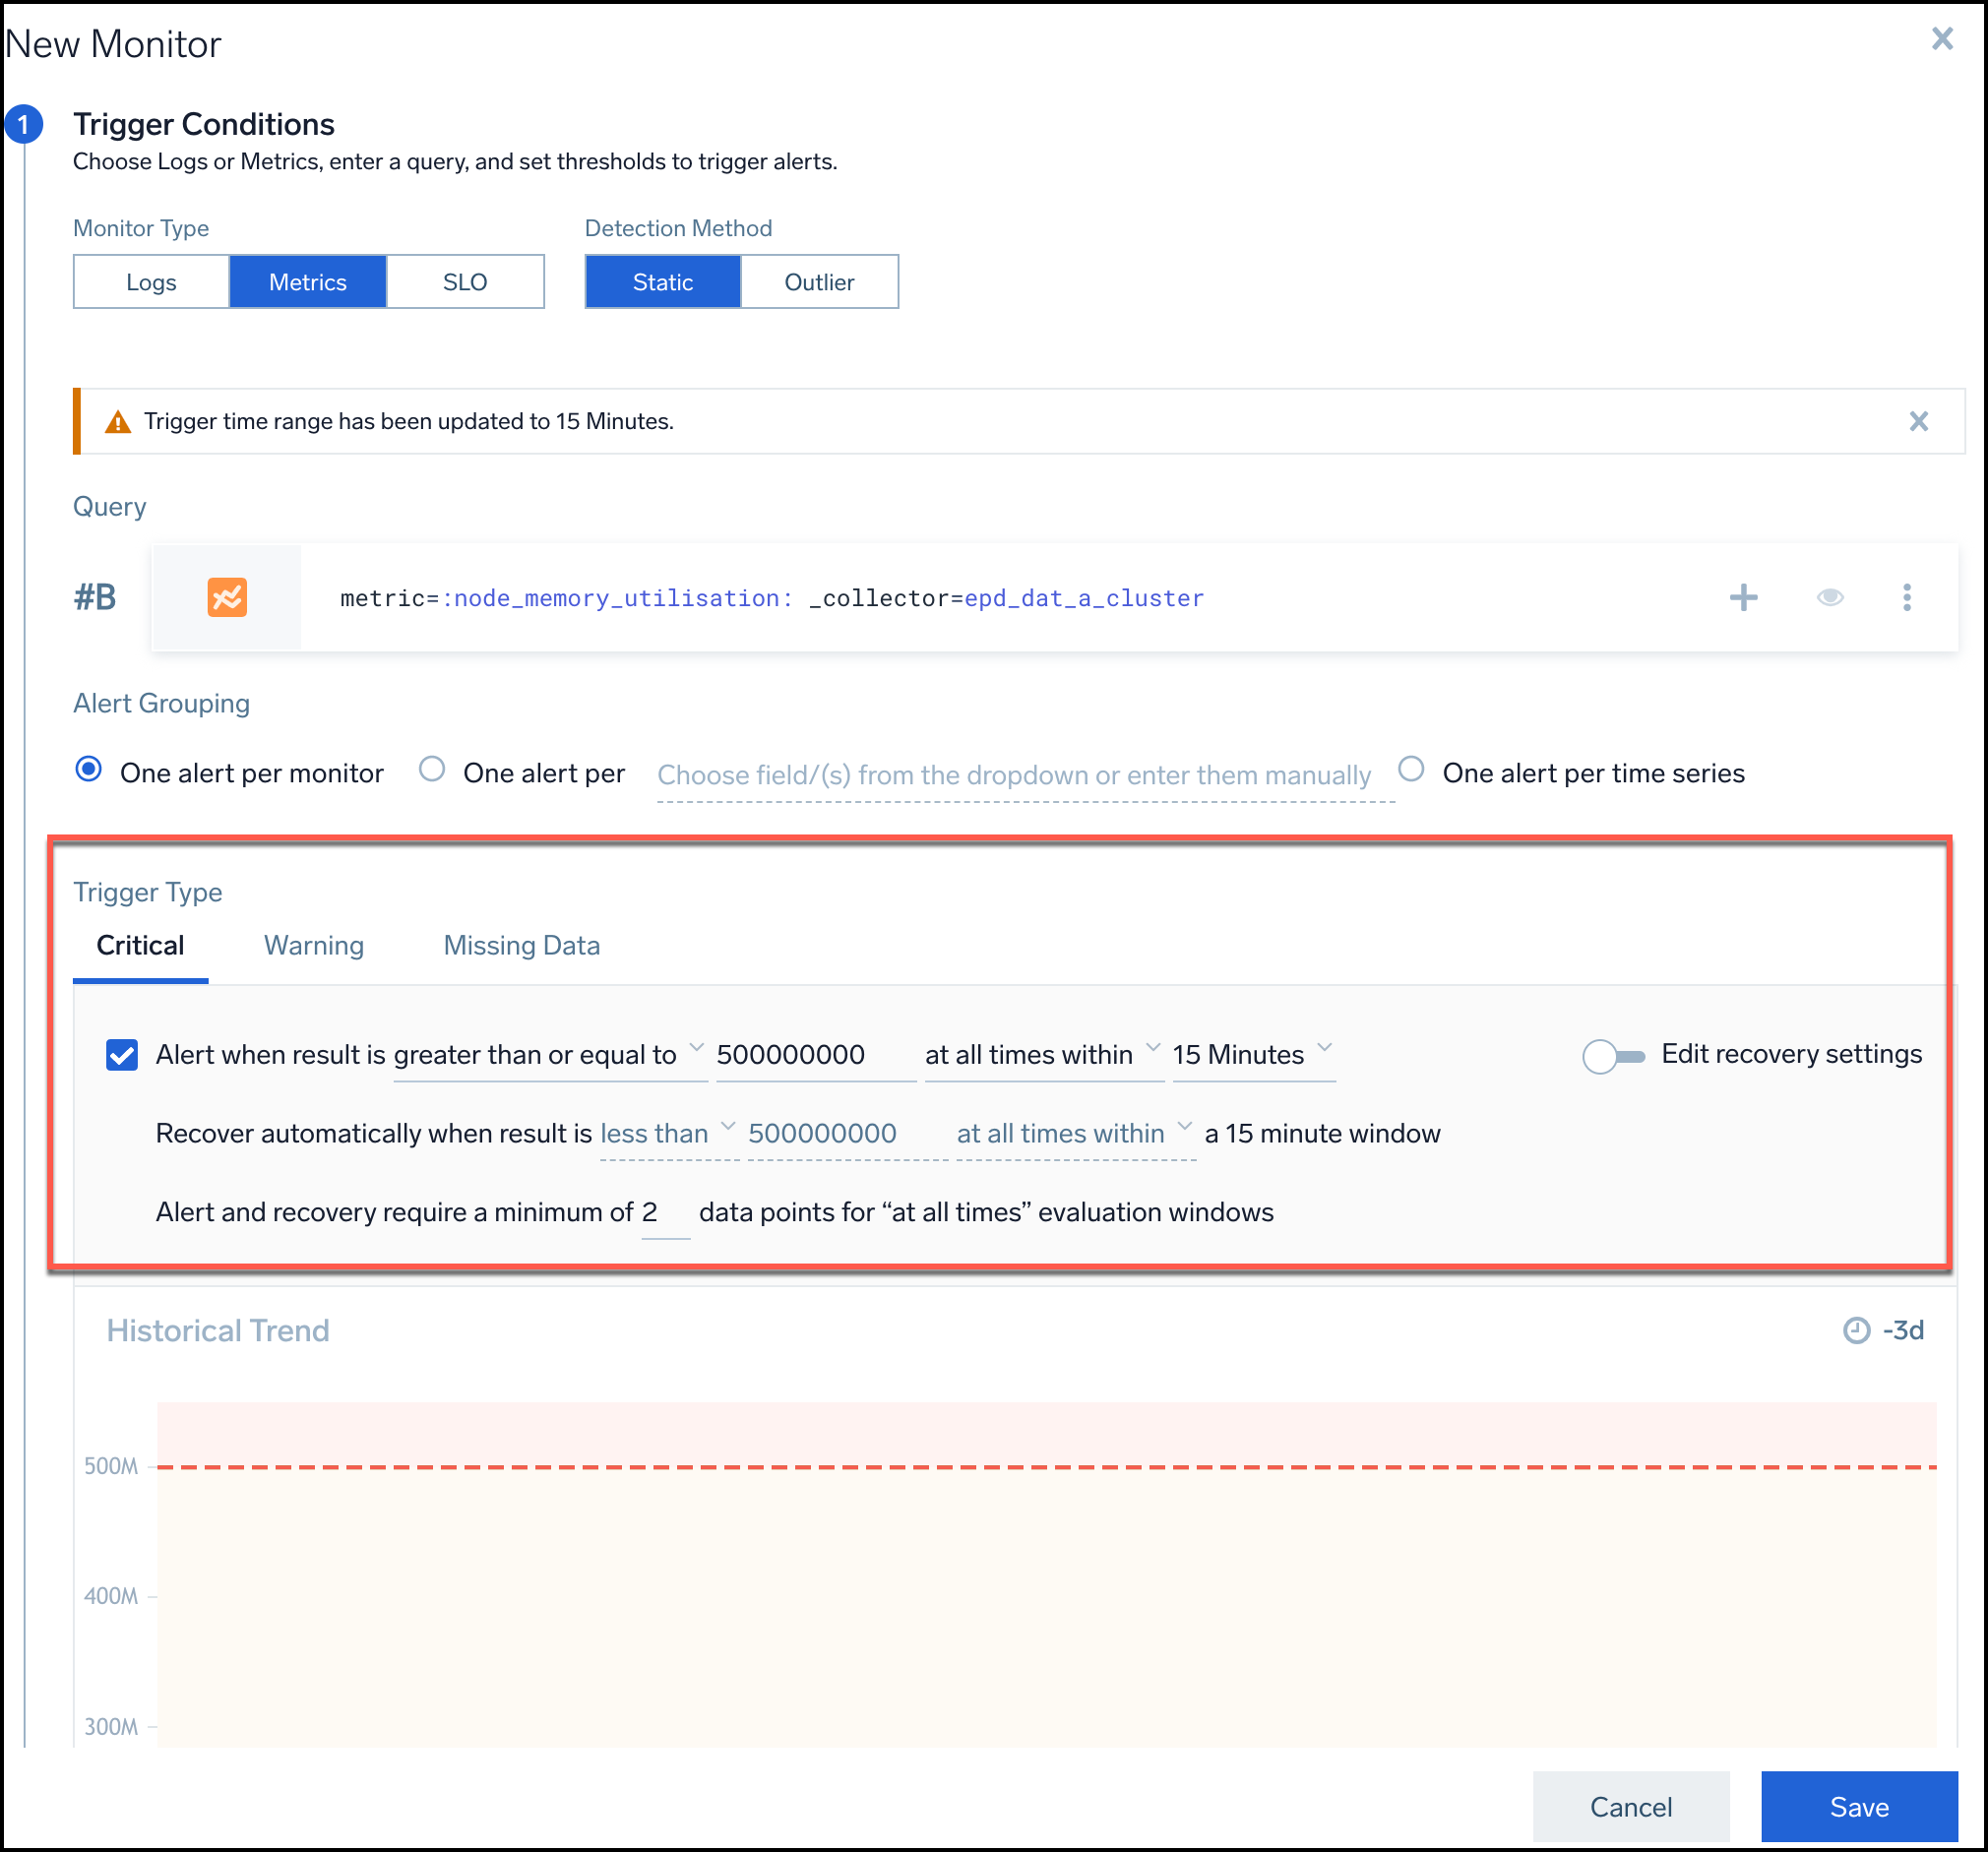
- In the Trigger Type section of the monitor editor, enable the checkbox that corresponds to the threshold value that you want to use (either "Critical", "Warning", or both).
- The threshold values will be the same as defined in the Metrics page for both Critical and Warning thresholds.
- All other parameters should be set to default, including the window (15 minutes) and the "at all times" box.
- Ensure that the Recover value is set to the default, which is the opposite of the Alert value. The Edit Recovery button should be off.
- Once all values have been set, click on Save to create the monitor.
- The same threshold will also be applied to the histogram chart.
Note that the same threshold translating functionality supports to Opening Alerts Response Page in the Metrics Explorer and Opening Monitor in the Metrics Explorer.
Step 2: Select Monitor type and Detection Method
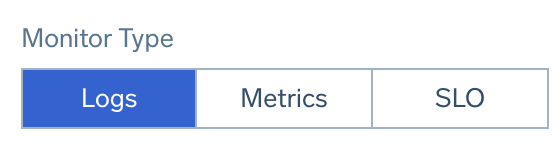
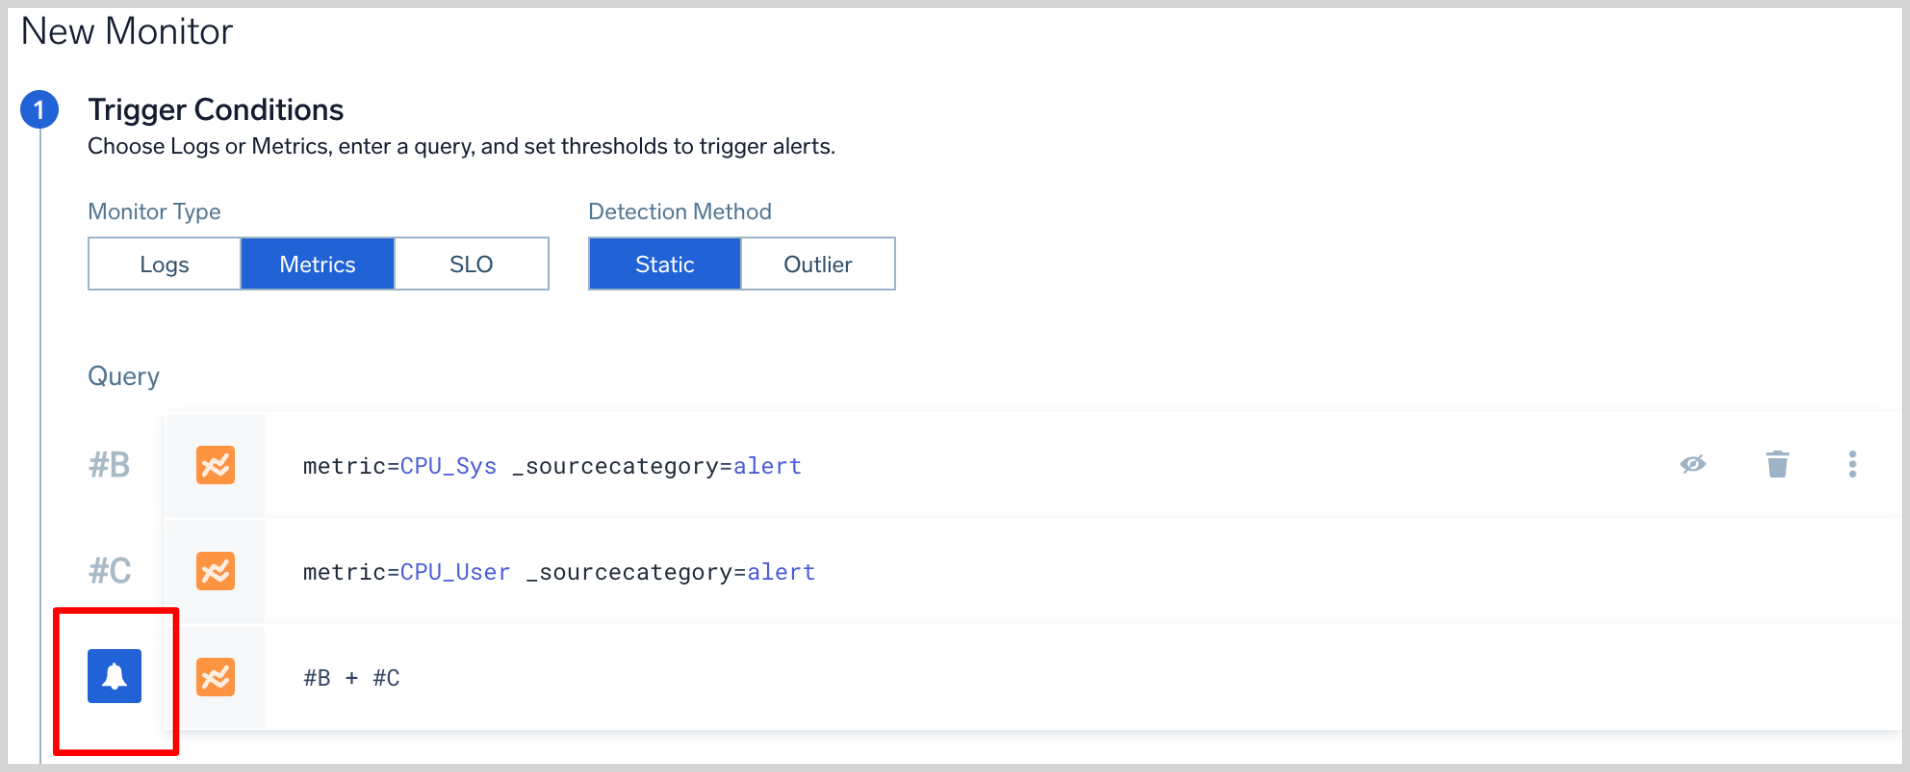
- Select a Monitor Type (Logs, Metrics, or SLO).
- Select a Detection Method (Static or Outlier).
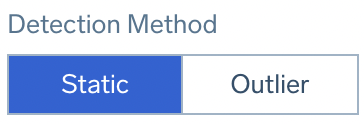
- Static allows you to set specific threshold conditions. Use this detection method when you are alerting on KPIs that have well defined and constant thresholds for what's good and bad. For example, infrastructure metrics like CPU utilization, and memory.
- Outlier lets you detect an unusual change or a spike in a time series of a key indicator. Use this detection method when you are alerting on KPIs that don't have well-defined constant thresholds for what's good and bad. You want the Monitor to automatically detect and alert on unusual changes or spikes on the alerting query. For example, application KPIs like page request, throughput, and latency.
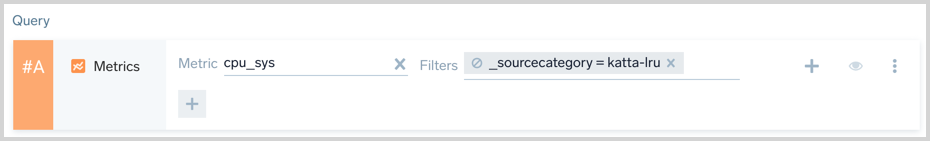
Step 3: Provide a Query
Provide a Log or Metrics query.
- Logs Monitors can have one query up to 4,000 characters long.
- Metrics Monitors can have up to six queries. When providing multiple metrics queries, use the letter labels to reference a query row. The Monitor will automatically detect the query that triggers your alert, and will mark that row with a notification bell icon. See joined metrics queries for details.
If you're using the Outlier detection method, you'll need to select the Direction you want to track (Up, Down, or Both).

- Up. Only get alerted if there is an abnormal increase in the tracked key indicator.
- Down. Only get alerted if there is an abnormal decrease in the tracked key indicator.
- Both. Get alerted if there is any abnormality in the data whether an increase or a decrease.
If you chose the Static detection method, you won't see this option.
Step 4: Specify the Trigger Type
- Specify the Trigger Type. A Monitor can have one critical, warning, and missing data trigger condition, each with one or more notification destinations. Triggers have different options depending on the query and alert type. Click the Expand button next to the query type you're using for configuration details.
Logs Trigger Types (expand to view)
Logs Trigger Types
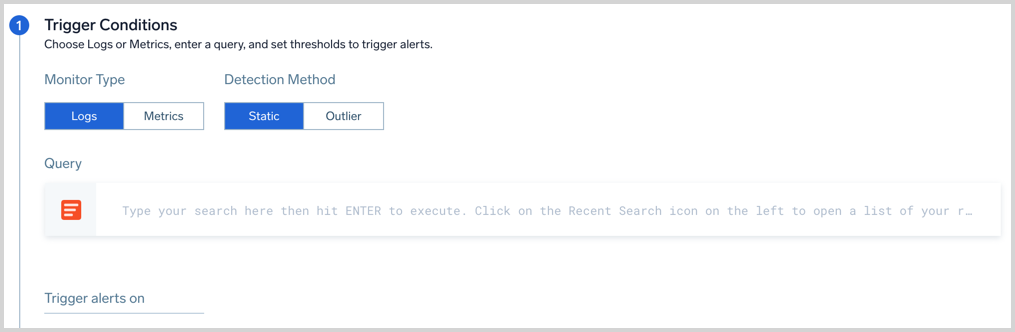
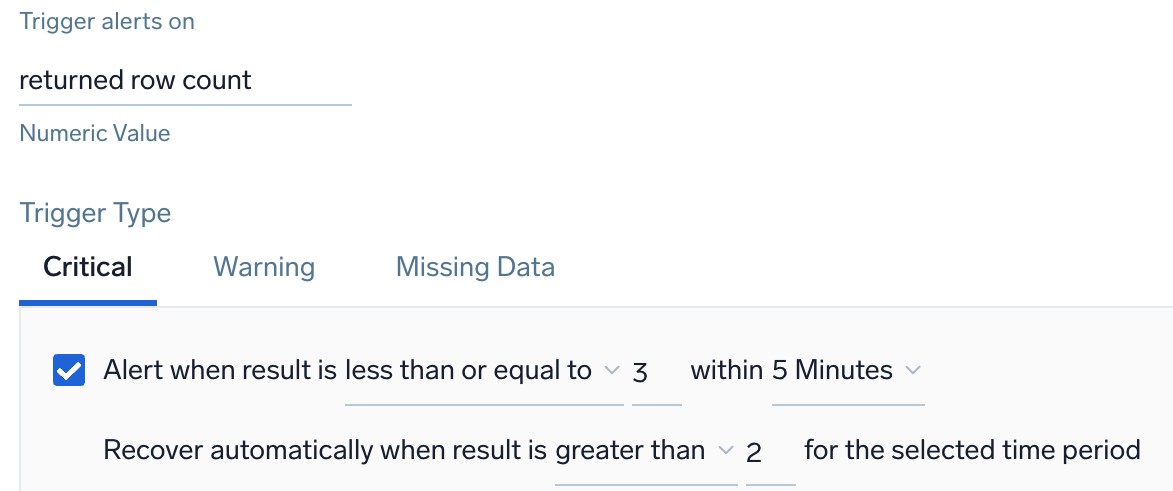
Trigger alerts on: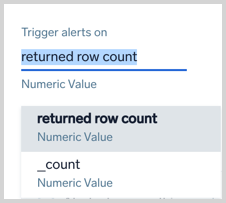
You can set the trigger based on the following:
- returned row count (default): the number of rows returned from the log search.
- A numeric field returned from the search. You can pick any numeric field from your query, and alert on the value of that field. The field is
_countin the above screenshot. To convert a string to a number use the num operator. For example, if you have a field named duration you would use the num operator as follows to convert it to a number value.
| num(duration)
Static detection method
Log Trigger Type: Critical and Warning
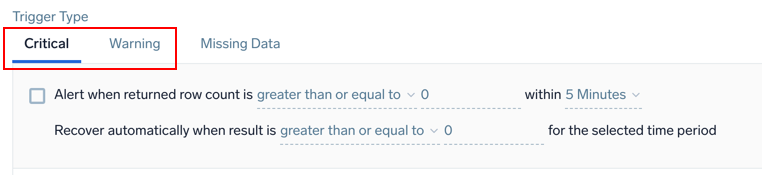
Alert when returned row count is <threshold type> <threshold> within <time range>
| Parameter | Description |
|---|---|
| Threshold type | How you want the value compared. Select either greater than, greater than or equal, less than or equal, or less than. |
| Threshold | The value against which the trigger will be evaluated. You can specify any valid numeric value up to 1,000. |
| Time range | The duration of time to evaluate. Select either 5 minutes, 10 minutes, 15 minutes, 30 minutes, 1 hour, 6 hours, 12 hours, or 24 hours. |
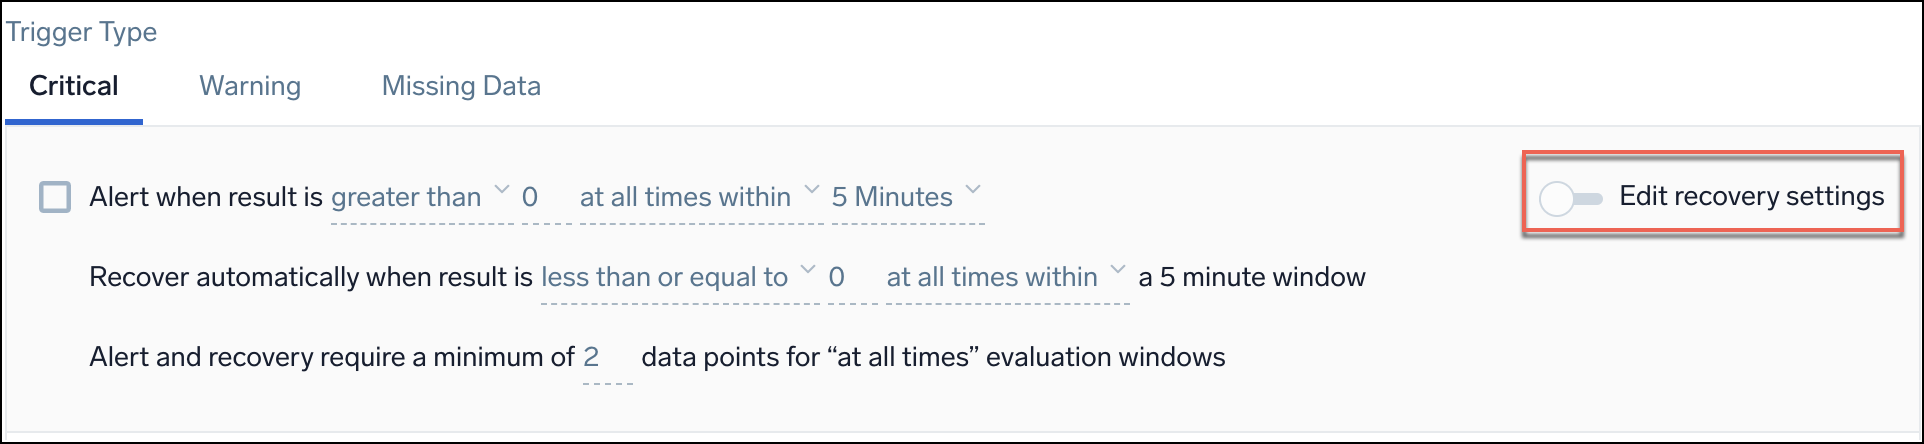
Recover
Recovery condition is set by default to the opposite of the alert condition. If you need to change these settings, first switch the Edit Recovery Settings toggle and then adjust values for the recovery settings accordingly.
For example, when the alert is set to > 10 the recovery would be set to <= 10 when inferred. Sumo Logic automatically resolves the incident when the resolution condition is satisfied. Recover automatically when result is <threshold type> <threshold> for the selected time period.
Configurable Resolution Window
When configuring monitor trigger conditions, you can set a resolution window to quickly resolve alerts when the underlying issues are fixed. This controls how long a monitor will wait prior to resolving the alert, when the underlying issues was corrected. For example, if your monitor is evaluating the last 60 minutes, you can specify a resolution window of 15 minutes. Once 15 minutes has elapsed with your monitor resolution window continuously satisfied, the alert will resolve. 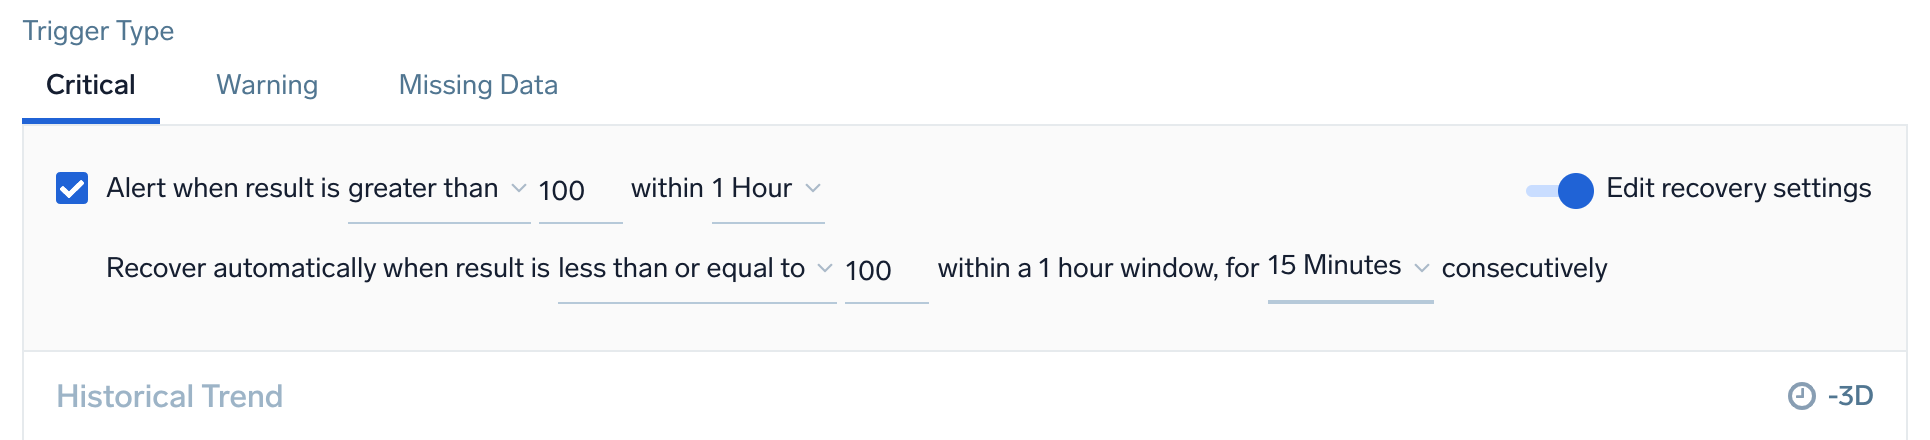
| Parameter | Description |
|---|---|
| Threshold type | How you want the value compared. Select either greater than, greater than or equal, less than or equal, or less than. |
| Threshold | The value against which the resolution will be evaluated. You can specify any valid numeric value. |
| Occurrence Type | The time condition you want for recovering the alert. Select either at any time within or at all times. Choose at all times if you want all the data points for the given metric to meet threshold conditions in a given time range, before recovering an alert. Alternatively, choose at any time within if you want to recover an alert when only a single data point meets the threshold condition for the given time range. |
For Metrics monitors, you can choose to recover based on a single data point below the threshold, or all data points below the threshold.
Outlier detection method
Logs Trigger Type: Critical and Warning
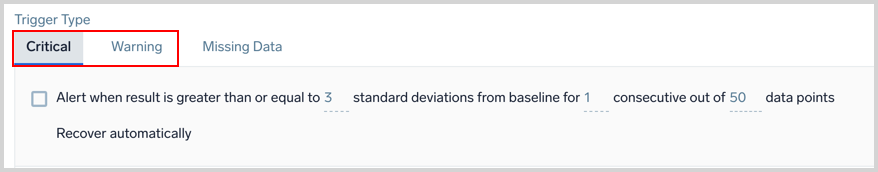
Alert when result is greater than or equal to <threshold> standard deviations from baseline for <consecutive> consecutive out of <window> data points
| Parameter | Description |
|---|---|
| Threshold | The number of standard deviations for calculating violations. The default is 3.0. |
| Consecutive | The required number of consecutive indicator data points (outliers) to trigger a violation. |
| Window | The number of data points used to calculate the baseline for outlier detection. |
Recover
The recovery condition will always be the opposite of the alerting condition. For example, if there is no outlier identified for the duration of the detection window from the time the alert was first fired, then the Monitor will be brought back to the normal state. You cannot customize the resolution condition for the Monitor.
Logs Trigger Type: Missing Data
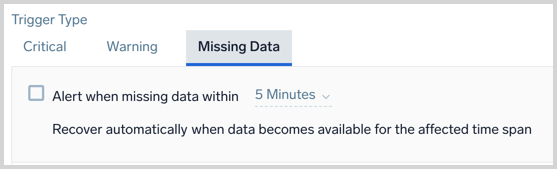
Alert when missing data within <time range>
| Parameter | Description |
|---|---|
| Time range | The time span of data to evaluate. Select either 5 minutes, 10 minutes, 15 minutes, 30 minutes, 1 hour, 6 hours, 12 hours, or 24 hours. |
Recover
Automatically: Sumo Logic automatically resolves the incident when the resolution condition is satisfied.
Recover automatically when data becomes available for the affected time span.
Metrics Trigger Types (expand to view)
Metrics Trigger Types
Static detection method
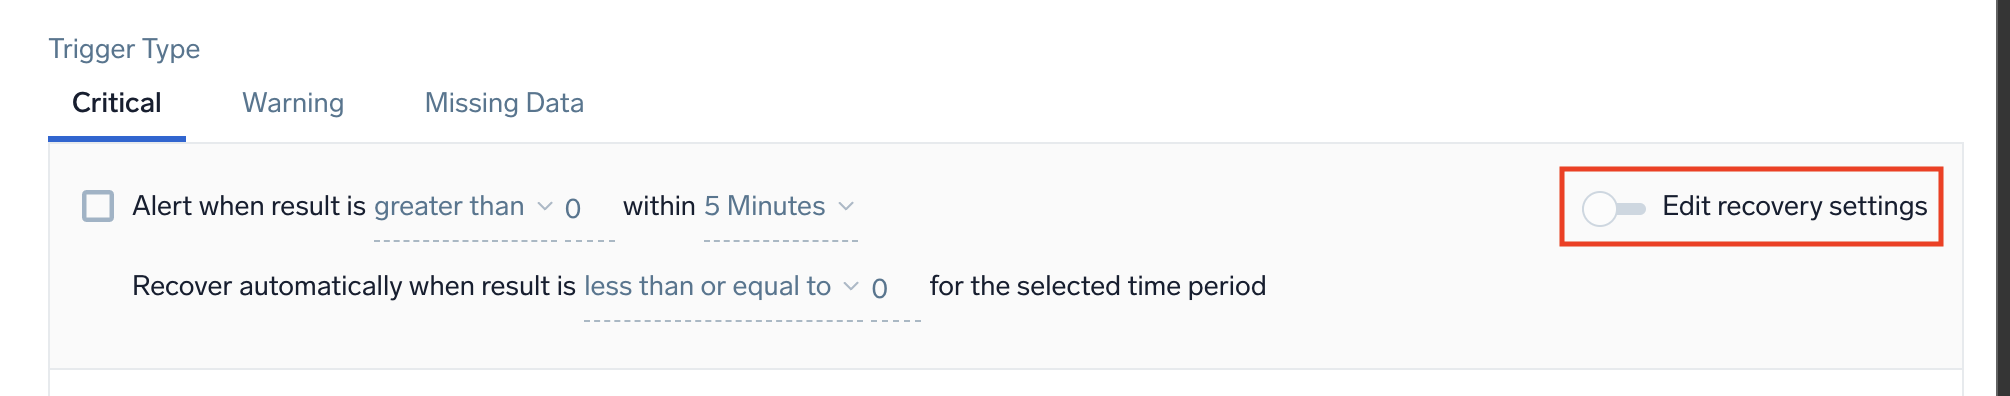
Metrics Trigger Type: Critical and Warning
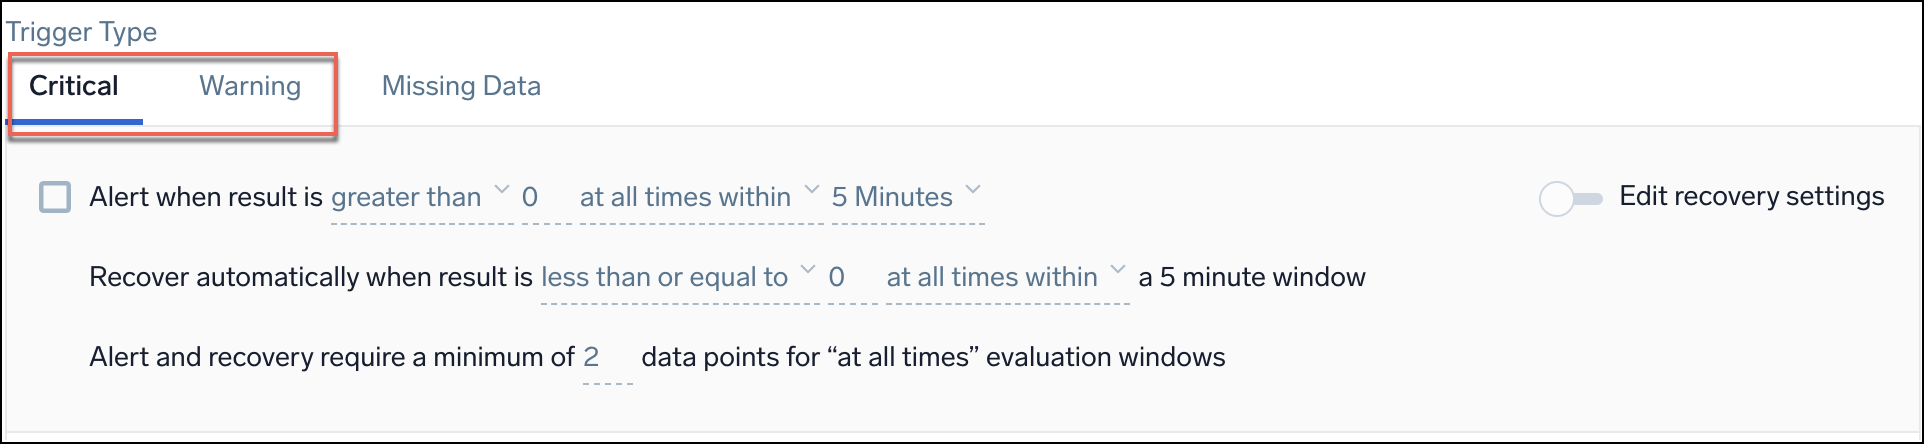
Alert when result is <threshold type> <threshold> <occurrence type> <time range>
| Parameter | Description |
|---|---|
| Threshold type | How you want the value compared. Select either greater than, greater than or equal, less than or equal, or less than. |
| Threshold | The value against which the trigger will be evaluated. You can specify any valid numeric value. |
| Occurrence type | The time condition you want for the trigger. Select either at any time within or continuously for. Choose continuously for if you want all the data points for the given metric to meet threshold conditions in a given time range, before triggering an alert. Alternatively, choose at any time within if you want to generate an alert when only a single data point meets the threshold condition for the given time range. |
| Time range | The duration of time to evaluate. Select either 5 minutes, 10 minutes, 15 minutes, 30 minutes, or 1 hour. |
Recover
Recovery condition is set by default to the opposite of the alert condition. If you need to change these settings, first switch the Edit Recovery Settings toggle and then adjust values for the recovery settings accordingly.
For example, when the alert is set to > 10 the recovery would be set to <= 10 when inferred.
Sumo Logic automatically resolves the incident when the resolution condition is satisfied.
Recover automatically when result is <threshold type> <threshold> for the selected time period
| Parameter | Description |
|---|---|
| Threshold type | How you want the value compared. Select either greater than, greater than or equal, less than or equal, or less than. |
| Threshold | The value against which the resolution will be evaluated. You can specify any valid numeric value. |
Alert and recovery window
This setting affects both the alert generation logic and the alert recovery logic.
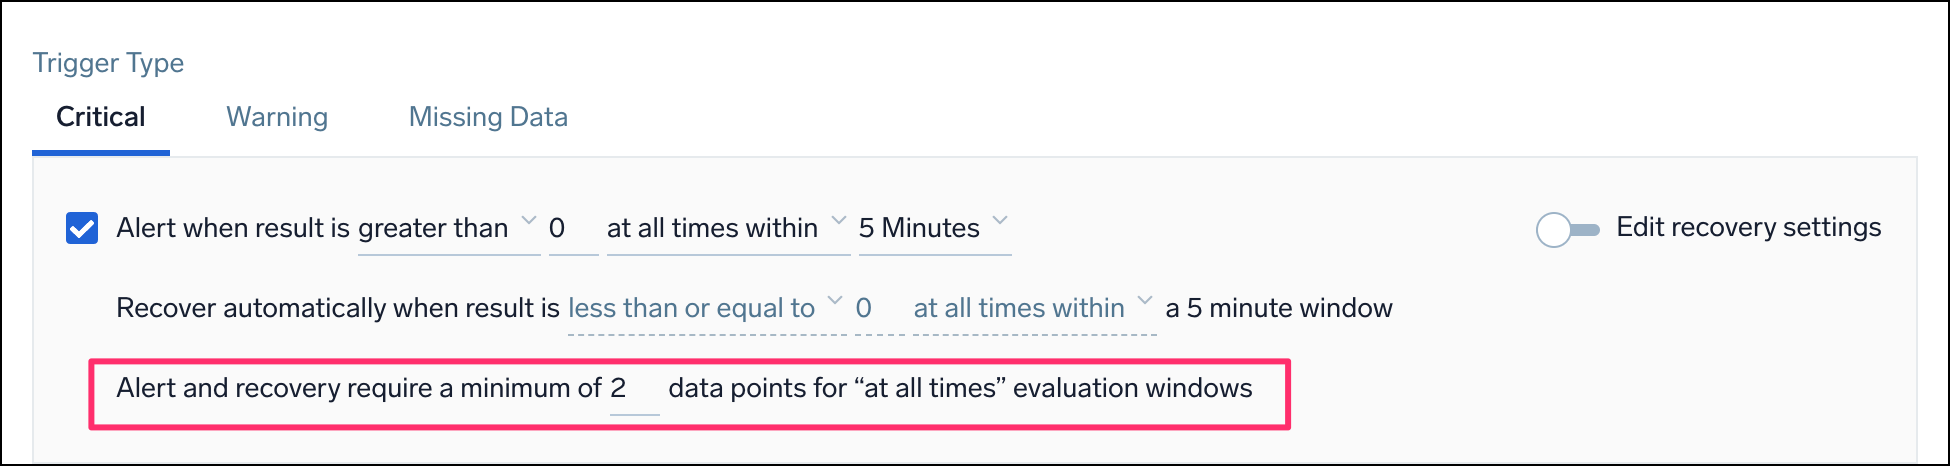
Alert and recovery require a minimum of <Count> data points for "at all times" evaluation windows
| Parameter | Description |
|---|---|
| Count | The minimum number of data points required within the configured window to trigger an alert or recover from an alert. This means that if Sumo Logic receives fewer data points in a given window, no alert will be triggered (even if all those data points exceed the threshold). |
For example, you want to be alerted when the CPU usage is over 60% at all times within a 5-minute window. If you set the count to 3, this means that you will only get an alert if you have at least 3 data points showing CPU usage above 60% within that 5-minute window. If you only have 2 data points, even if both of them show CPU usage above 60%, you won't get an alert.
This setting only works when you choose at all times within as the type of occurrence for the alert.
Outlier detection method
Metrics Trigger Type: Critical and Warning
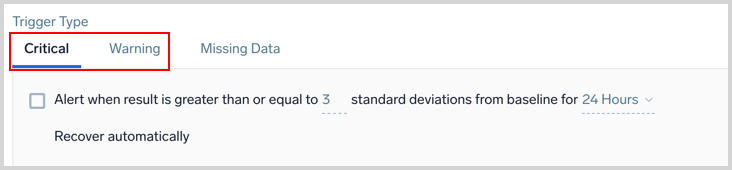
Alert when result is greater than or equal to <threshold> standard deviations from baseline for <time range>
| Parameter | Description |
|---|---|
| Threshold | The number of standard deviations for calculating violations. The default is 3.0. |
| Time range | The duration of time to evaluate. Select either 5 minutes, 10 minutes, 15 minutes, 30 minutes, 1 hour, or 24 hours. |
Recover
The recovery condition will always be the opposite of the alerting condition. For example, if there is no outlier identified for the duration of the detection window from the time the alert was first fired, then the Monitor will be brought back to the normal state. You cannot customize the resolution condition for the Monitor.
Metrics Trigger Type: Missing Data
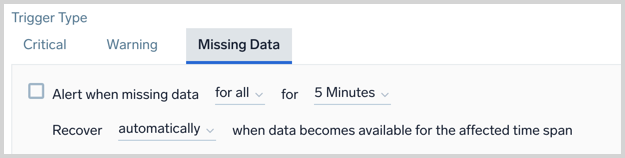
Alert when missing data <occurrence type> for <time range>
| Parameter | Description |
|---|---|
| Occurrence type | The time condition you want for the trigger. Choose either for all or for any. If you choose all you will get notified when all of the metrics meeting the query condition are not sending data in the given time range. Alternatively, you can choose any if you want to get notified when one of the metrics does not receive any data in the given time range. This option requires at least one initial data point and expires after 24 hours once triggered. |
| Time range | The duration of time to evaluate. Select either 5 minutes, 10 minutes, 15 minutes, 30 minutes, or 1 hour. |
Recover
Automatically: Sumo Logic automatically resolves the incident when the resolution condition is satisfied.
Recover automatically when data becomes available for the affected time span.
Step 5: Additional Settings (optional)
Alert Name
Alert Name allows you to customize the name that appears on the Alert Page. By default, the Alert name is the monitor name, but you may want to create a custom name based on your use case. You can include any of the available alert variables, except {{AlertName}}, Playbook, {{AlertResponseURL}}, and {{ResultsJson}}, in the name such as the type of monitor or trigger condition. You can check the alert variables list for details.
- Example:
{{Resultsjson.Env}}- High CPU. This alert will produce an Alert with the name like PROD - High CPU. Here we are assuming that there is a field name Env in underlying data that has a value of "PROD".
Evaluation Delay
Collection delays may occur due to your environment and it takes a couple of minutes for data to be processed into Sumo Logic. Since Monitors run on data from the most current time period, it's possible for Monitors to evaluate against incomplete data. As a result, Monitors can generate false positives or negatives that can cause confusion. Set an evaluation delay in seconds to delay the evaluation of a Monitor, so it doesn't look at the most current time (where data can be incomplete) and instead looks at an older period of time, where you have more complete data.
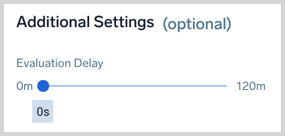
If your data is coming from the Amazon CloudWatch Source for Metrics we recommend a setting of 900 seconds.
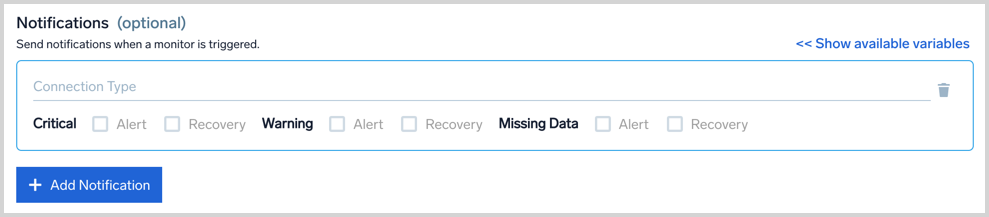
Set Notifications
When a trigger condition is met you can send notifications to other people and services. To add notifications click on the Add Notification button. You can add more than one notification channel for a Monitor.
Metric Monitors have an option to send notifications either as a group or separately. Group Notifications define whether you want single notifications per time series that match the Monitor query or you want group notifications where you receive a single notification for the entire Monitor. Log Monitors always group notifications.
The Connection Type specifies the notification channel where you want to get notified, such as an email or webhook. See Connections for details. Monitor notifications support variables to reference its configuration settings or your raw data. See alert variables for a table of the available variables.
- Email: Provide 1-100 recipient email addresses. You can customize the email subject and body.
- Webhook: By default, the payload defined on the Connection is used. You can customize your payload for each notification if needed.
- Select the Alert and Recovery checkboxes for each trigger type based on when you want to send a notification. You can have different Trigger Conditions send a notification to different channels. For example, you can get notified on PagerDuty for critical Incidents and get an email or Slack notification for warning incidents.If your connection type is Lambda, Microsoft Teams, OpsGenie, PagerDuty, Slack, or a generic webhook, the Recovery checkbox enables an automatic resolution process that updates the connection when an alert has recovered within Sumo Logic. Support for other connection types is coming soon.tip
See the Notifications section for details on alert and recovery notifications.
- Add Notifications to add additional notification channels as needed. You can configure different notifications for each trigger type, critical, warning, and missing data.
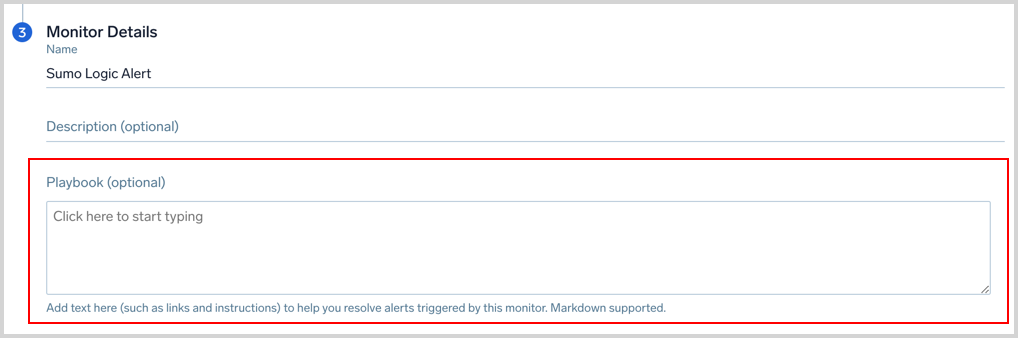
Add Playbook
Playbooks allow admins to codify tribal knowledge for an on-call so they know what exactly to do when they receive an alert. You have the option to provide a playbook when creating a Monitor, as shown in the below image. Markdown is supported.
Step 6: Name and save your monitor
- Enter a Name for the Monitor and the Location you want it saved to. A Description is optional.
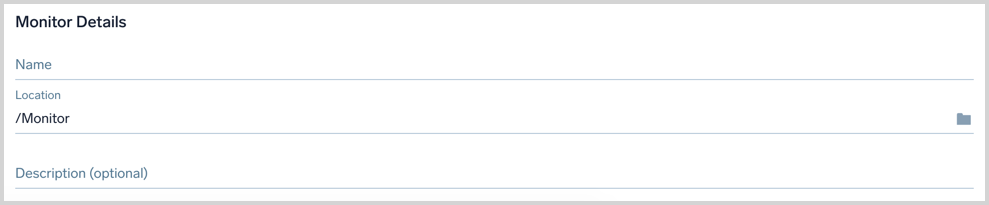
- Click the Save button at the top right of the panel when you're finished configuring the Monitor.
Other Configurations
Using Terraform
- You can configure Sumo Logic Monitors using Terraform modules.