Real User Monitoring Dashboards
RUM App
Once Sumo Logic detects data coming from user browsers, the RUM app will be installed automatically for all users of your organization. No action is required.
The data will populate in your organization's Sumo Logic RUM - default dashboards, located inside of your Admin Recommended folder. Do not modify or delete content in this folder, as it's maintained and updated automatically.
If your RUM app is removed accidentally, here's how to install it manually (click to expand).
- Go to the App Catalog, then search for and select the Real User Monitoring app.
- Click Add to Library.
- Provide an App Name. You can retain the existing name or enter a name of your choice for the app.
- Advanced. Select the Location in Library (the default is the Personal folder in the library), or click New Folder to add a new folder.
- Click Add to Library.
- Once the app is installed, it will appear in your Personal folder or the folder you specified. From here, you can share it with your organization.
Using Explore View
Once the RUM app has been installed, use our Explore view to gain visibility into your web app's performance and end-user activity, such as geographic location, browser type, operating systems used. These dashboards visualize RUM metrics gathered from browser tracing instrumentation.
- Go to +New > Explore.
- Under Explore By, click Real User Monitoring.
- Select your desired dashboard from Dashboard dropdown menu in the header:

There are three dashboard types on the Application, Service, and Environment levels, and a single one on the Action type and Action levels. - Set your desired filters. Explore organizes RUM data on five levels:
- Application: corresponds to the value of the application tag set in your RUM script. This should correspond to your whole website defined by its business function, such as
the-coffee-bar-app. - Service: corresponds to the name of the service in your RUM script. The value should correspond to the JavaScript code executed in your browser, such as
coffee-bar-frontend. You can have multiple services for each application. - deployment.environment: corresponds to your development environment. To enable this, add the
deployment.environmenttag and desired value (likeus-west-1,prod,dev) to your RUM script. - Action Type: can be one of:
- document loads: representing loading of actual documents and their resources into the browser
- XHR actions: representing any interaction with a page like click or submit that executes AJAX requests in the background to communicate with the backend, or
- route changes: single-page-app specific way to navigate to a new page/view without having to load a new document.
- Action Name: automatically generated from URLs. No configuration is required. The specifics of it will depend on action type. Action names can contain asterisks (
*) to replace automatically-detected dynamic parts of the URL. If you have action names that overlap, the action name with an asterisk contains data for page loads NOT contained in more specific action names. For example,http://www.site.com/path/page.htmdoes not contain actions fromhttp://www.site.com/path/*.
- Application: corresponds to the value of the application tag set in your RUM script. This should correspond to your whole website defined by its business function, such as
Example: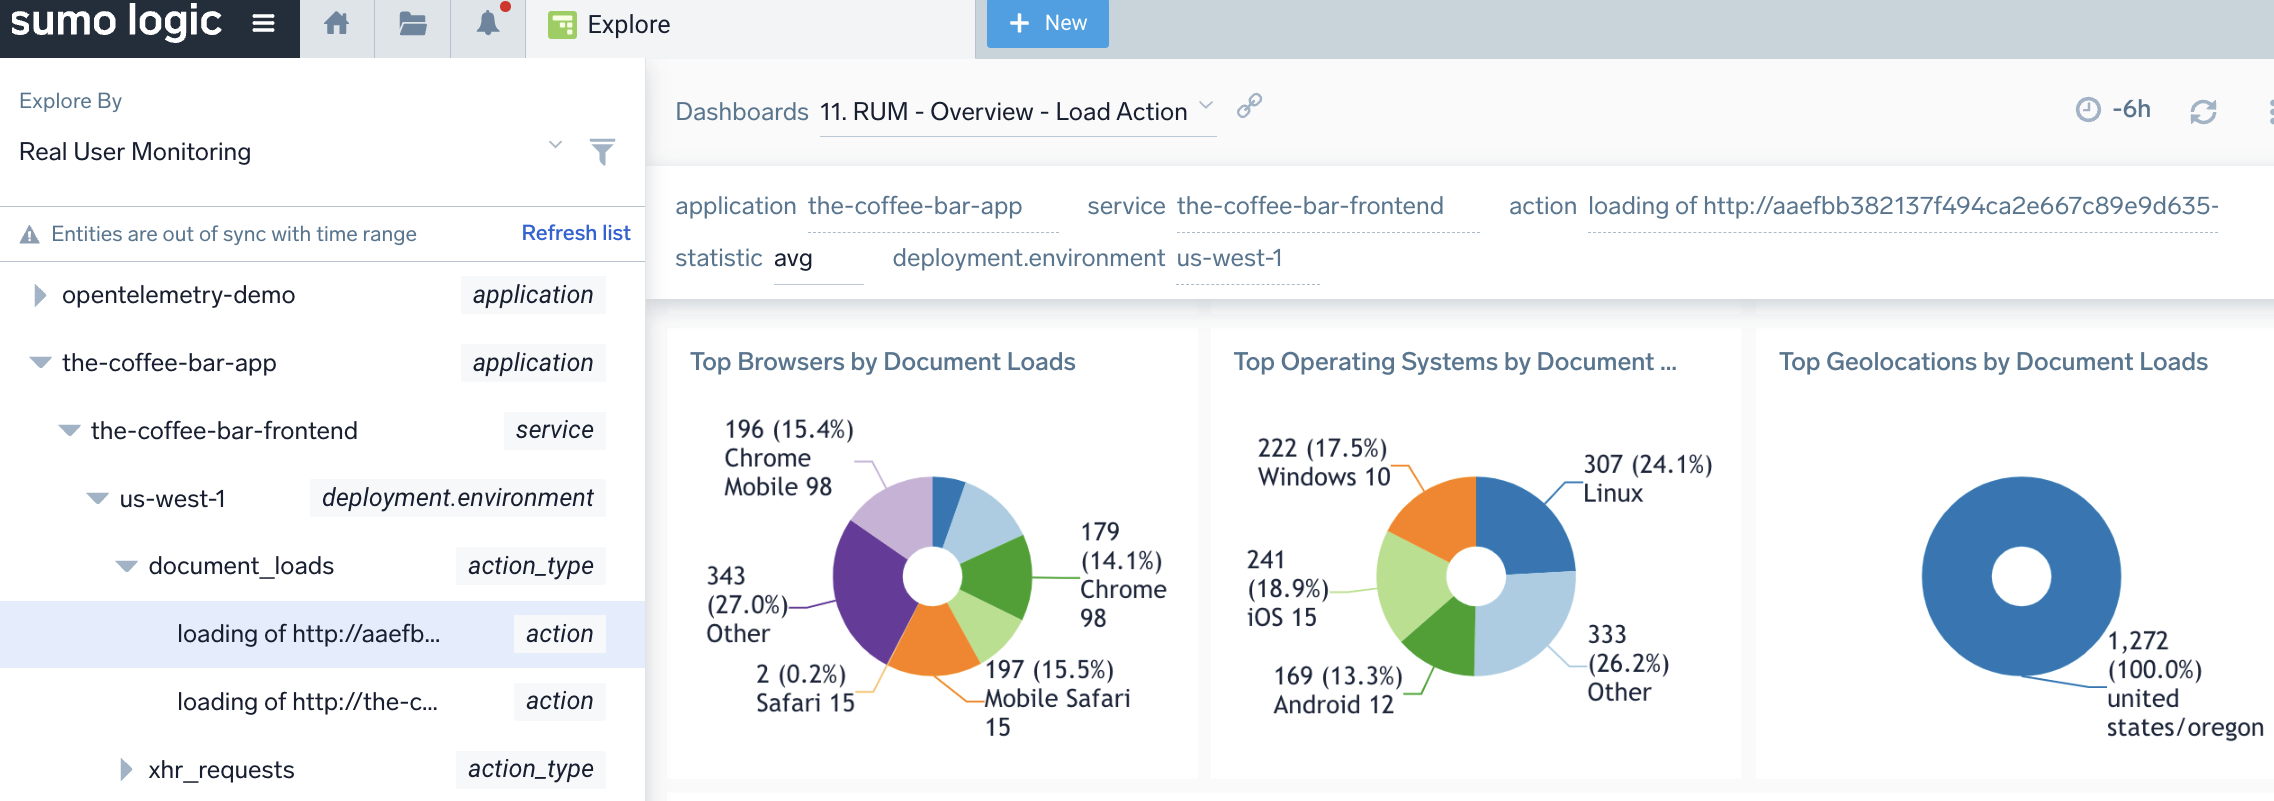
Navigating RUM Dashboards
RUM Overview Dashboards
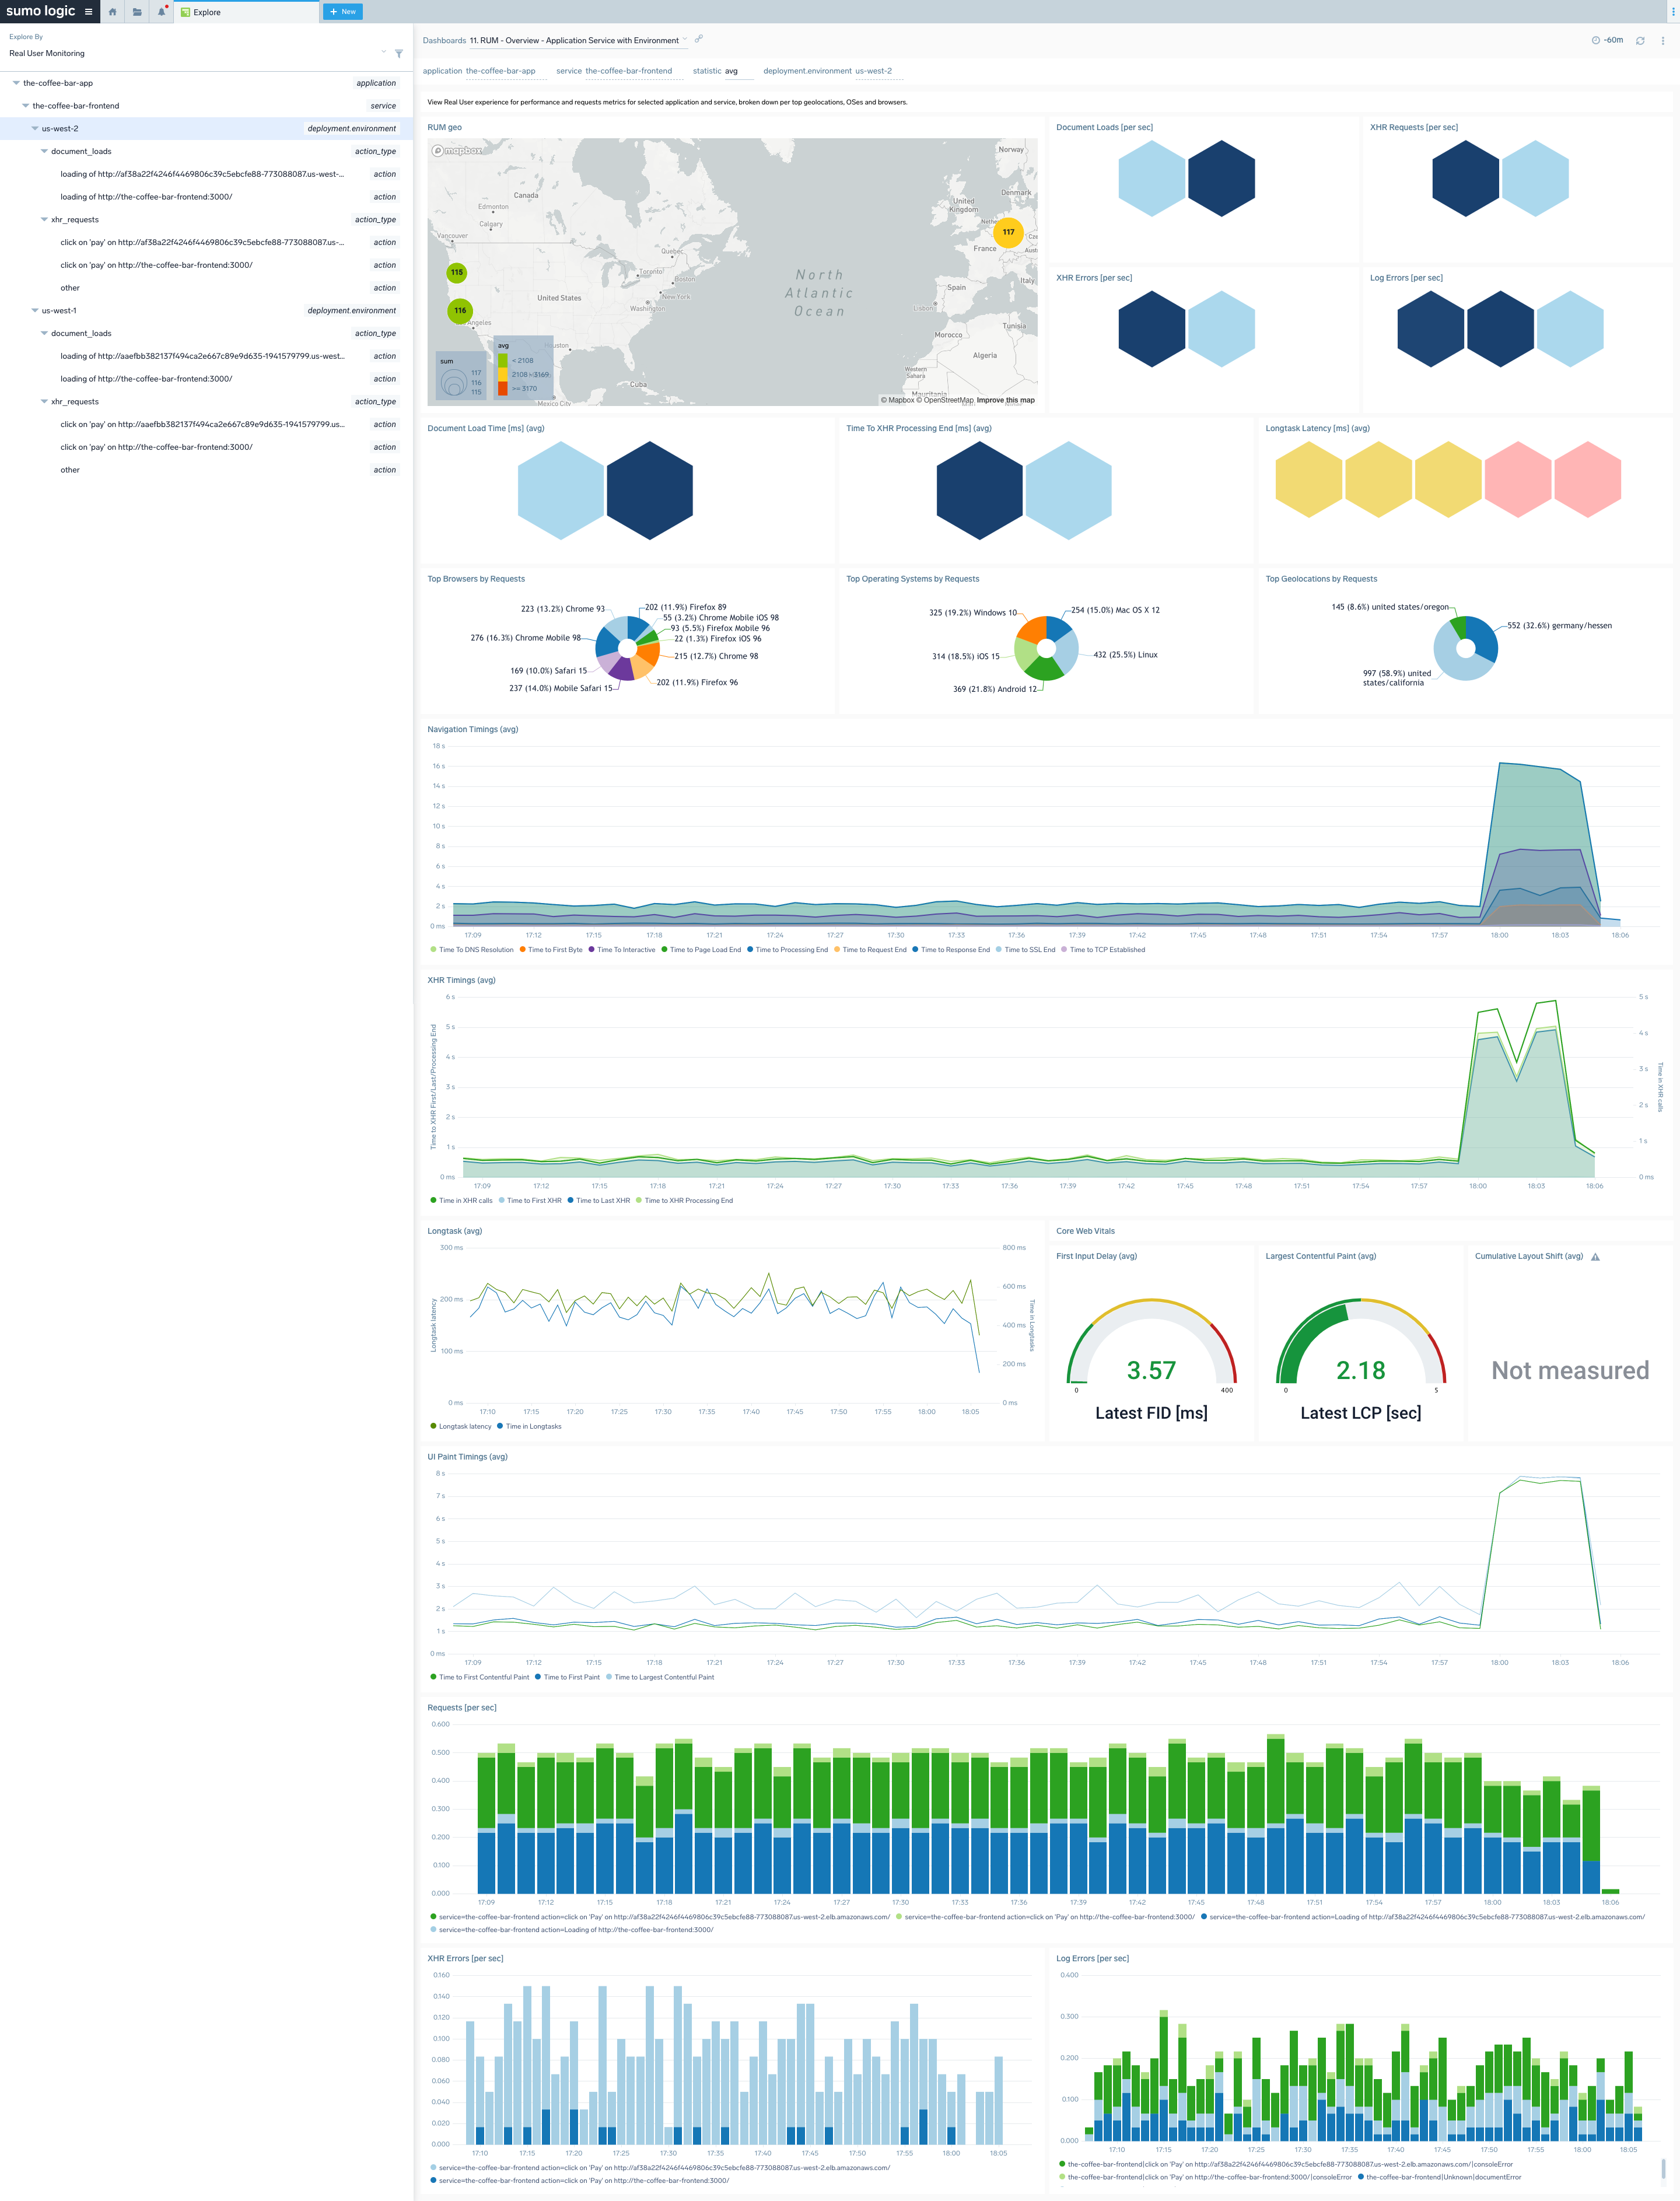
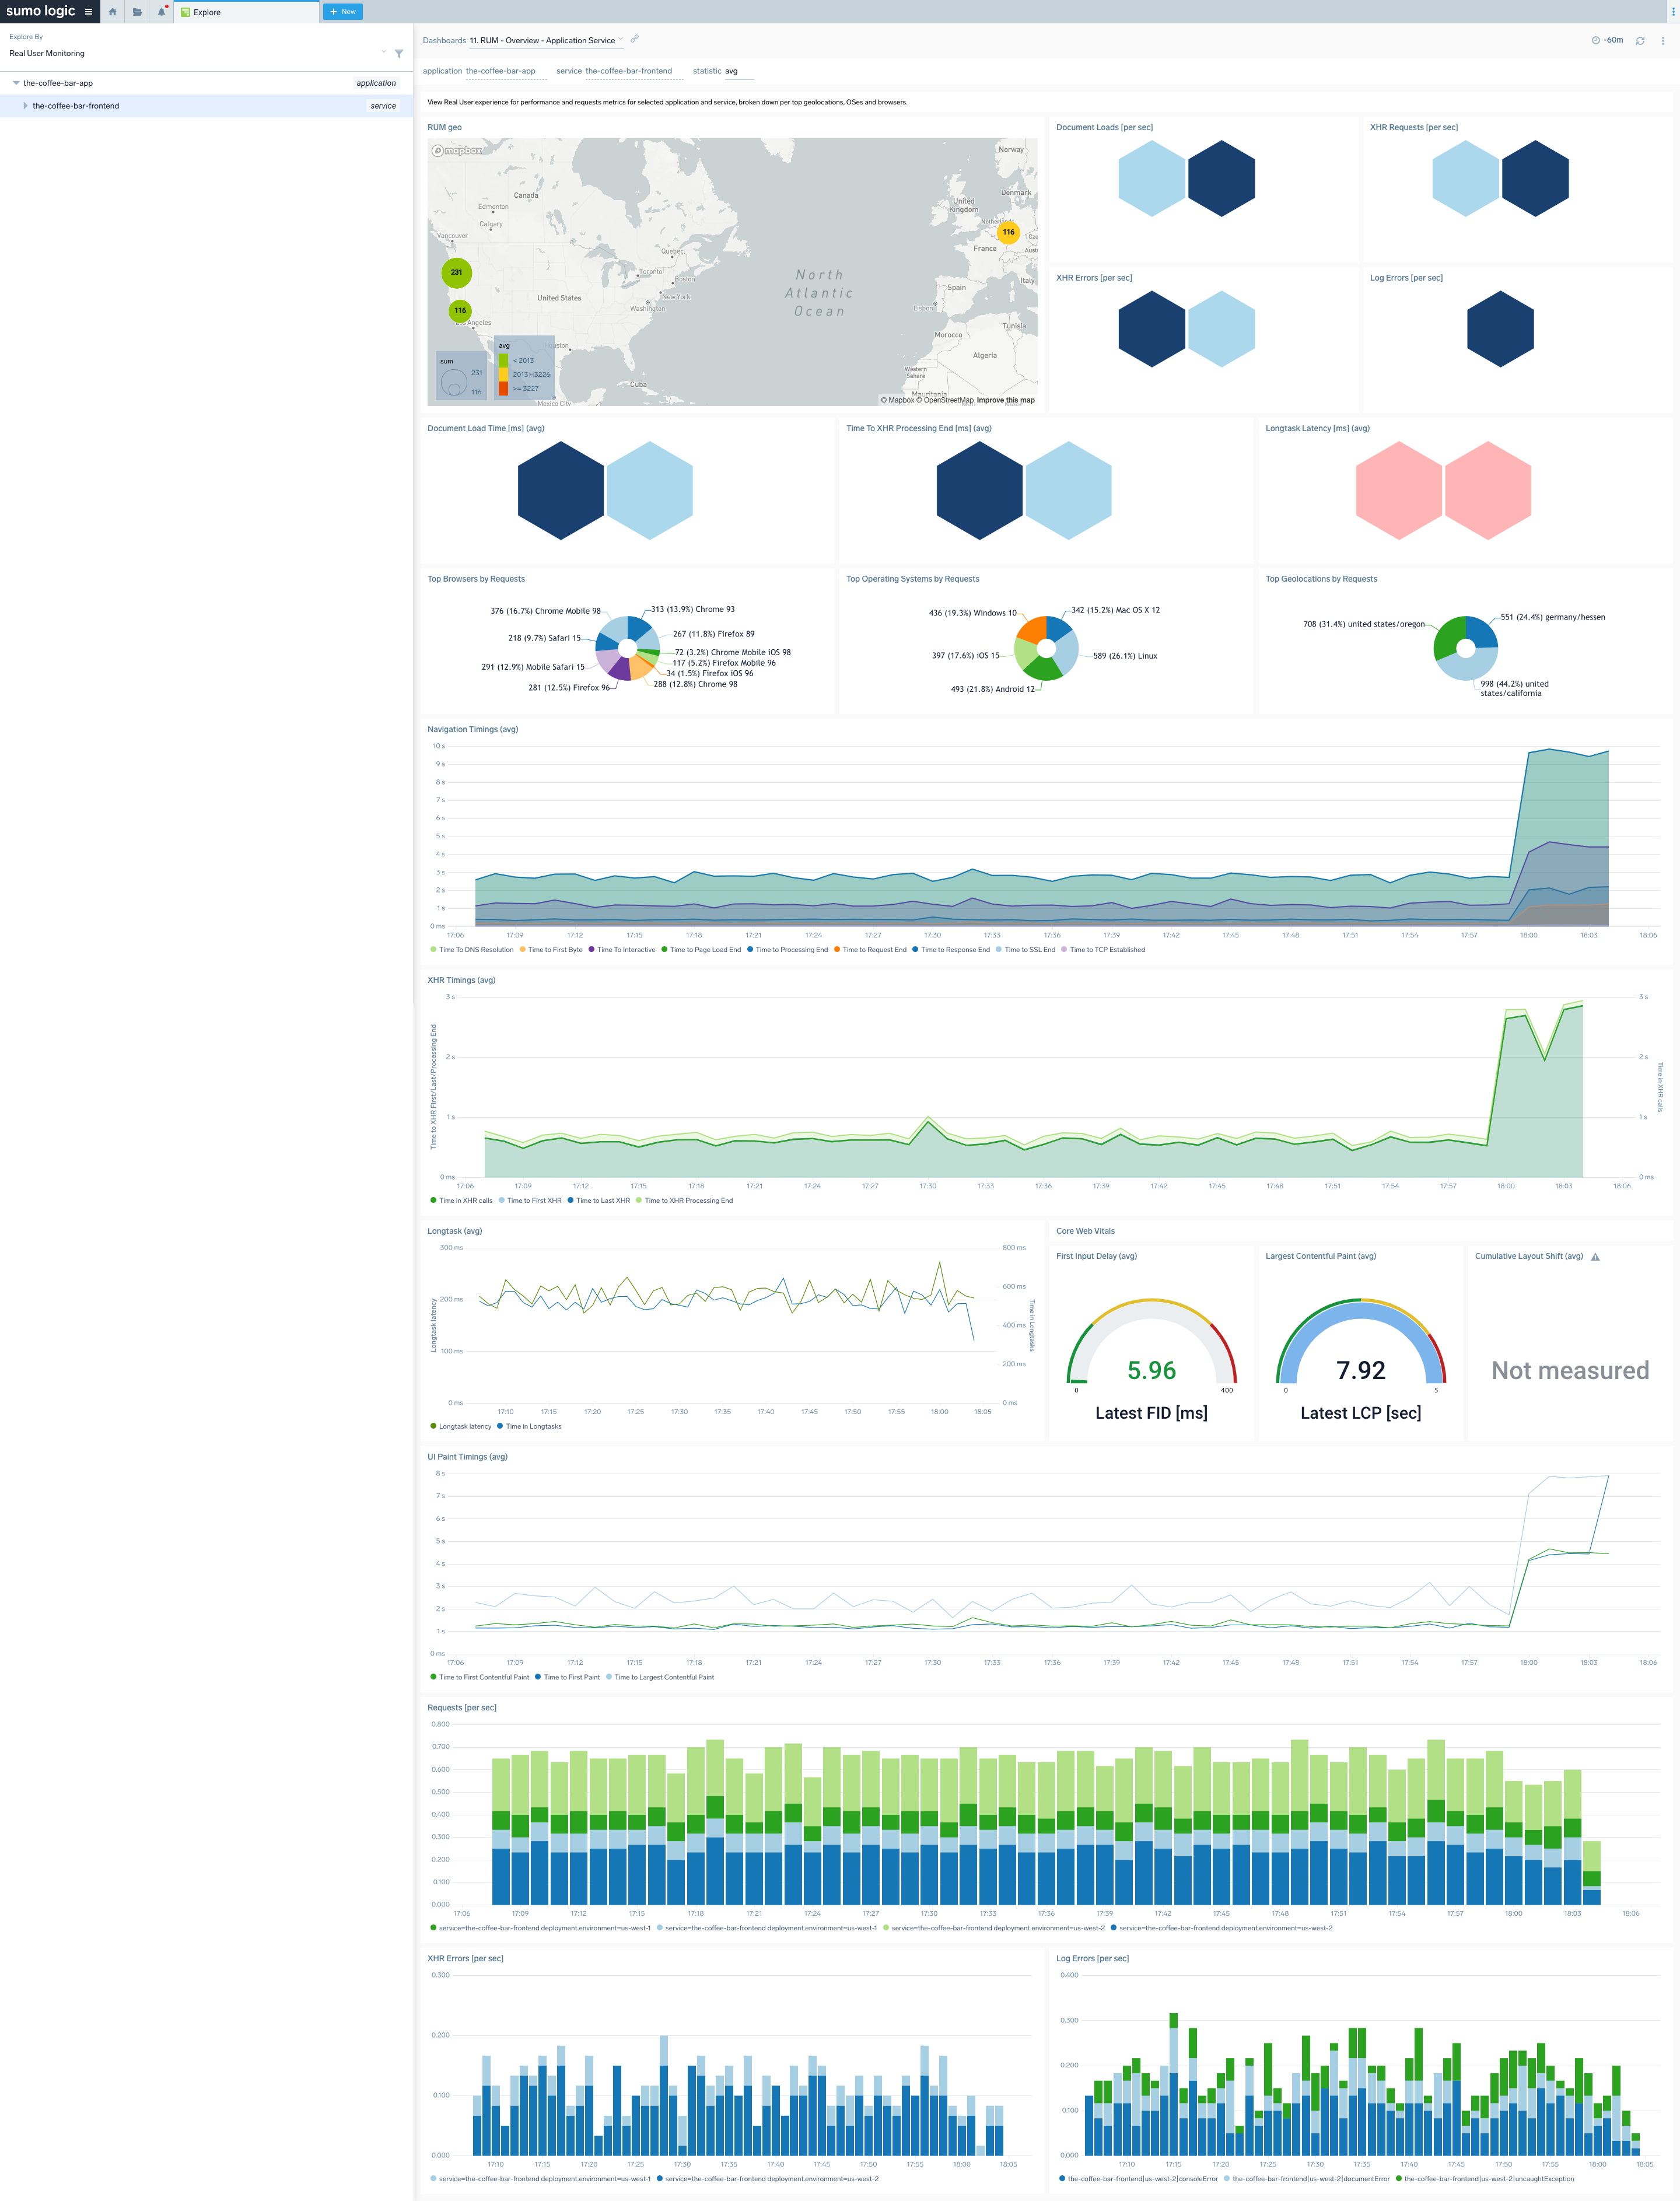
The RUM Overview dashboards (Application, Service, Service with Environment, Action Type, and Action) show the user experience for performance and requests metrics for your selected application, service, environment, and action. Data is broken down by top geo-locations, operating systems, and browsers.
Use these dashboards to:
- Analyze load and paint timings for page document loads by application, service, or action.
- View information about core web vitals, XHR processing times/errors, and log errors.
- Understand what top browsers, operating systems, and geolocations are active with your website.
You can select the timing metric type in the statistic dropdown on the dashboard header. This will change the browser time metrics types on charts.
You can also click on any data-point on the charts to open a details panel and view the Infrastructure tab to drill down to traces representing user transactions from the selected time point.
Overview dashboards on all Explore levels have a panel showing geographical user activity for the selected entity. Geographic dashboards measure user activity as dot size and performance as a color.
RUM TopN Application/Service
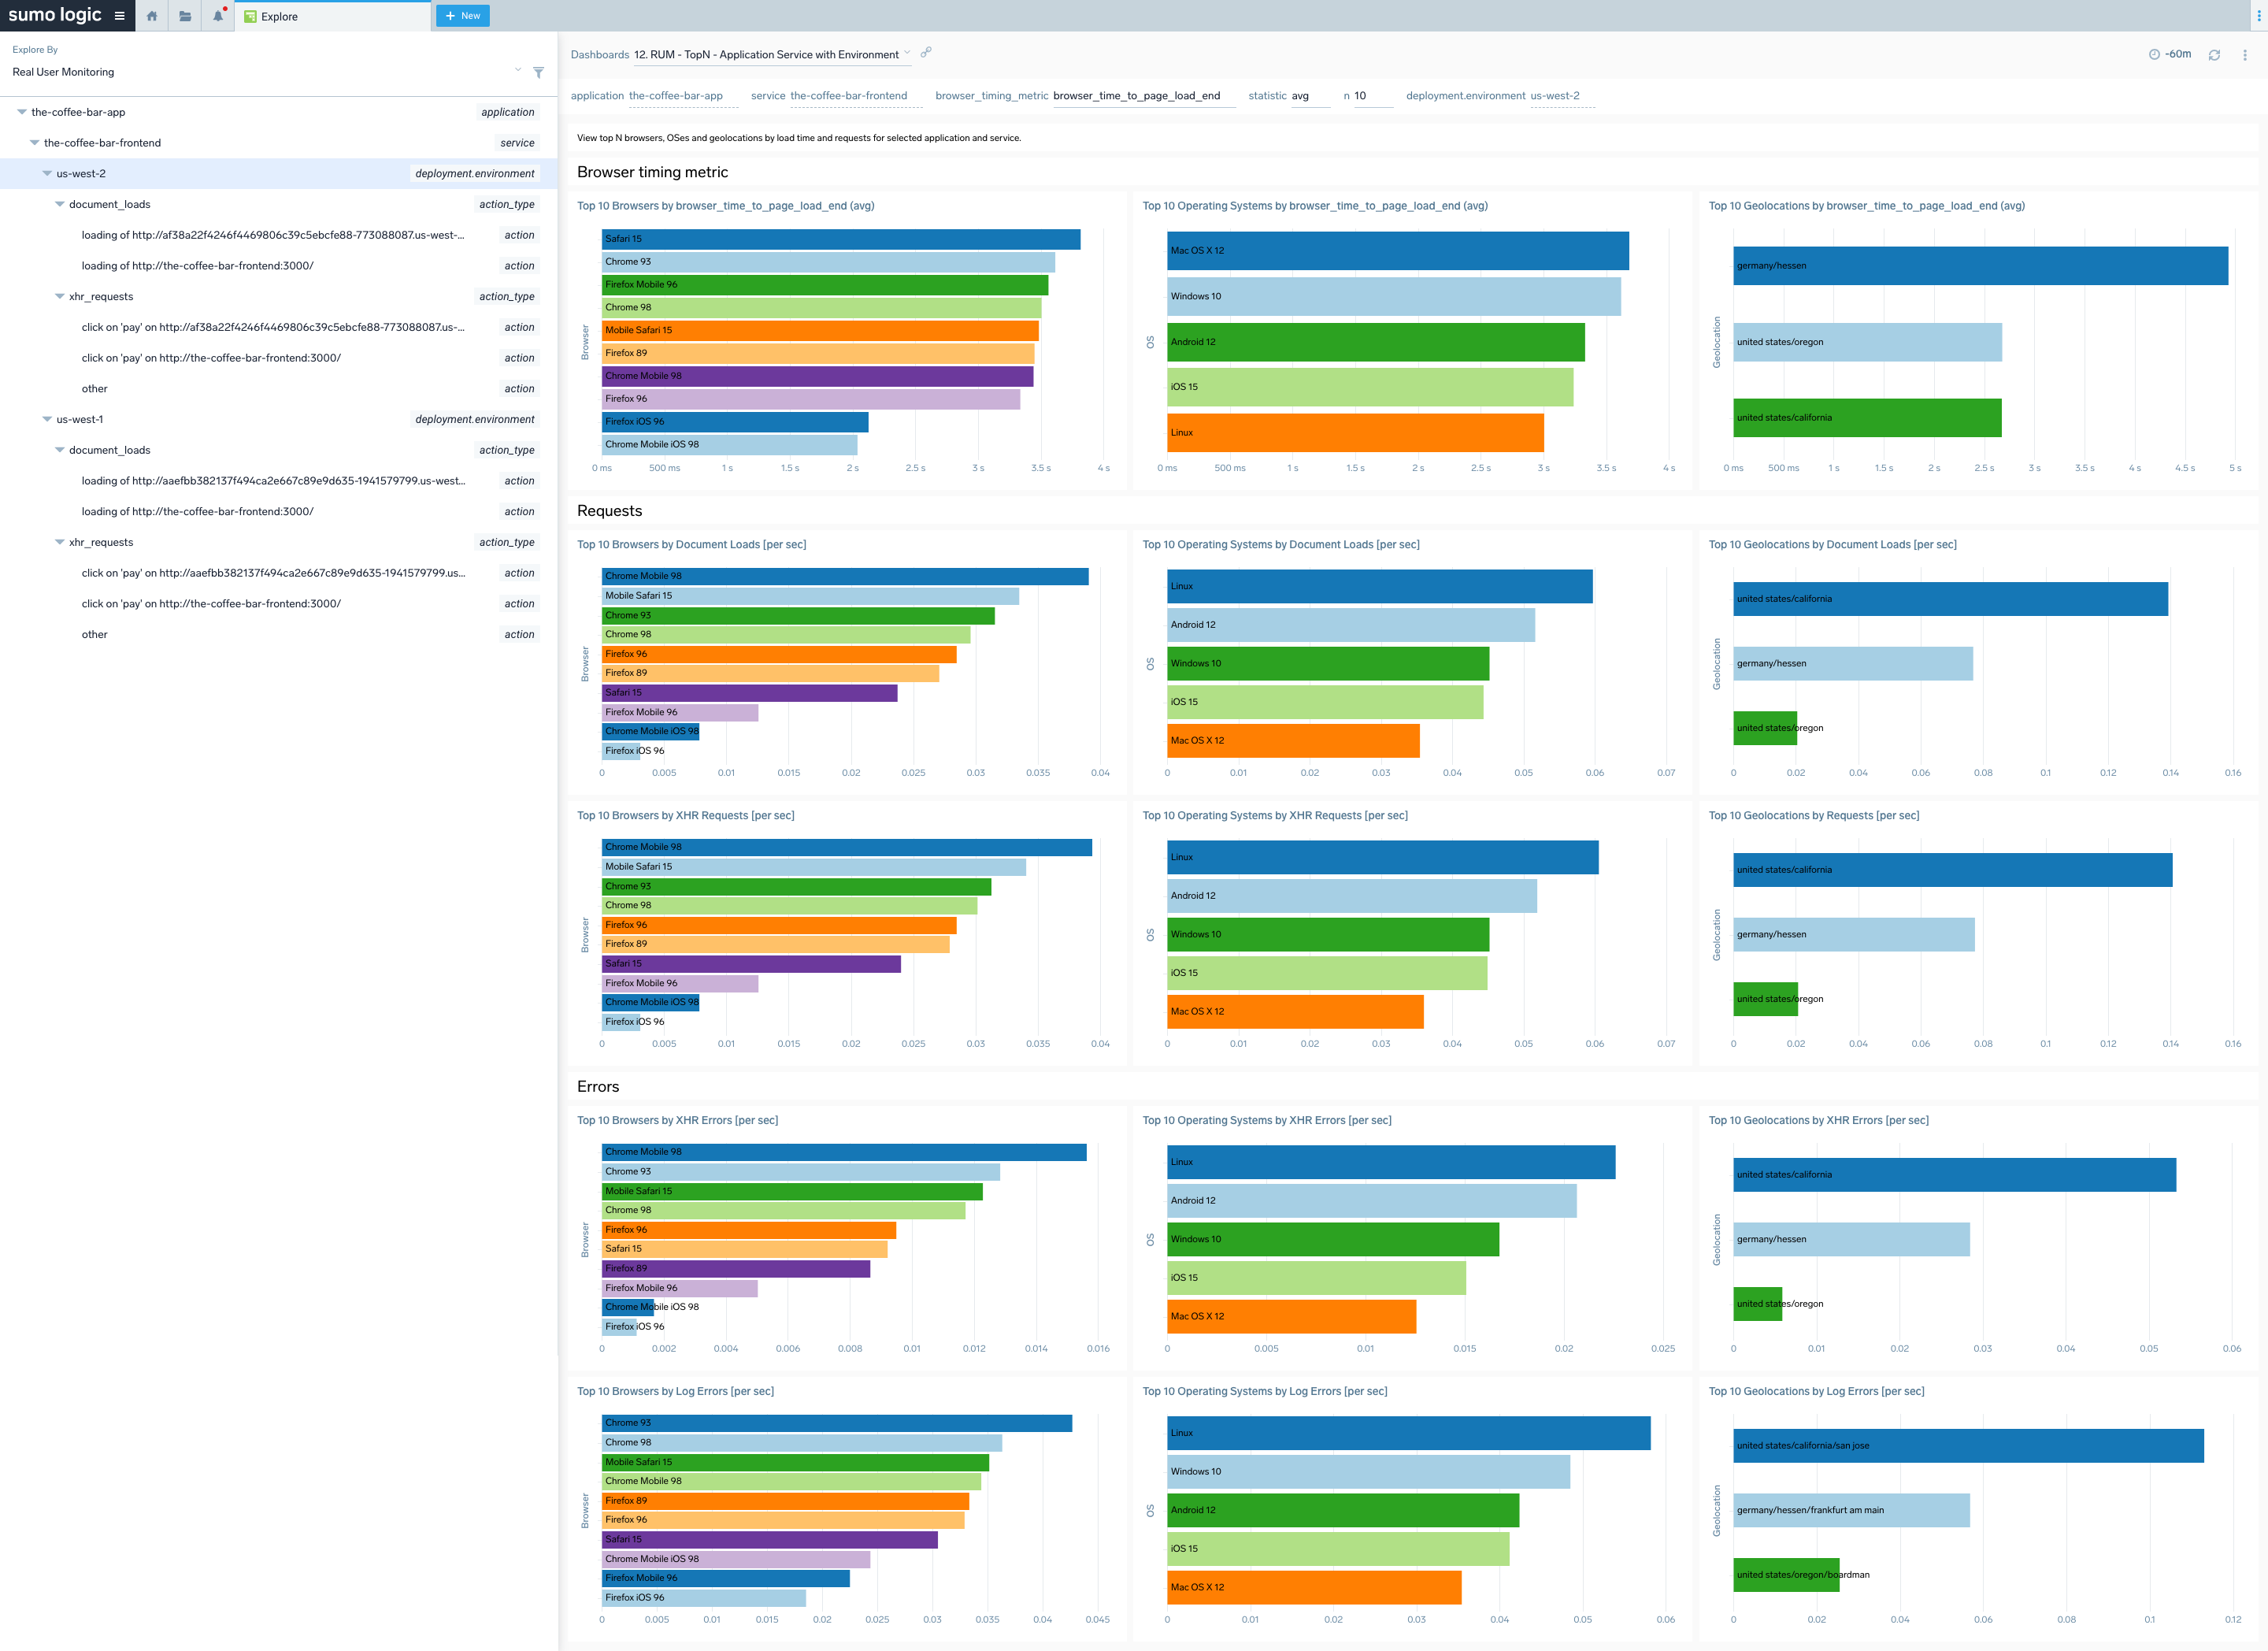
The RUM - TopN - Application and RUM - TopN - Application Service dashboards show top N browsers, operating systems, and geographical locations by load time and requests for the selected application, service, or environment.
Use these dashboards to:
- Find out top N browsers, operating systems, and geolocations by load or requests.
- Understand the slowest and fastest browsers from a rendering perspective or geographical locations from a network perspective.
- Understand XHR and log errors your users are experiencing.
- Find out which browsers and operating systems are in use by your users and where are they are geographically located.
You can select the timing metric type in the statistic dropdown on the dashboard header. This will change the browser time metrics types on charts. You can also define the top N number for all charts.
RUM Performance Analytics Application/Service
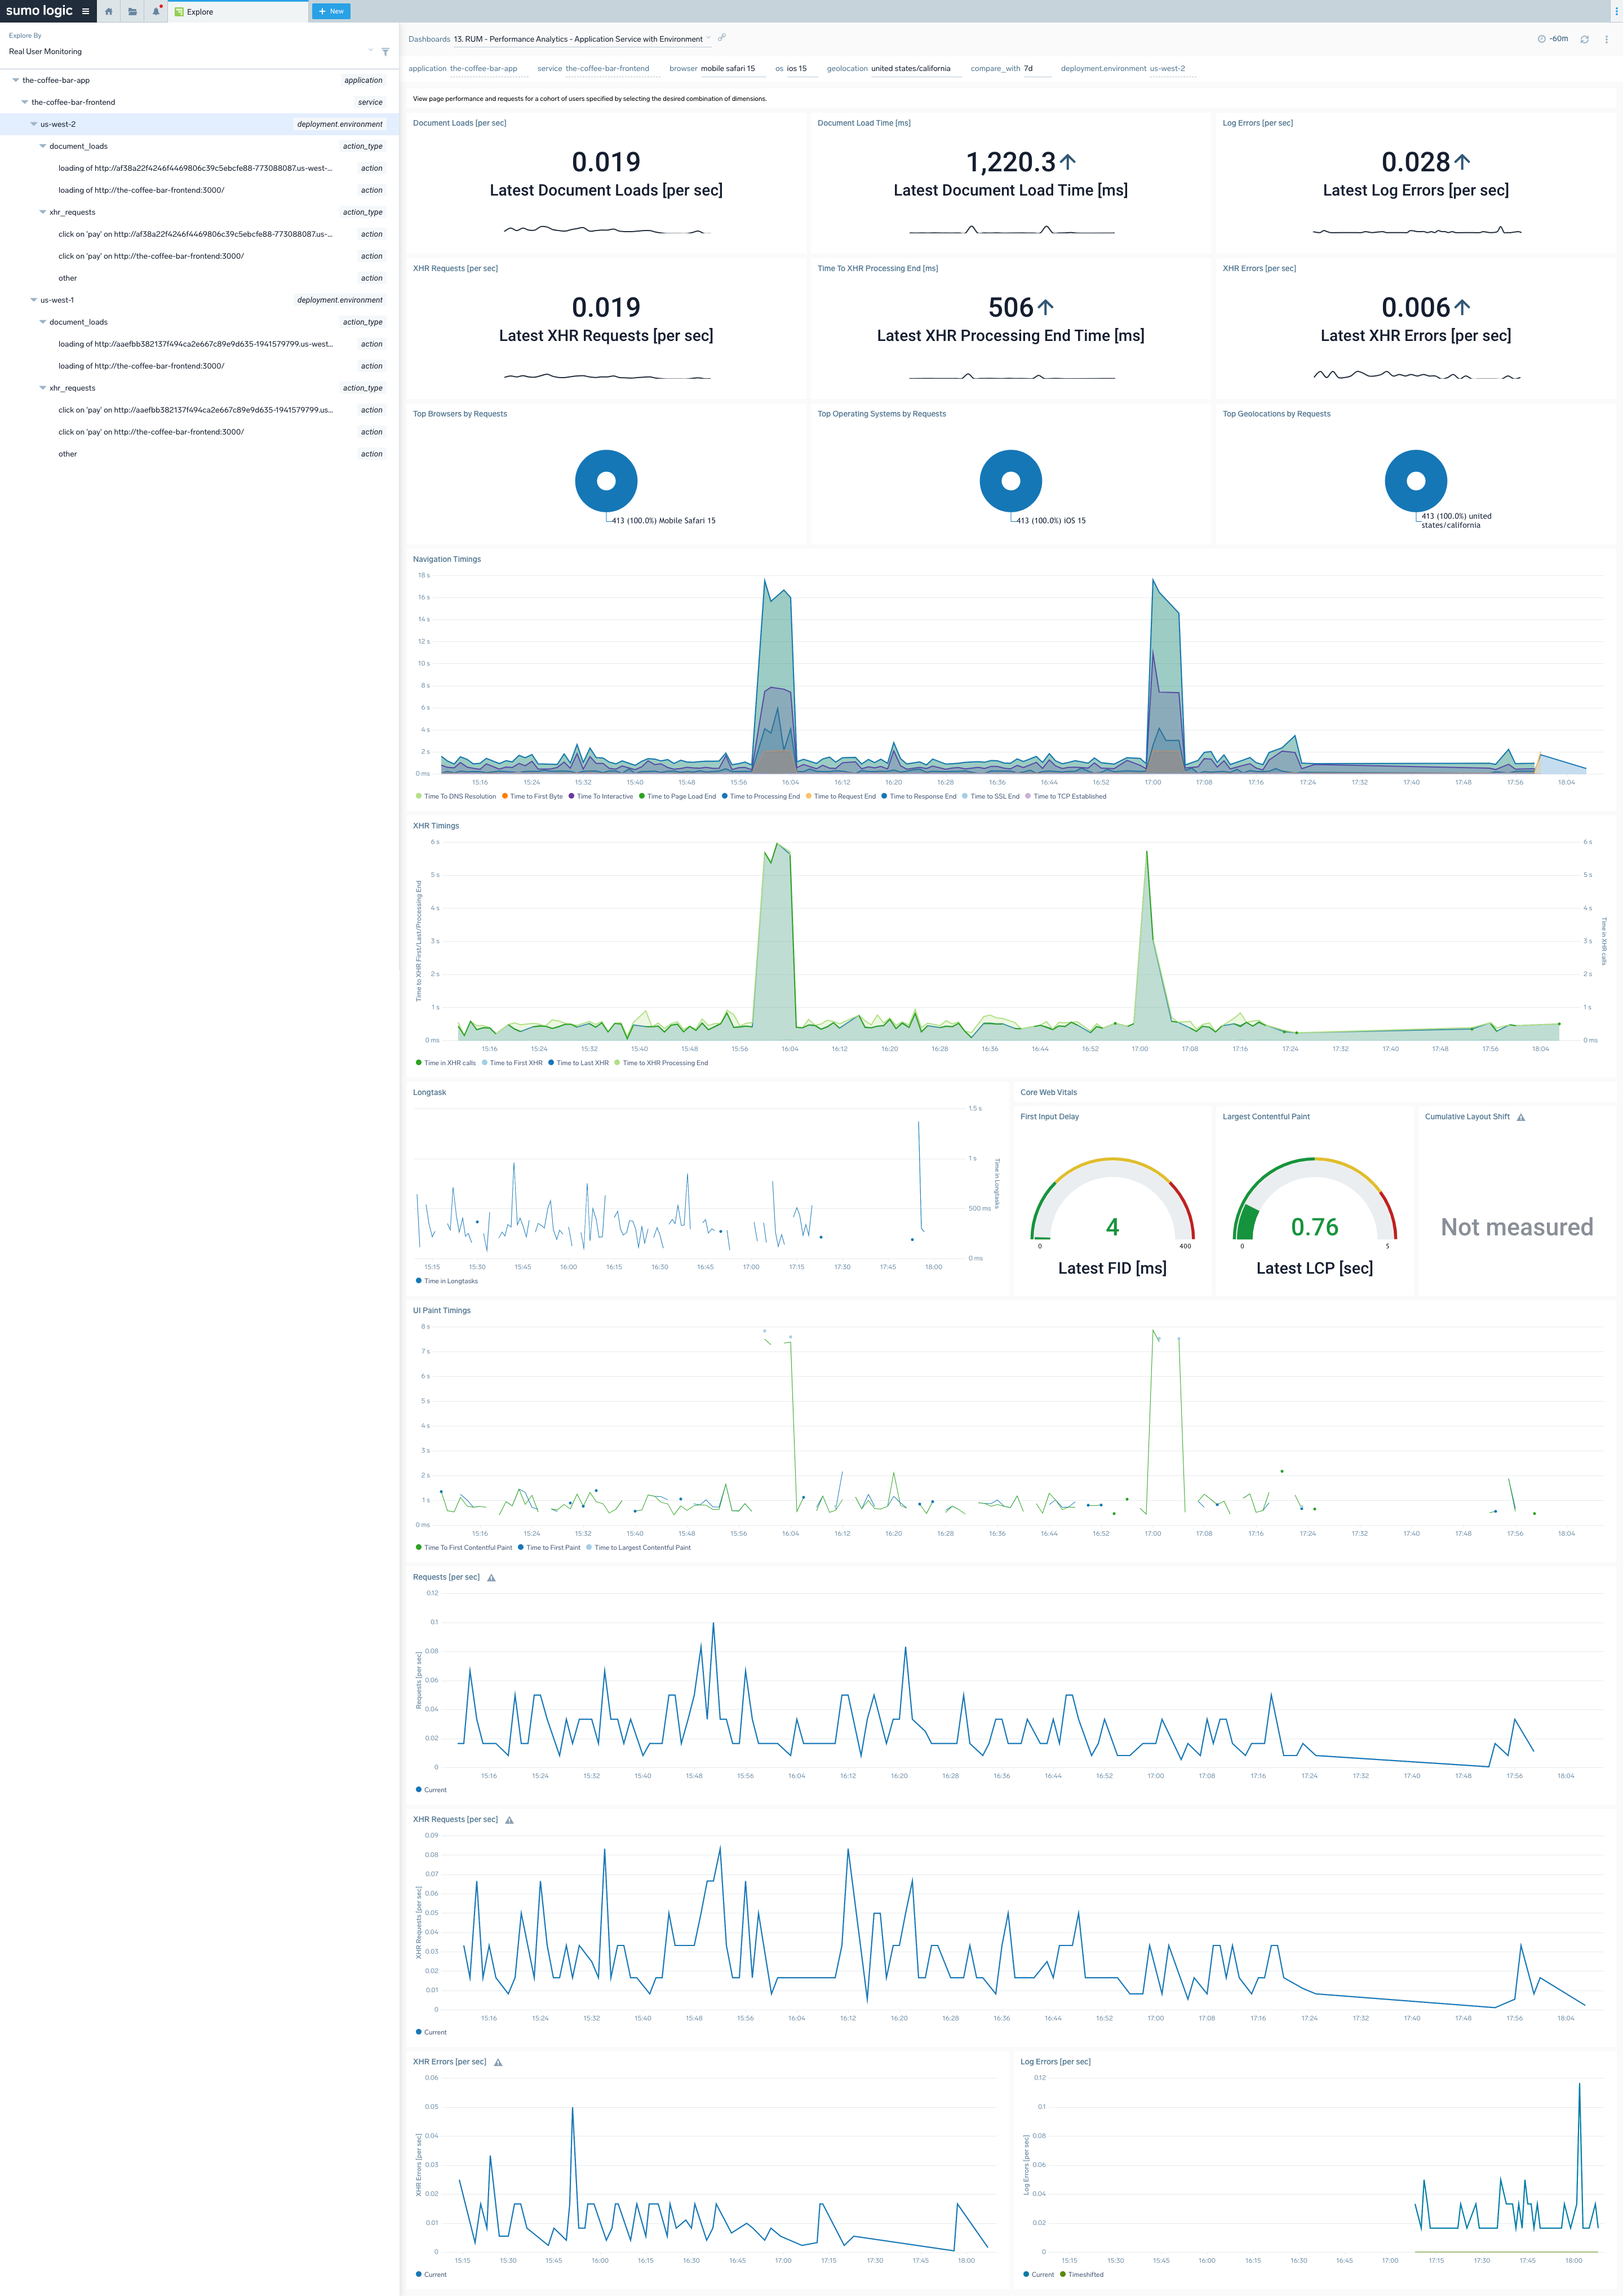
The RUM Performance Analytics dashboards for Application, Service, and Environment show the page performance and requests for a cohort of users specified by selecting the desired combination of dimensions.
Use these dashboards to:
- Filter data for specific combinations of browser, operating system, and/or geolocation.
- Understand XHR, load, timing metrics for the selected user cohort.
- Compare your selected timings against data for a different time period by selecting the appropriate option in the compare_with dropdown.
You can click on any data point on the charts to open a details panel and view the Infrastructure tab to drill-down to traces representing user transactions from the selected time point. For cross-dimensional metrics, only the average statistic type is available.
Collecting Browser Errors
Sometimes browser UI breaks in an unhandled way, failing to deliver the transaction and degrading user experience. That can happen in situations of unhandled errors or rejections, or failed resources. Also, developers can design the page to write erroneous messages to the console.
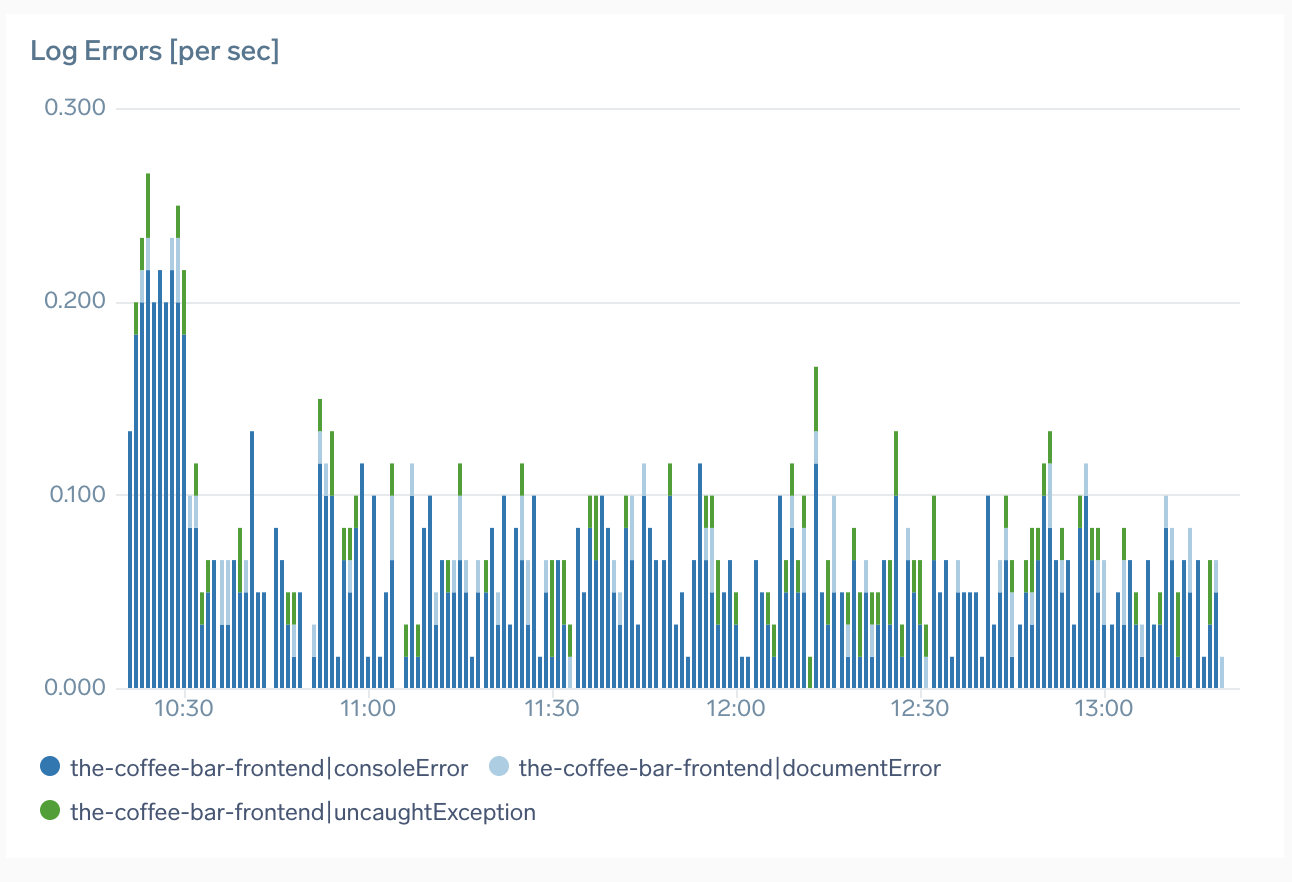
All of these situations are captured by Sumo Logic RUM browser instrumentation and forwarded to the same RUM source that is configured for traces data, that then forwards log data to sumologic_rum_errors log view. Aggregates from this view are also available on RUM dashboards in "Log errors" panels.
This way, you can have full visibility into the flow and categories of errors generated by various parts of your browser applications with contextual drill-down, free-form search and ability to build custom dashboards, which gives you the ability to shorten the troubleshooting time and pro-activeness in error tracing.
Browser error logs, although collected via RUM script, contribute to your log Continuous Tier quota and credit consumption.
Working with Browser Errors data
Data in the index is query-able using normal log search query. Here’s a sample query and results:
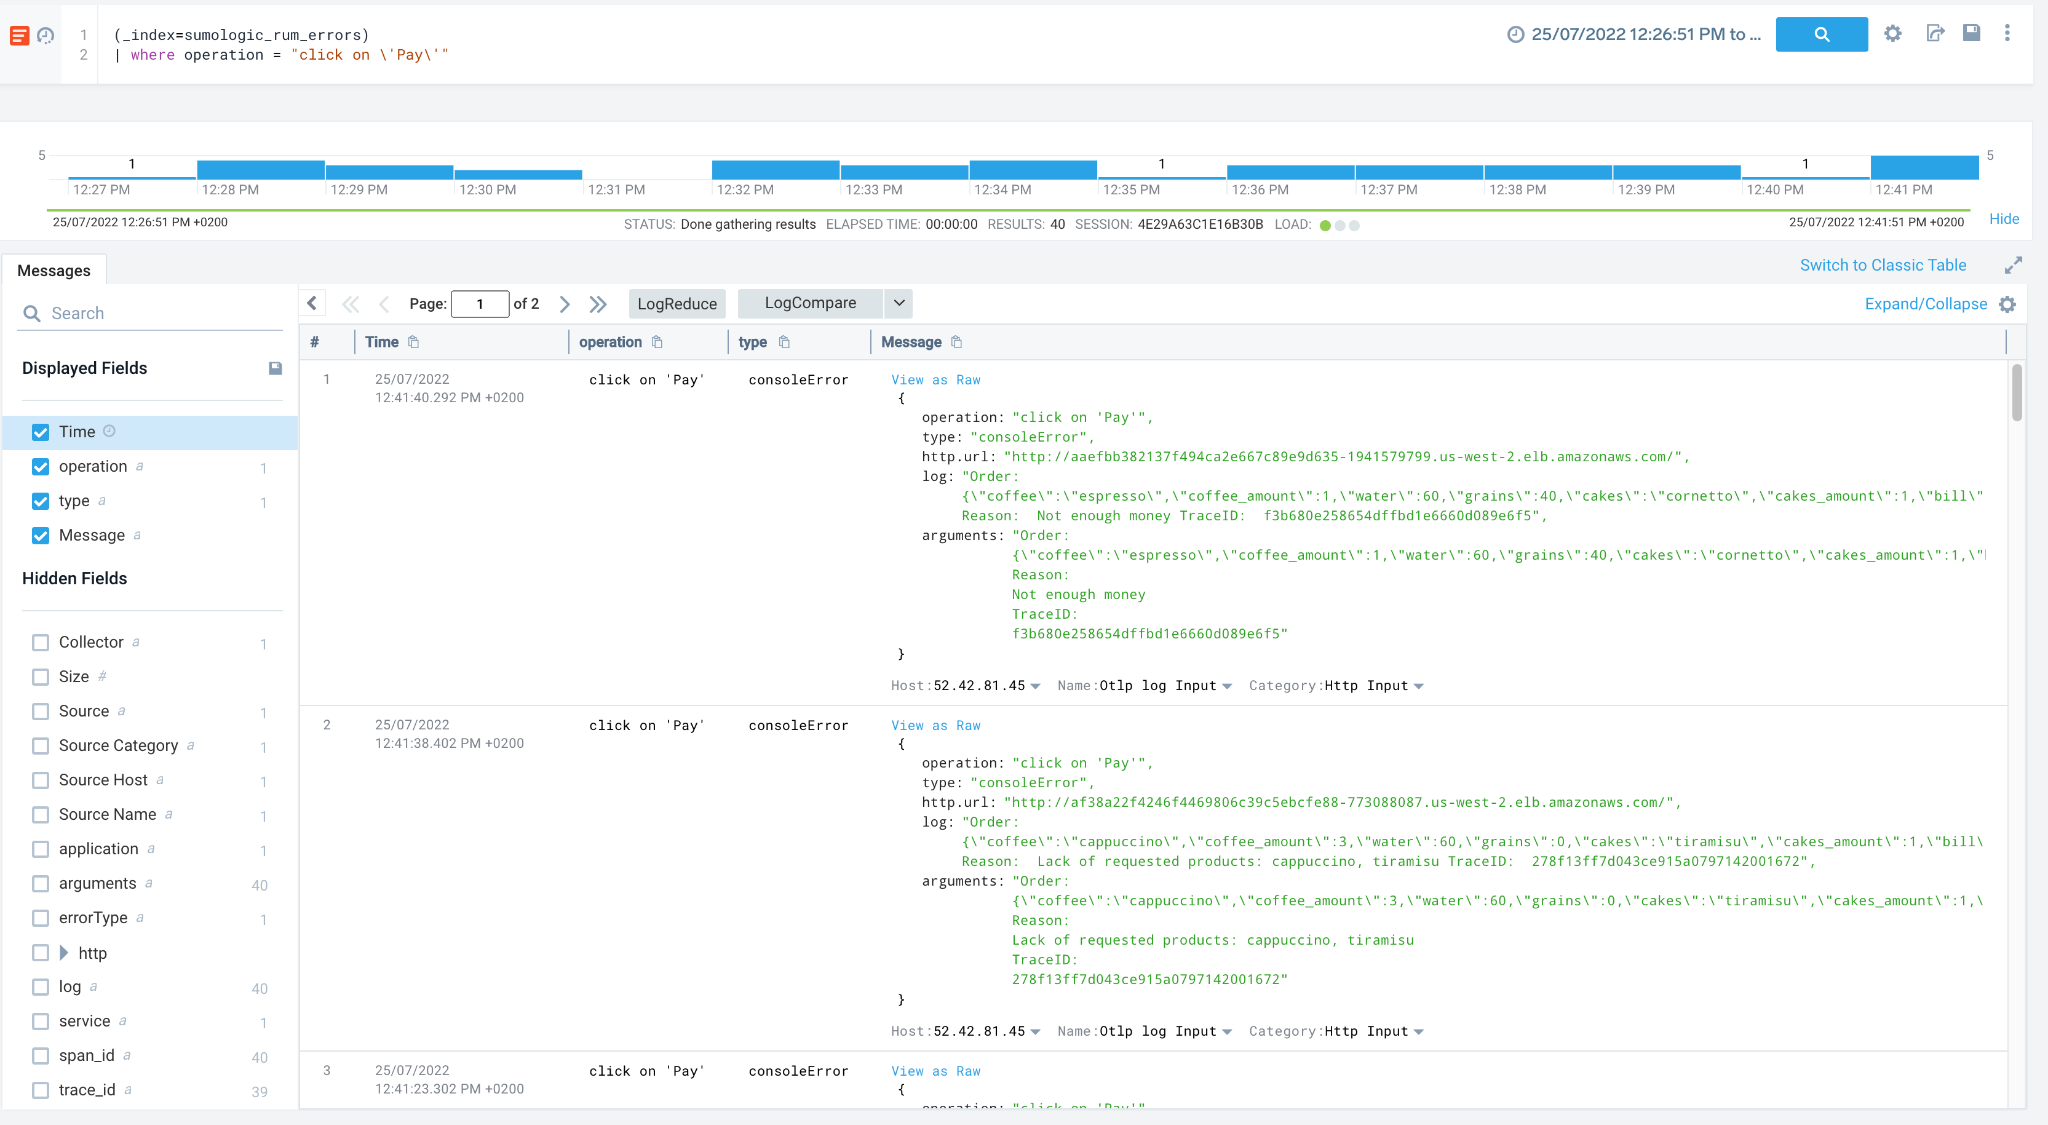
The following fields are available to better aggregate and filter your results:
- Application
- Service
- Operation
- Action name and type
- Url
- ErrorType
- Geolocation data
- User agent
- Span and Trace ids
Because errors don't always have to be connected with user actions, it is ok to leave some of these fields empty.
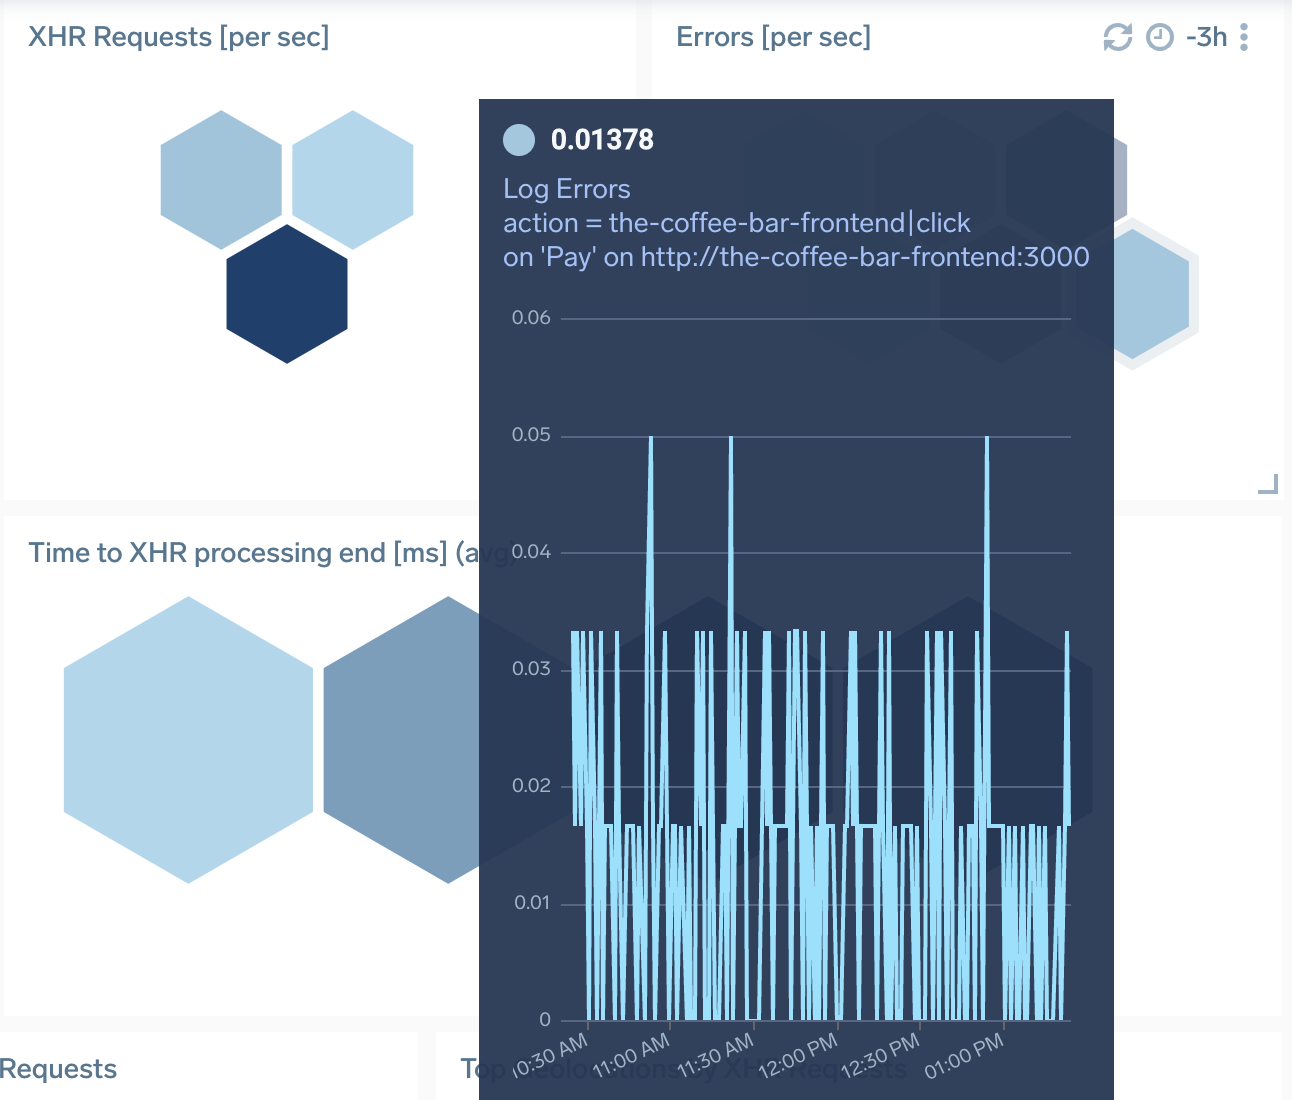
In addition to that, we also aggregate that information in form of log-query based panels and display on various dashboards:

Logs collection is enabled by default. You can disable by setting collectErrors=false in your RUM script options.