How to Use the Search Page
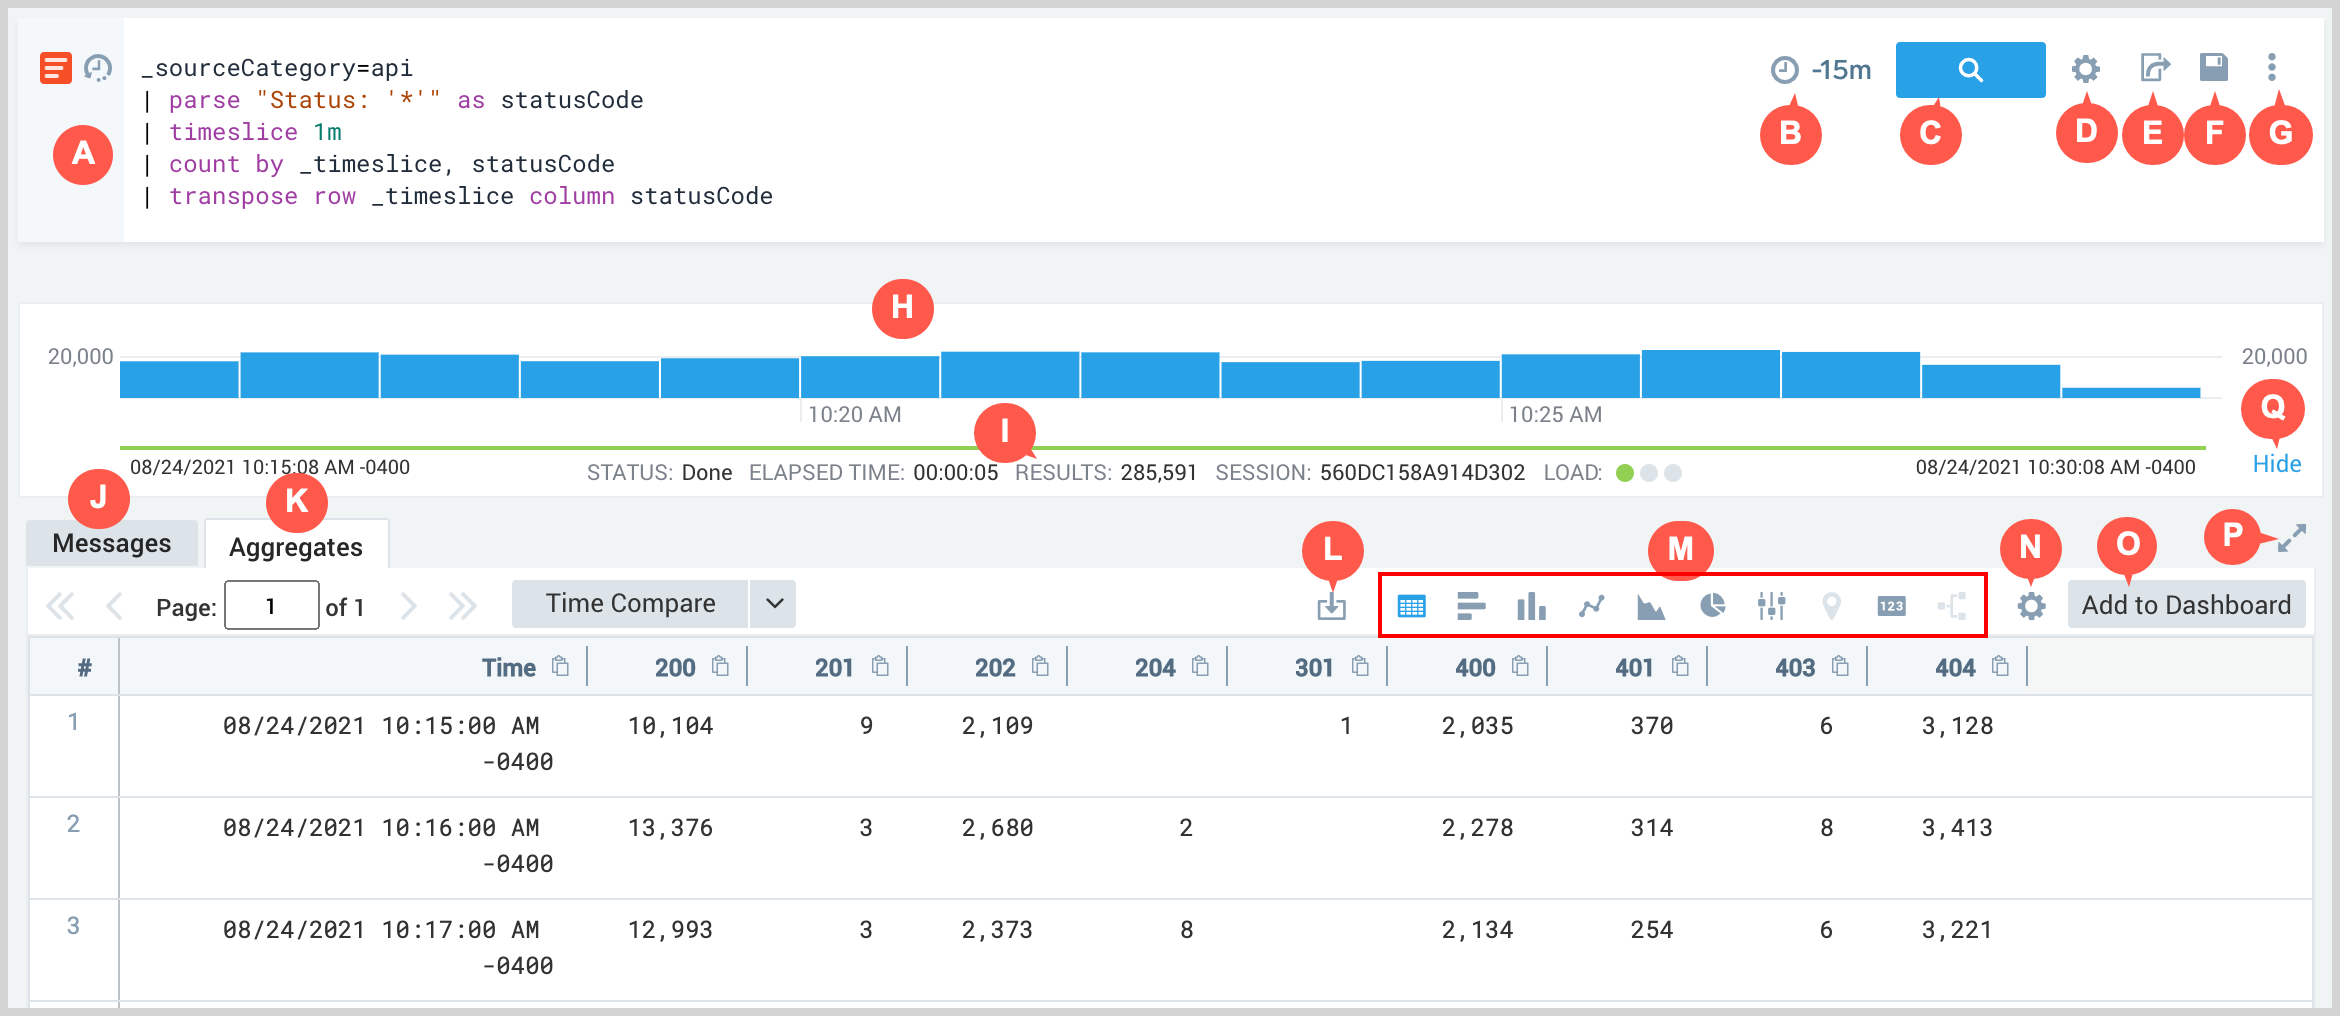
On the Search page, you can enter simple or complex queries to search your entire Sumo Logic data repository. You can save and select searches from your Library. After running a search, your results are displayed in either the Messages tab (for raw message data) or the Aggregates tab (for grouped results). See how to navigate through search results.
You can run a saved search, pause, or stop searches, or schedule a search to run periodically and notify you of the results.

| Letter | Purpose |
|---|---|
| A | Basic or Advanced mode search text box. Advanced mode searches are limited to a maximum of 15,000 characters in length. Click the clock icon to see recent searches. Previously run searches are saved automatically for your reference. Instead of recreating your search, you can select it from the dropdown. As you make changes, a message displays if you have not pressed enter to execute the query: |
| B | Time range of the search. |
| C | Start the search. |
| D | Click the gear icon to open the Search Config menu that has the options to use the receipt time and Auto Parse Mode. |
| E | Share a link for the currently running search. |
| F | Save or schedule a search. |
| G | Click the three-dot icon to open a menu with the following options:
|
| H | Histogram of the messages. |
| I | Search Details such as session, status, elapsed time, results, raw count, search expression, and load. When searching an Infrequent Partition the estimated and actual amount of data scanned is displayed. |
| J | Search results as messages. |
| K | Aggregate search results. |
| L | Download and export search results (up to 100,000 records) as a CSV file. |
| M | Chart) options for search results. |
| N | Click the gear icon to open a menu with the options to edit Display Message Preferences, Save as Default View, and Edit Settings JSON. |
| O | Add to Dashboard allows you to create a panel on a Dashboard from your search. If a Dashboard exists for the Search, you will have another option to Update Dashboard to update it based on changes made here. |
| P | Expands the results table and hides the histogram and search text area. |
| Q | Hides the histogram. |
Query colors explained
In your search query, you'll see that we have separated out important terms in a search for you by color to help you identify them quickly.

| Color | Purpose |
|---|---|
| Blue | Boolean operators (and, or, not) |
| Red | Quoted string |
| Purple | Sumo first operators (parse, nodrop, etc.) and secondary operators (row, column) |
| Green | Specific numeric values |
Guide contents
In this section, we'll introduce the following concepts:
📄️ Add a Saved Search to Favorites
You can mark a saved search as a favorite on the Search page so it appears in the Library on the Favorites tab.
📄️ Change the Time Range in the Histogram
You can highlight a time range in the histogram for your search results to filter the search results based on that time range.
🗃️ Field Browser
2 items
📄️ Modify a Search from the results table
After running a search, you can modify subsequent searches by selecting text displayed in the Messages tab.
📄️ Navigate Messages in Search Results
When you run a search query, messages display in the Message, Aggregates, or Summarize tabs in the lower half of the browser window.
📄️ Search Highlighting
When you perform a search, and results are returned, your search terms are highlighted in the Messages tab.
📄️ Search Load Indicator
The search load indicator gives you feedback on the amount of system load and provides suggestions on what you can do to reduce the load by making your query more specific.
📄️ Search Modes
Learn about the new search modes of our Log Search page.
📄️ Set Messages Tab Preferences
The Preferences menu in the Messages tab allows you to customize how messages are displayed.
📄️ Wildcards in Full Text Searches
You can use wildcards in full text searches.