Using the Sumo Logic Collection UI
This page provides an overview of the Sumo Logic Collection page UI, where you can manage all of your Collectors and Sources. To access the Collection page, go to Manage Data > Collection > Collection. 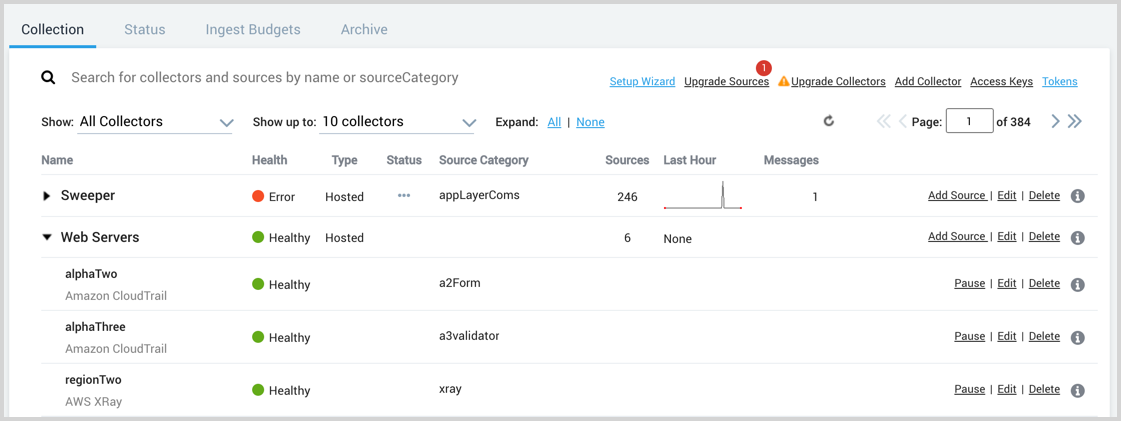
Prerequisites
You'll need the Manage or View Collectors role capability to manage or view Collection.
Collection Page Features
- Search for a Collector or Source
- View the health of Collectors and Sources
- Upgrade Sources from the Cloud-to-Cloud Integration Framework
- Upgrade Collectors
- Add an Installed Collector or a Hosted Collector
- Use the Show options to filter the list
- Use the Expand options to show or hide information about the Sources
- Use the paging controls to navigate the list of Collectors
Collector Actions
- Add a Source
- Edit a Collector
- Delete a Collector
- Download a JSON configuration file for scripting or backup
- Restart a Collector
Source Actions
- Edit a Source
- Delete a Source
- Download a JSON configuration file for scripting or backup
- Pause or resume a Source (cloud polling Sources only)
- Show or regenerate a Source URL (HTTP Sources only)
- Show or regenerate a Source token (cloud syslog Source only)
View Information about Collectors and Sources
- Name. Displays the name of the Collector, and any Sources that are configured under it. It also displays the type of Source (HTTP, Local File, Local Windows Event Log, etc.)
- Open in Search. Hover over the Name of the Collector or Source and click the Open in Search icon to start a search in the Search page.
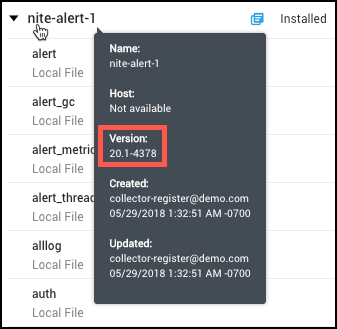
- Tooltip. Hover over a Collector or Source name to display an informational tool tip. The Collector's version is provided in the tooltip.
- Health. Shows color-coded healthy, error, and warning states for Collectors and Sources so you can quickly determine the health of your Collectors and Sources. If an Installed Collector appears offline try restarting the service and testing connectivity.
- Type. Displays whether the Collector is an Installed or Hosted Collector.
- Status. Shows the status of Sources manually paused by users.
- Source Category. Displays the name of the configured Source Category for this Collector or Source.
- Sources. Displays the number of Sources configured under a Collector.
- Last Hour. Displays a graph of the total number of log messages ingested per minute over the past hour.
- Messages. Displays the total number of log messages ingested over the past hour.
Guide contents
In this section, we'll introduce the following concepts:
📄️ Search for a Collector or Source
Search for a Collector or Source on the Manage Collection page.
📄️ Start or Stop a Collector using Scripts
Use scripts used to start, stop, and check the status of the Collector process (Linux/Unix) and service (Windows).
📄️ Restart a Collector
Learn how to restart a Collector from the Collection page.
📄️ Edit a Collector
Edit some characteristics of a Collector, including its name, version, description, Host Name, and Category.
📄️ Edit a Source
Edit characteristics of a Source.
📄️ Pause and Resume a Source
You can pause a cloud polling Source at any time to stop the Source from sending data from the Source to Sumo Logic.
📄️ Delete a Collector or Source
You can delete a Collector or Source from Sumo Logic.
📄️ Set a Collector CPU Usage Target
Set a CPU Target to limit the amount of CPU processing a Collector uses, if required.
📄️ Upgrade a Collector
When you upgrade a Collector, the upgrade file is automatically downloaded and executed from Sumo Logic. You can also download the latest Collector version and upgrade your installed Collector using operating system commands.
📄️ Collector Logs
Installed Collectors store log events locally.
🗃️ Processing Rules
6 items