Create a Dashboard
Almost any query you run that produces aggregate results can be saved as a Data Panel in a Live or an Interactive Dashboard. Aggregating (grouping) functions evaluate messages and place them into groups.
Queries can be up to 10,240 characters in length.
After running a query, choose the layout for the Panel from the chart icons (table, bar chart, column chart, line graph, area chart, pie chart, or map) in the Aggregates tab. (You'll be able to change the layout of the Panel at any time.)
In the Aggregates tab, click the Add to Dashboard button.
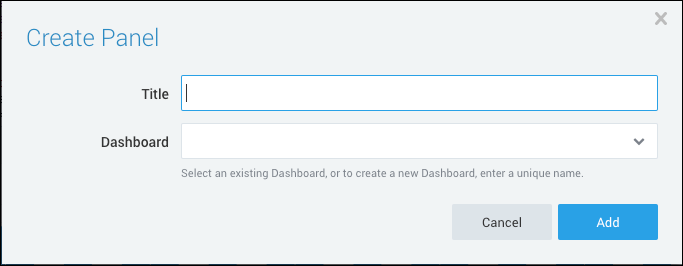
In the Create Panel dialog box, do the following:
- For Title, type the name of the Panel.
- For Dashboard, type the name of the new Dashboard to which you'd like to add the Panel. The Dashboard type is set when you create the Dashboard, and it cannot be changed later.

Click Add.
The new Dashboard opens and displays the new Panel.
Add a Panel to an Existing Dashboard
After running a query, choose the layout for the Panel from the chart icons (table, bar chart, column chart, line graph, area chart, pie chart, or map) in the Aggregates tab. (You'll be able to change the layout of the Panel at any time.)
In the Aggregates tab, click the Add to Dashboard button.
In the Create Panel dialog box, do the following:
- For Title, type the name of the Panel.
- For Dashboard, select the Dashboard to which you'd like to add the Panel.

Click Add.
The Dashboard displays the new Panel.
Why does the data look different in the new Panel?
The results of a query in the Search tab of the web application are displayed based on the time range you chose when you initially ran the search. When you add the search as a Panel, the query is essentially re-run using a fresh time range. If you've just added a Panel with a long time range, like 24 hours, it can take up to 24 hours to see the full results in a Panel.

