Getting Started with Sumo Logic
Sumo Logic is an all-in-one platform for monitoring, analyzing, troubleshooting, and visualizing data from your application and network environment. This Onboarding Checklist provides the tasks you'll need to start your Sumo Logic experience.
Here you will learn how to:
- Get your data into Sumo
- Search and analyze your data
- Monitor and troubleshoot your environment
- Share your findings with your team
Contact us at the Sumo Dojo Slack or enter a support ticket.
Your Sumo Logic Journey
Sumo Logic puts the power of data analytics at the fingertips of everyone on your team. Sumo's pre-configured searches and at-a-glance visual dashboards make it easy to search, filter, and analyze your data. Visual displays of up-to-date data allow you to monitor the health and fitness of your application and network, providing insights for troubleshooting and timely resolutions.
Let's get started!
Step 1: Get your data into Sumo
The journey of 10,000 logs begins with a single collector. You start your data analytics journey by sending your data to Sumo. You do this by setting up a local Installed Collector or web-Hosted Collector, then choosing the data sources that will provide the most value for you.
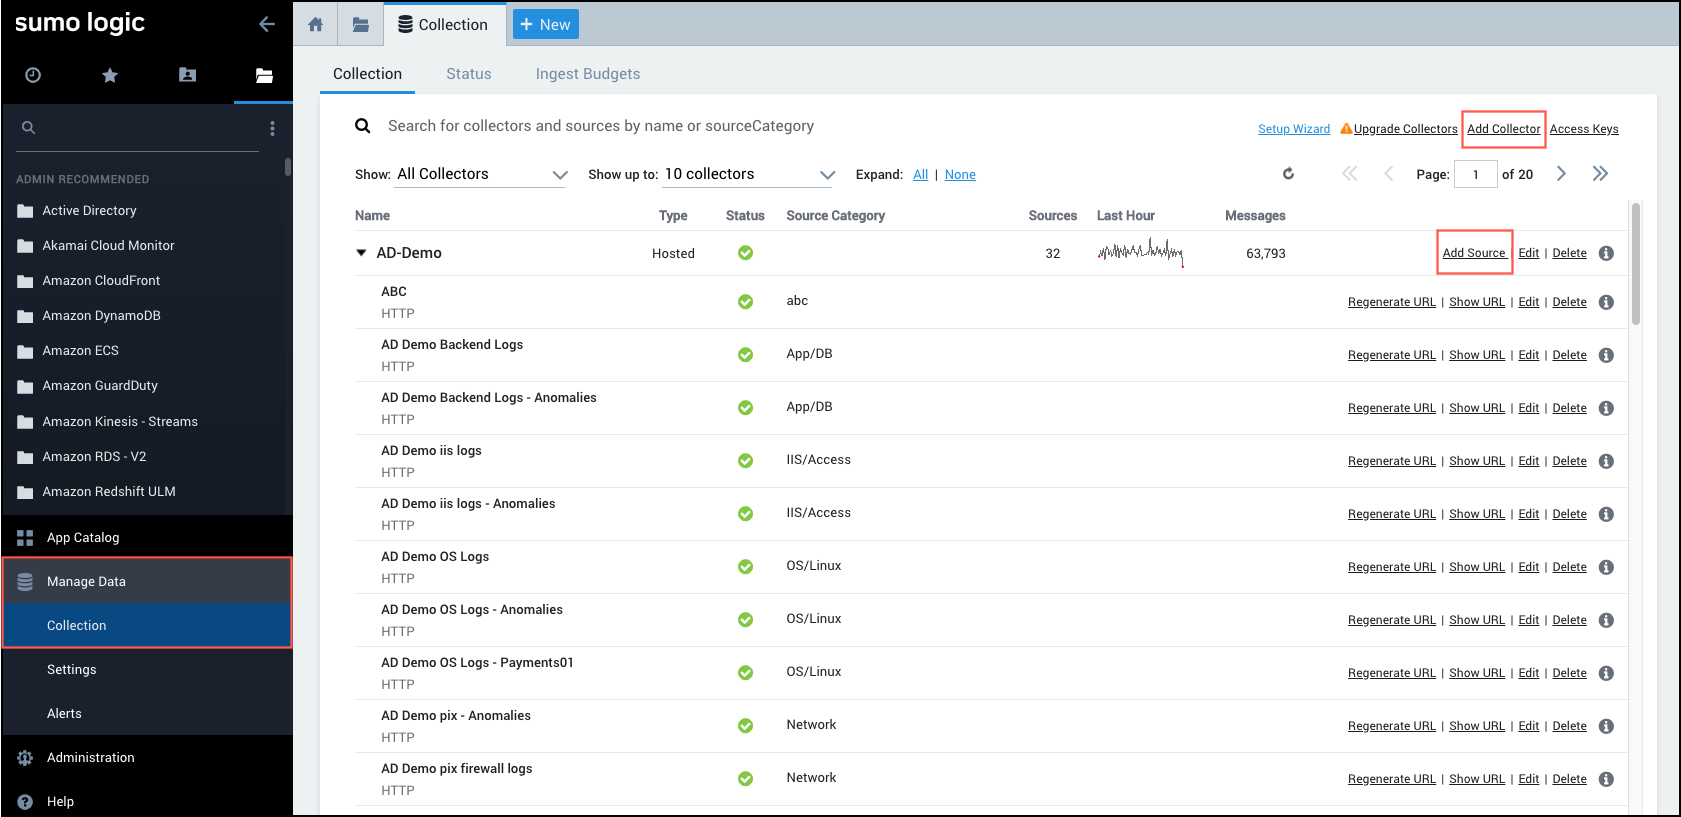
- You can set up a collector by choosing Manage Data > Collection on the Sumo Home page, then selecting Add Collector in the Collection window. For more information, see the [Install a Collector] tutorial.
- You can set up a source when your installed collector appears in the table on the Collection page, by navigating to the collector and selecting Add > Add Source. For more information, see the [Add a Source] tutorial.

Step 2: Search and analyze your data
Once your data is available in Sumo, you and your co-workers can search your logs and metrics to identify unusual conditions or errors that could indicate a problem. You do this by creating queries and parsing the resulting messages.
You can start a log search, metrics search, or live tail from the Sumo Home page by clicking the respective icon. For walkthrough instructions on how to create a query and parse the messages, see the [Search Log Data] tutorial.
![]()
The Setup Wizard is a quick way to get started loading data into Sumo Logic, then searching an analyzing the data with Sumo Logic's predefined searches and dashboards.
Step 3: Monitoring and troubleshooting your environment
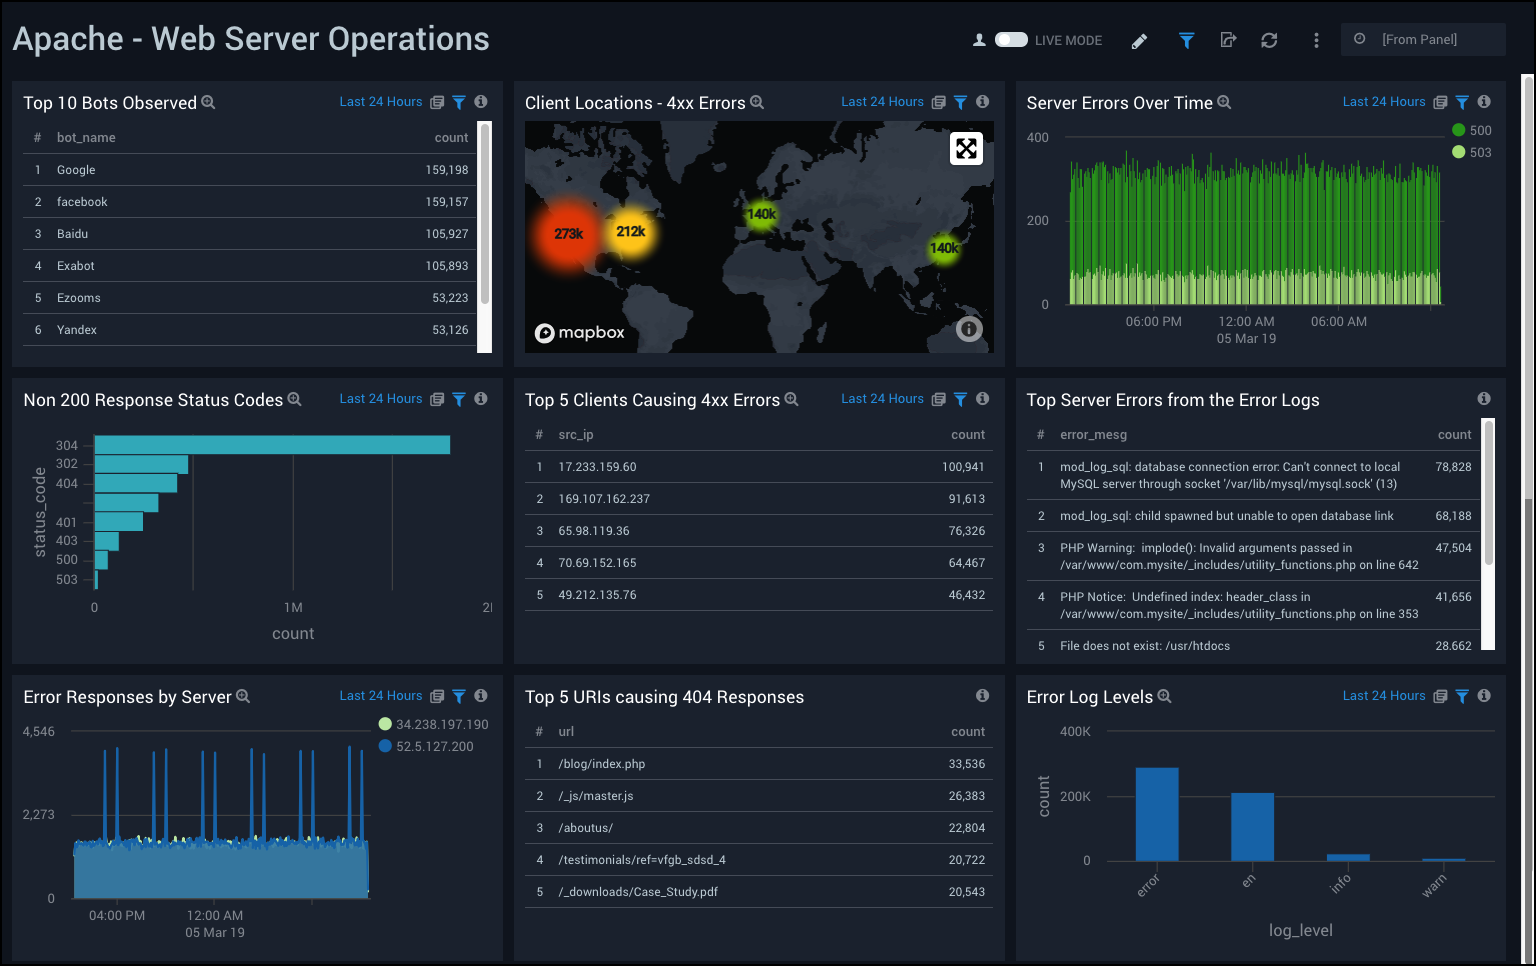
Not sure how to use your data to monitor and and troubleshoot your environment? Sumo Logic offers a variety of Apps with predefined queries and visualizations that help you get up and running quickly.
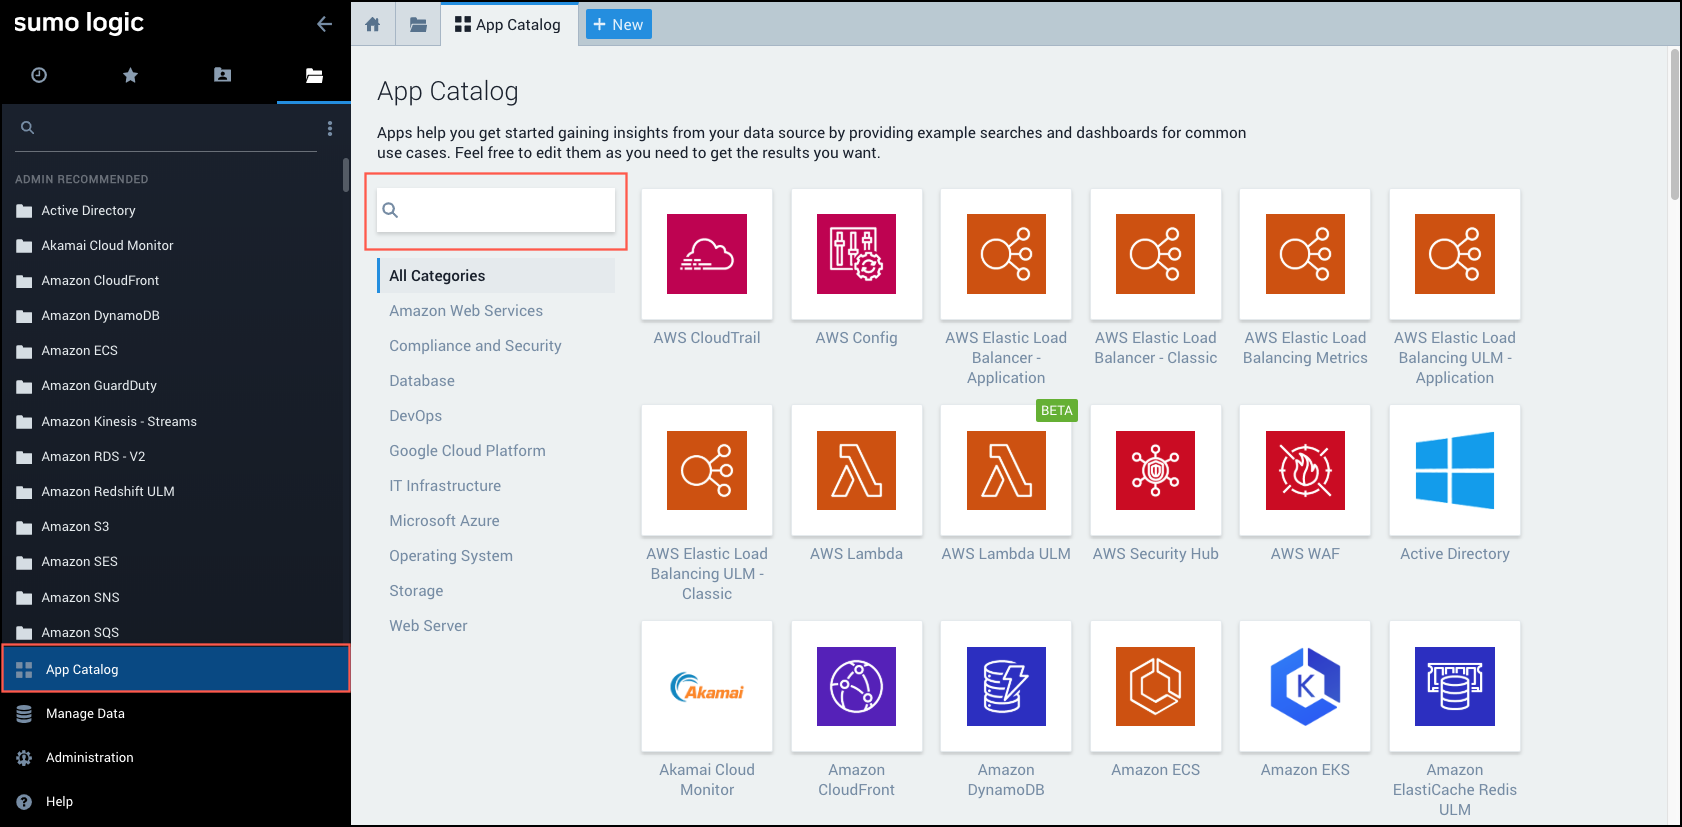
- You can peruse the library of available apps by selecting App Catalog in the left navigation panel, then scrolling through the library or entering a name in the search field. For more information, see the [Install an App and View Data] tutorial.

- You can view your data with predefined searches and dashboards that facilitate monitoring and troubleshooting. For more information, see the [Collect and Visualize Host Metrics] tutorial.

Step 4: Share your findings with your team
You have downloaded an app and analyzed your data with searches and dashboards. You may even have [modified your dashboards], and now you want to share your findings with your team. You can easily share a dashboard by clicking the share icon in the top menu bar.

You have the ability to share with individual users and groups with specific roles, setting the specific access permissions. You can edit the sharing permissions at any time, and share and revoke permissions as needed. For more information see the [Share Content] page.
Adventures in Learning
Knowledge is power, and Sumo Logic provides tools for you to empower yourself. Within Sumo Logic, you have easy access to training, help, and a community of other Sumo Logic users.
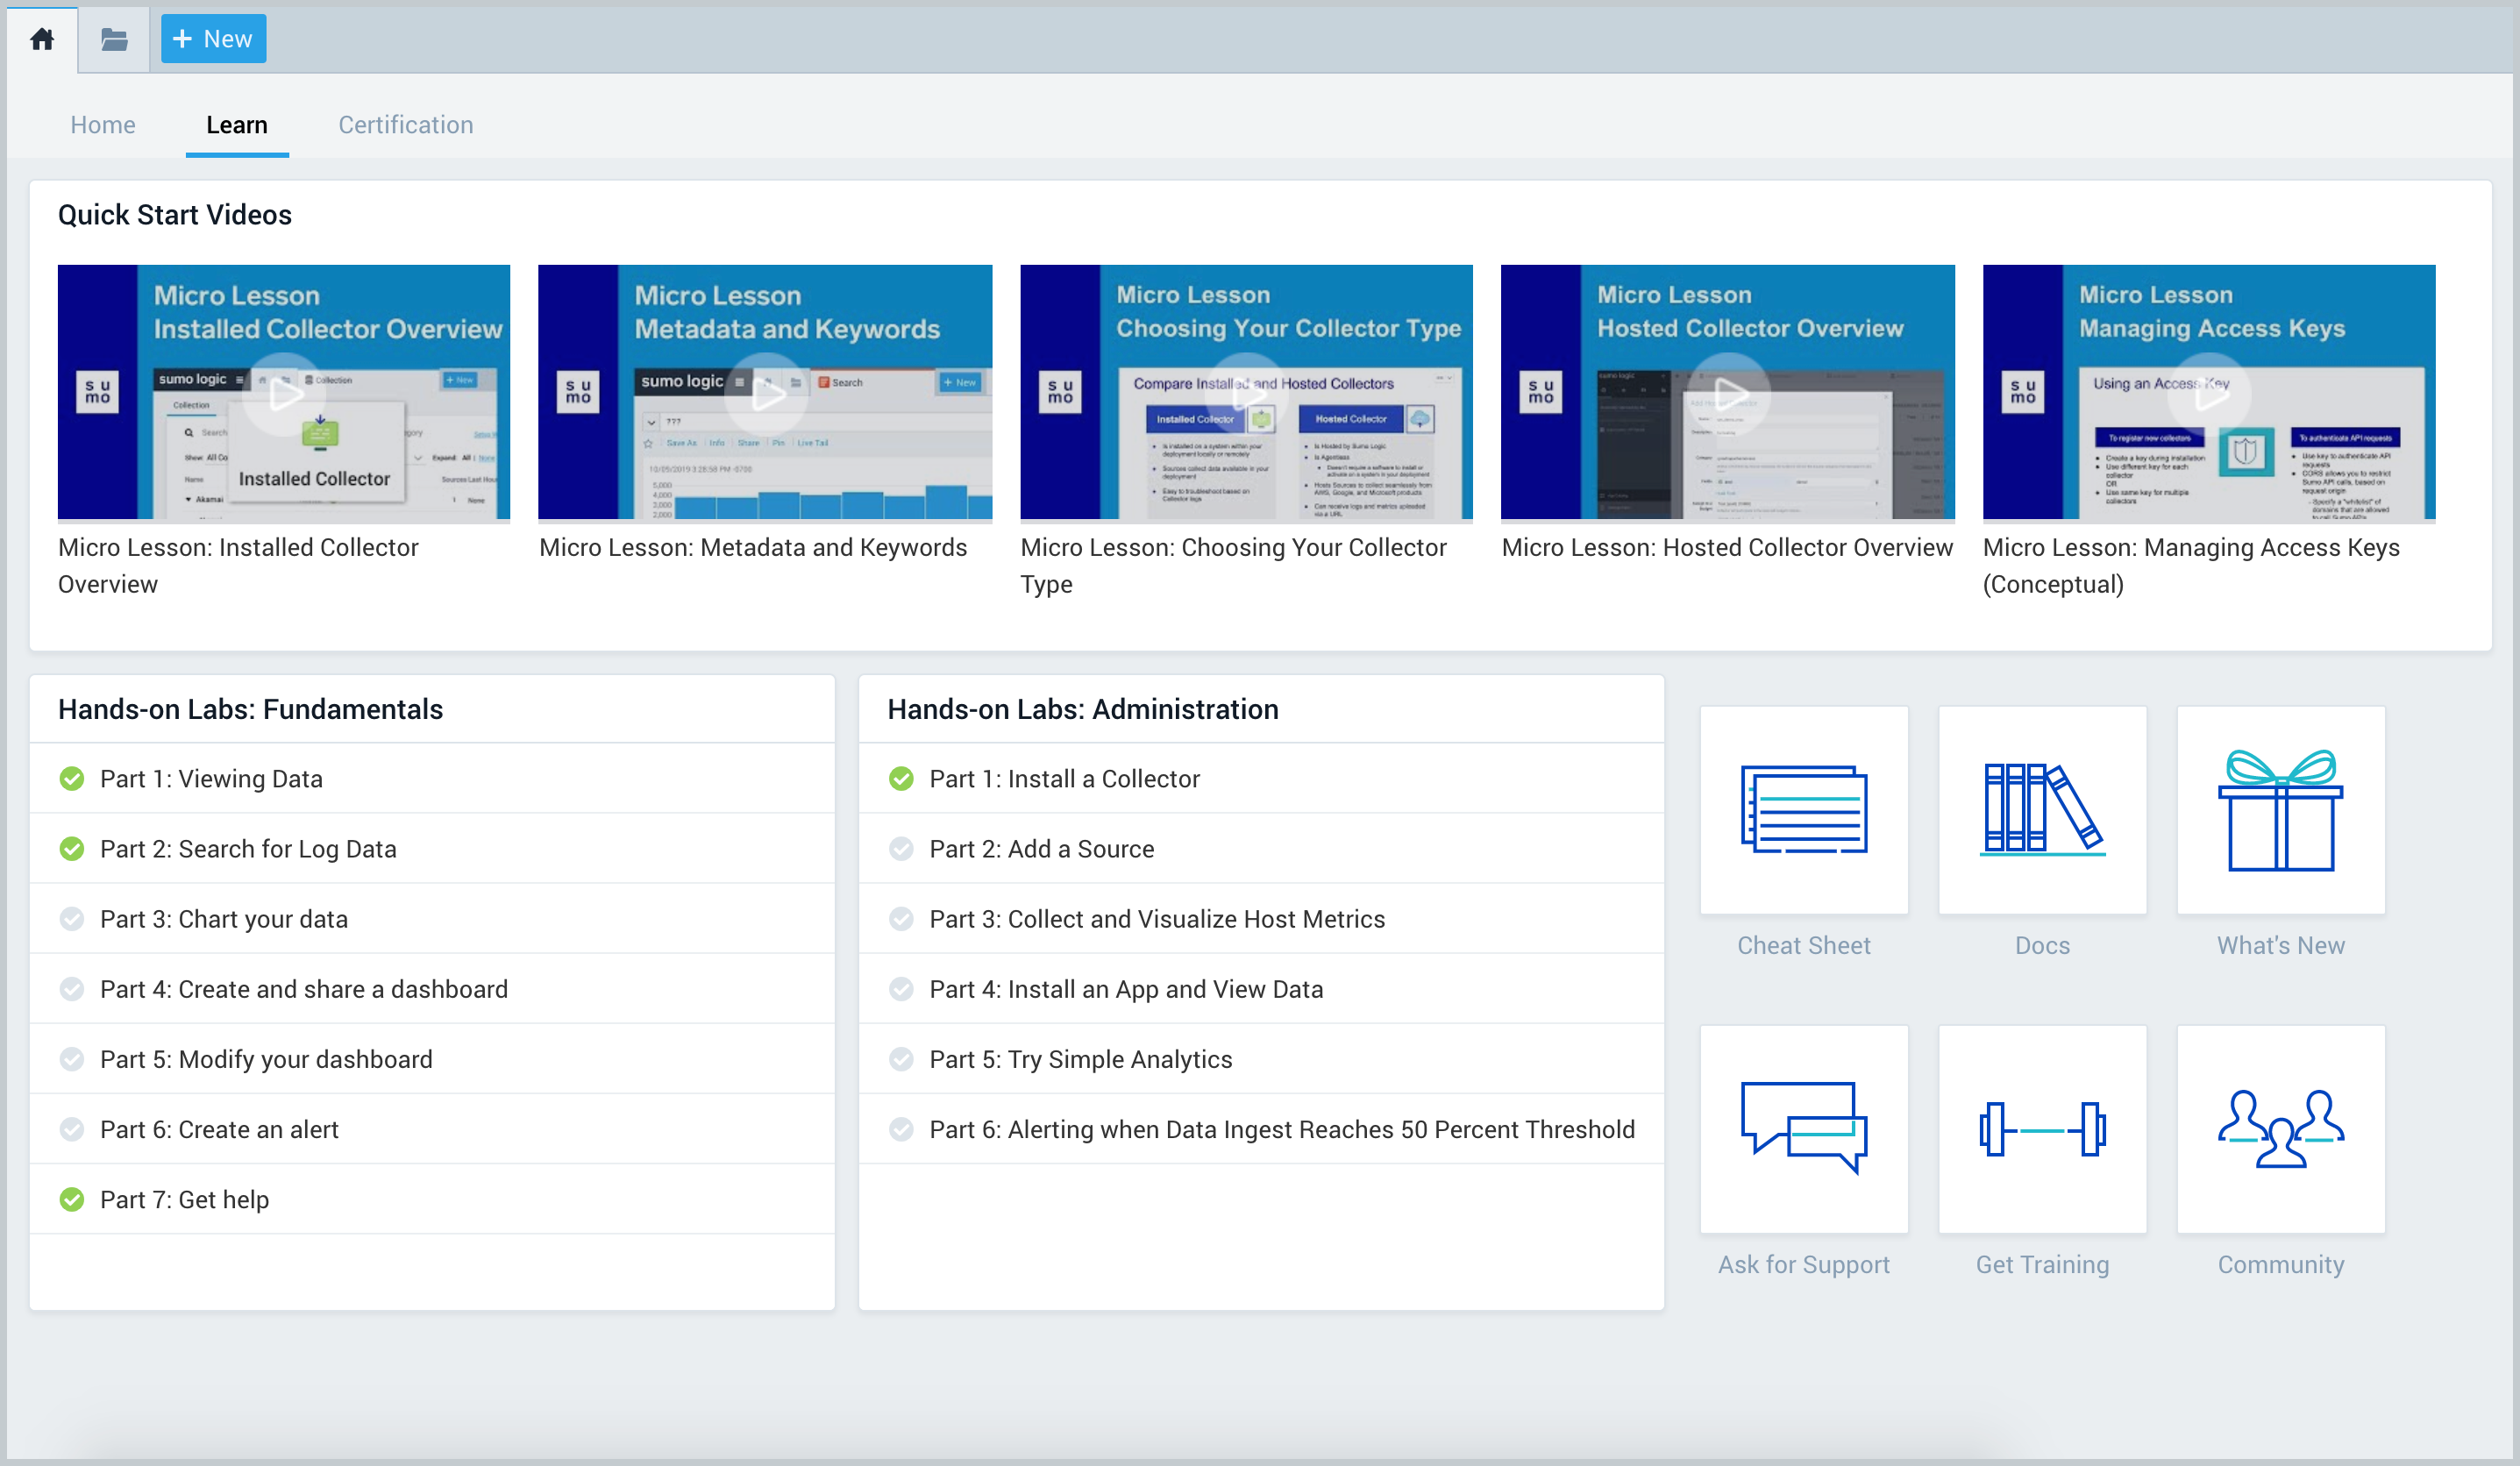
Just click Learn on the Home page to access:
- Quick Start videos
- Getting Started tutorials
- Sumo docs, support, community, and training

Become a Sumo Logic Certified User
Do not just learn it, master it! Get recognized as a Sumo Logic expert by completing the courses in the Sumo Logic Certification Program. We’re happy to help you get certified right from the product.
Fundamentals — Learn the basics of searching, parsing and analyzing logs and metrics. You will run searches and perform simple parsing and basic analytics on your data. Then, you will convert queries to charts and add them to Dashboards so you can visualize trends and identify anomalies. Lastly, you create and modify Alerts to stay on top of critical events.
Search Mastery — Dig deeper into searching, parsing and analyzing logs and metrics. Learn how to use outlier, predict, logReduce, LogCompare and LiveTail operators, and visualize the data with charts and dashboards to identify trends and anomalies. Lastly, learn how to set up meaningful Alerts to keep informed of your critical events.
Administration — Set up data collection to maximize your organization’s data sources. Learn best practices for deployment options, to ensure scalability as your organization grows. Learn how to design and implement consistent naming conventions and automate deployment using tools like Chef or Puppet.
Security Analytics — Learn how Sumo Logic’s Threat Intelligence tools can help you protect the integrity of your environment by matching IOCs like IP address, domain names, URL, email addresses, MD5 hashes, to increase velocity and accuracy of threat detection. Hands on labs allow you to practice the concepts, by applying them to real-life use cases.
Have fun with Sumo Logic
Learning and mastering Sumo skills is important, but so is having fun. Enjoy the Sumo journey. The journey is its own reward when you empower others along the way.

