Sumo Logic App for Amazon Aurora MySQL ULM

Amazon Aurora is a MySQL is a relational database built for the cloud. The Sumo Logic App for Aurora MySQL ULM is a unified logs and metrics (ULM) app for your Aurora MySQL database. The app allows you to monitor slow queries executing on the database, the number of connections made, identify users and client hosts, and client locations used to connect to database. The app also provides insights for queries executed per second, CPU utilization, free memory, network utilization, volume read and write IOPS, replica lags, latency, throughput, failed login and connection attempts, and other health and performance related data.
The Sumo Logic App for Aurora MySQL ULM includes predefined searches and dashboards that allow you to monitor logs and metrics for the database. The logs enable you to monitor database activity, user activity, incoming connections, query execution time, and errors. The metrics allow you to monitor database resource utilization and throughput performance.
This guide provides an overview of the Aurora MySQL ULM App pre-defined queries and dashboards, as well as instructions for collecting logs and metrics from Aurora MySQL, and installing the App.
Log and Metric types
The Sumo Logic App for Aurora MySQL ULM uses the following logs and metrics. Click the link for more information about the log type:
- AWS Cloud Trail
- Aurora CloudWatch Logs
- Error
- Slow Query
- General
- Audit
- Aurora CloudWatch Metric
Sample Logs
{
    "eventVersion":"1.05",
    "userIdentity":{
        "type":"IAMUser",
        "principalId":"AIDABCDEFGH4QEWUABG5Q",
        "arn":"arn:aws:iam::951234567898:user/Nitin",
        "accountId":"951234567898",
        "accessKeyId":"ASIABCDEFGHFBOT4FDVK",
        "userName":"Nitin",
        "sessionContext":{
            "attributes":{
                "mfaAuthenticated":"true",
                "creationDate":"2018-10-28T08:16:35Z"
            }
        },
        "invokedBy":"signin.amazonaws.com"
    },
    "eventTime":"2018-10-28T08:55:37Z",
    "eventSource":"rds.amazonaws.com",
    "eventName":"CreateDBCluster",
    "awsRegion":"us-west-1",
    "sourceIPAddress":"140.144.120.190",
    "userAgent":"signin.amazonaws.com",
    "requestParameters":{
        "backupRetentionPeriod":1,
        "databaseName":"NitinSampleDB",
        "dBClusterIdentifier":"auroramysql57dbcluster02-cluster",
        "dBClusterParameterGroupName":"default.aurora-mysql5.7",
        "vpcSecurityGroupIds":[
            "sg-0123454e5b1da3aff"
        ],
        "dBSubnetGroupName":"default-vpc-b92fc5d7",
        "engine":"aurora-mysql",
        "engineVersion":"5.7.12",
        "port":3306,
        "masterUsername":"nitin",
        "masterUserPassword":"****",
        "storageEncrypted":true,
        "enableCloudwatchLogsExports":[
            "audit",
            "error",
            "general",
            "slowquery"
        ],
        "engineMode":"provisioned"
    },
    "responseElements":{
        "allocatedStorage":1,
        "availabilityZones":[
            "us-west-1a",
            "us-west-1b",
            "us-west-1c"
        ],
        "backupRetentionPeriod":1,
        "databaseName":"NitinSampleDB",
        "dBClusterIdentifier":"auroramysql57dbcluster02-cluster",
        "dBClusterParameterGroup":"default.aurora-mysql5.7",
        "dBSubnetGroup":"default-vpc-b92fc5d7",
        "status":"creating",
        "endpoint":"auroramysql57dbcluster07-cluster.cluster-cp1svq2n34sd.us-west-1.rds.amazonaws.com",
        "readerEndpoint":"auroramysql57dbcluster07-cluster.cluster-ro-cp5svq2n34sd.us-west-1.rds.amazonaws.com",
        "multiAZ":false,
        "engine":"aurora-mysql",
        "engineVersion":"5.7.12",
        "port":3306,
        "masterUsername":"nitin",
        "preferredBackupWindow":"03:25-03:55",
        "preferredMaintenanceWindow":"tue:03:58-tue:04:28",
        "readReplicaIdentifiers":[

        ],
        "dBClusterMembers":[

        ],
        "vpcSecurityGroups":[
            {
                "vpcSecurityGroupId":"sg-012345e5b1da3aff",
                "status":"active"
            }
        ],
        "hostedZoneId":"Z2R2ITUGPM61AM",
        "storageEncrypted":true,
        "kmsKeyId":"arn:aws:kms:us-west-1:951234567898:key/9a3d8016-4cdb-478f-a3a4-9a310fc25307",
        "dbClusterResourceId":"cluster-AVPSEUMFISOMMXXVGKL4GBUC2E",
        "dBClusterArn":"arn:aws:rds:us-west-1:951234567898:cluster:auroramysql57dbcluster02-cluster",
        "associatedRoles":[

        ],
        "iAMDatabaseAuthenticationEnabled":false,
        "clusterCreateTime":"Oct 28, 2018 8:55:35 AM",
        "enabledCloudwatchLogsExports":[
            "audit",
            "error",
            "general",
            "slowquery"
        ],
        "engineMode":"provisioned",
        "deletionProtection":false
    },
    "requestID":"2cbb7974-b79c-4121-aed1-5ebe8f945b72",
    "eventID":"7e554be7-0a00-4f8f-9e56-a2d54519fff9",
    "eventType":"AwsApiCall",
    "recipientAccountId":"951234567898"
}
{
    "timestamp":1540983162255,
    "message":"1540983162255314,auroramysql57dbcluster02,npande,149.148.162.25,7556,640361,QUERY,NitinSampleDB,'DROP user IF EXISTS npande1',0",
    "logStream":"auroramysql57dbcluster02.audit.log.1.2018-10-30-04-02.0.2",
    "logGroup":"/aws/rds/cluster/auroramysql57dbcluster02-cluster/audit"
}
{
    "timestamp":1541352616280,
    "message":"2018-11-04T17:30:16.280728Z 28167 [Note] Access denied for user 'npande'@'149.148.77.110' (using password: YES)",
    "logStream":"auroramysql57dbcluster02",
    "logGroup":"/aws/rds/cluster/auroramysql57dbcluster02-cluster/error",
    "requestID":"28167"
}
{
    "timestamp":1541352658026,
    "message":"2018-11-04T17:30:58.026053Z28173 Connect\tnpande@149.148.77.110 on NitinSampleDB using TCP/IP",
    "logStream":"auroramysql57dbcluster02",
    "logGroup":"/aws/rds/cluster/auroramysql57dbcluster02-cluster/general",
    "requestID":"18"
}
{"timestamp":1541352664176,"message":"# Time: 2018-11-04T17:31:04.176310Z\n# User@Host:
npande[npande] @  [149.148.77.110]  Id: 28173\n# Query_time: 0.000337  Lock_time: 0.000172 Rows_sent:
0  Rows_examined: 87\nSET timestamp=1541352664;\nUPDATE inventory SET quantity = quantity + 100 WHERE
quantity = 50;","logStream":"auroramysql57dbcluster02","logGroup":
"/aws/rds/cluster/auroramysql57dbcluster02-cluster/slowquery"}
Sample Queries
This section provides an example of a log query and metrics query taken from panels in a dashboard.
The following is a log query from the Failed Authentication - User Location panel of the Logs - Overview dashboard.
_sourceCategory=AWS/RDS/Aurora/MySQL/Error "[Note] Access denied for user"
| json "message"
| parse field=message " [*] " as LogLevel
| parse field=message " * [Note] Access denied for user '*'@'*' (using *: *)" as requestid, user,
host, authenticationType, flag
| count by host
| where host != "localhost"
| lookup latitude, longitude, country_code, country_name, region, city, postal_code from
geo://location on ip = host
The following is a metrics query from the CPU Credit Usage panel of the Metric - Resource Utilization Monitoring dashboard.
_sourceCategory=AWS/RDS/Metric Namespace=AWS/RDS  metric=CPUCreditUsage
DBInstanceIdentifier=* Statistic=Average | avg by DBInstanceIdentifier
Collecting Logs and Metrics for the Aurora MySQL ULM App
The Aurora MySQL ULM App includes predefined searches and dashboards that allow you to monitor logs and metrics for your Aurora MySQL database. The logs enable you to monitor database activity, user activity, incoming connections, query execution time, and errors. The metrics allow you to monitor database resource utilization and throughput performance.
The Aurora MySQL ULM is used for monitoring your database with CloudTrail event logs, and CloudWatch logs and metrics. The logs enable you to monitor database activity, user activity, incoming connections, query execution time, and errors. Metrics allow you to monitor database resource utilization and throughput performance. CloudTrail events allow you to monitor the use of Aurora services and operations by users.
This section provides instructions for collecting logs and metrics for ingest into Sumo Logic, and consists of the following steps:
Step 1: Plan your source categories
Before you configure log and metric sources for the Sumo Logic App for Aurora MySQL ULM, you must decide upon the source category to assign to each source. Taking a hierarchical approach allows you to make use of wildcards when performing searches, as shown in the following examples:
- For the AWS CloudTrail source for CloudTrail Events, you could specify a source category of AWS/CloudTrail
- For the AWS CloudWatch Metric source to collect cloudwatch metric, you could specify a source category of AWS/RDS/Metric.
- For the AWS CloudWatch Logs source to collect various Aurora MySQL cloudwatch logs (Error, SlowQuery, Audit and General), you could specify a source category of AWS/RDS/Aurora/MySQL/Error, AWS/RDS/Aurora/MySQL/SlowQuery, AWS/RDS/Aurora/MySQL/Audit, AWS/RDS/Aurora/MySQL/General
Step 2: Collect AWS CloudTrail events using AWS CloudTrail Source
This section provides instructions for setting up AWS CloudTrail Source to collect events for ingest into Sumo Logic.
To collect AWS CloudTrail events, do the following:
- Configure a Hosted Collector.
- Add an AWS CloudTrail Source to the Hosted Collector, providing the following information:
- Name - Enter a name to display for the new Source.
- Description - Enter an optional description.
- S3 Region - Select the Amazon Region for your CloudTrail Aurora S3 bucket.
- Bucket Name - Enter the exact name of your CloudTrail Aurora S3 bucket.
- Path Expression - Enter the string that matches the S3 objects you'd like to collect. You can use a wildcard (*) in this string. (DO NOT use a leading forward slash. See Amazon Path Expressions.)The S3 bucket name is not part of the path. Don’t include the bucket name when you are setting the Path Expression.
- Source Category - Enter a source category, for example, AWS/Cloudtrail.
- Access Key ID and Secret Access Key - Enter your Amazon Access Key ID and Secret Access Key.
- Scan Interval. Use the default of 5 minutes, or enter a time interval frequency at which Sumo Logic will scan your S3 bucket for new data.
- Enable Timestamp Parsing - Select the checkbox to enable.
- Time Zone - Deselect Ignore time zone from log file and instead select UTC.
- Timestamp Format - Select Automatically detect the format.
- Enable Multiline Processing - Select the checkbox to enable, and select Infer Boundaries.
- Click Save.
Step 3: Collect AWS CloudWatch logs for Aurora MySQL (Error, SlowQuery, Audit and General)
This section provides instructions for setting up the collection of AWS CloudWatch logs for ingest into Sumo Logic. To collect AWS CloudWatch logs, do the following:
- Follow the instructions for collecting Amazon CloudWatch logs. By default, Aurora MySQL Error Logs are enabled to be pushed to CloudWatch. However, you need to turn ON other log types, as explained in the following steps.
- While configuring the log forwarding with Lambda function to Sumo Logic, set log format as Others.
- Create a DB Parameters Group, if not done already.
- Enable the following:
- General log
- Slow Query log: Set the
long_query_time parameter, then enablelog_slow_admin_statements,log_slow_slave_statements, andlog_queries_not_using_indexes.
- Create a DB Cluster Parameter Group, if not done already.
- Enable the following audit logs:
- server_audit_logging
- server_audit_logs_upload
- Modify the cluster to specify the Cluster Parameter group on cluster level and the Parameter Group on instance level.
- Reboot the instances to make the changes effective.
Step 4: Collect Aurora CloudWatch metrics using AWS CloudWatch Metric Source
This section provides instructions setting up the collection of Aurora CloudWatch metrics using AWS CloudWatch Metric Source for ingest into Sumo Logic.
To collect Aurora CloudWatch metrics, do the following:
- Configure a Hosted Collector.
- Configure an Amazon CloudWatch Metrics Source, providing the following information:
- Name - Enter a name to display for the new Source.
- Description - Enter an optional description.
- Regions - Select your Amazon Regions for Amazon RDS.
- Namespaces - Select AWS/RDS.
- Source Category - Enter a source category, for example, AWS/RDS/Metric.
- Access Key ID and Secret Access Key - Enter your Amazon Access Key ID and Secret Access Key.
- Scan Interval - Accept the default of 5 minutes, or enter a time interval at which Sumo Logic will scan CloudWatch Sources for new data.
- Click Save.
Installing the Aurora MySQL ULM App
Now that you have set up log and metric collection for Amazon Aurora MySQL, you can install the Sumo Logic App for Aurora MySQL ULM, and use its pre-configured searches and dashboards.
To install the app, do the following:
Locate and install the app you need from the App Catalog. If you want to see a preview of the dashboards included with the app before installing, click Preview Dashboards.
- From the App Catalog, search for and select the app.
- Select the version of the service you're using and click Add to Library.
Version selection is applicable only to a few apps currently. For more information, see the Install the Apps from the Library. 3. To install the app, complete the following fields.
- App Name. You can retain the existing name, or enter a name of your choice for the app.
- Data Source. Select either of these options for the data source.
- Choose Source Category, and select a source category from the list.
- Choose Enter a Custom Data Filter, and enter a custom source category beginning with an underscore. Example: (
_sourceCategory=MyCategory).
- Advanced. Select the Location in Library (the default is the Personal folder in the library), or click New Folder to add a new folder.
- Click Add to Library.
Once an app is installed, it will appear in your Personal folder, or other folder that you specified. From here, you can share it with your organization.
Panels will start to fill automatically. It's important to note that each panel slowly fills with data matching the time range query and received since the panel was created. Results won't immediately be available, but with a bit of time, you'll see full graphs and maps.
Viewing Aurora MySQL ULM Dashboards
Each dashboard has a set of filters that you can apply to the entire dashboard, as shown in the following example. Click the funnel icon in the top dashboard menu bar to display a scrollable list of filters that narrow search results across the entire dashboard.
Each panel has a set of filters that are applied to the results for that panel only, as shown in the following example. Click the funnel icon in the top panel menu bar to display a list of panel-specific filters.
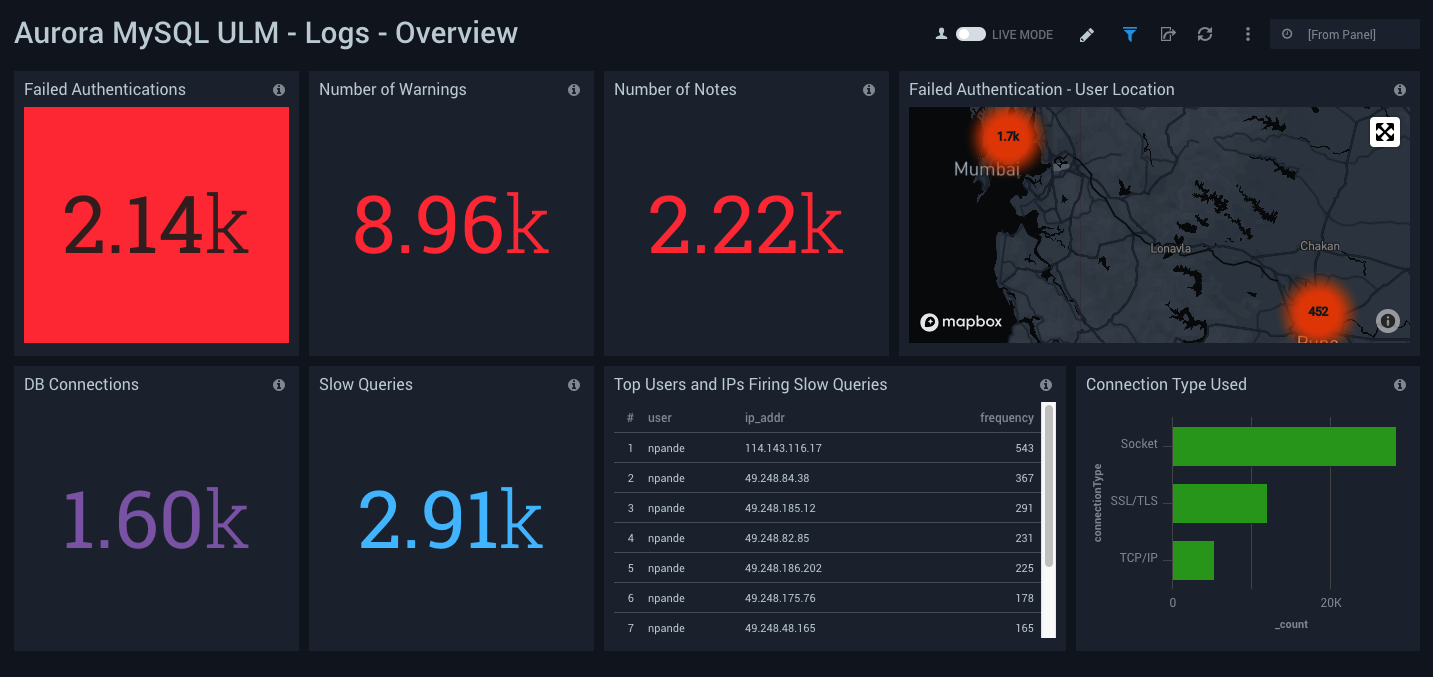
Logs - Overview
Aurora MySQL ULM Logs - Overview Dashboard allows you to view high-level overview of the following log types: Error, Slow Query, Audit and General.
Use this dashboard to:
- Identify Authentication Failures. You can drill down for granular data by clicking any of the first row panels to display the “Error Log” analysis dashboard.
- Identify the number of database connections. For more granular data, click the DB Connections panel to bring up the Audit Analysis dashboard.
- Identify the number of slow queries and the users and client hosts that are responsible for them. For more granular data, click the Slow Queries and Top Users and IPs Firing Slow Queries panels to bring up the Slow Query Log dashboard.
- Identify the breakdown of connection protocols. For more granular data, clicking the Connection Type Used panel to bring up the General Query Logs dashboard.
Logs - Error Logs Analysis
Aurora MySQL ULM Logs - Error Logs Analysis Dashboard allows you to view details for error logs, including failed authentications, error outliers, top and recent warnings, log levels, and aborted connections.
This dashboard utilizes Error Logs that have been ingested into Sumo Logic. Error Logs are by default enabled on Aurora MySQL.
Use this dashboard to:
- Track diagnostic messages, such as errors, warnings and notes to effectively troubleshoot a situation.
- Identify outliers for diagnostic events to discover if there is anomaly.
- Identify the reason for authentication failures for user, client, host, and client location being used to connect.
- Identify connection abort events.
- Monitor database instance start up, ready for connection events.

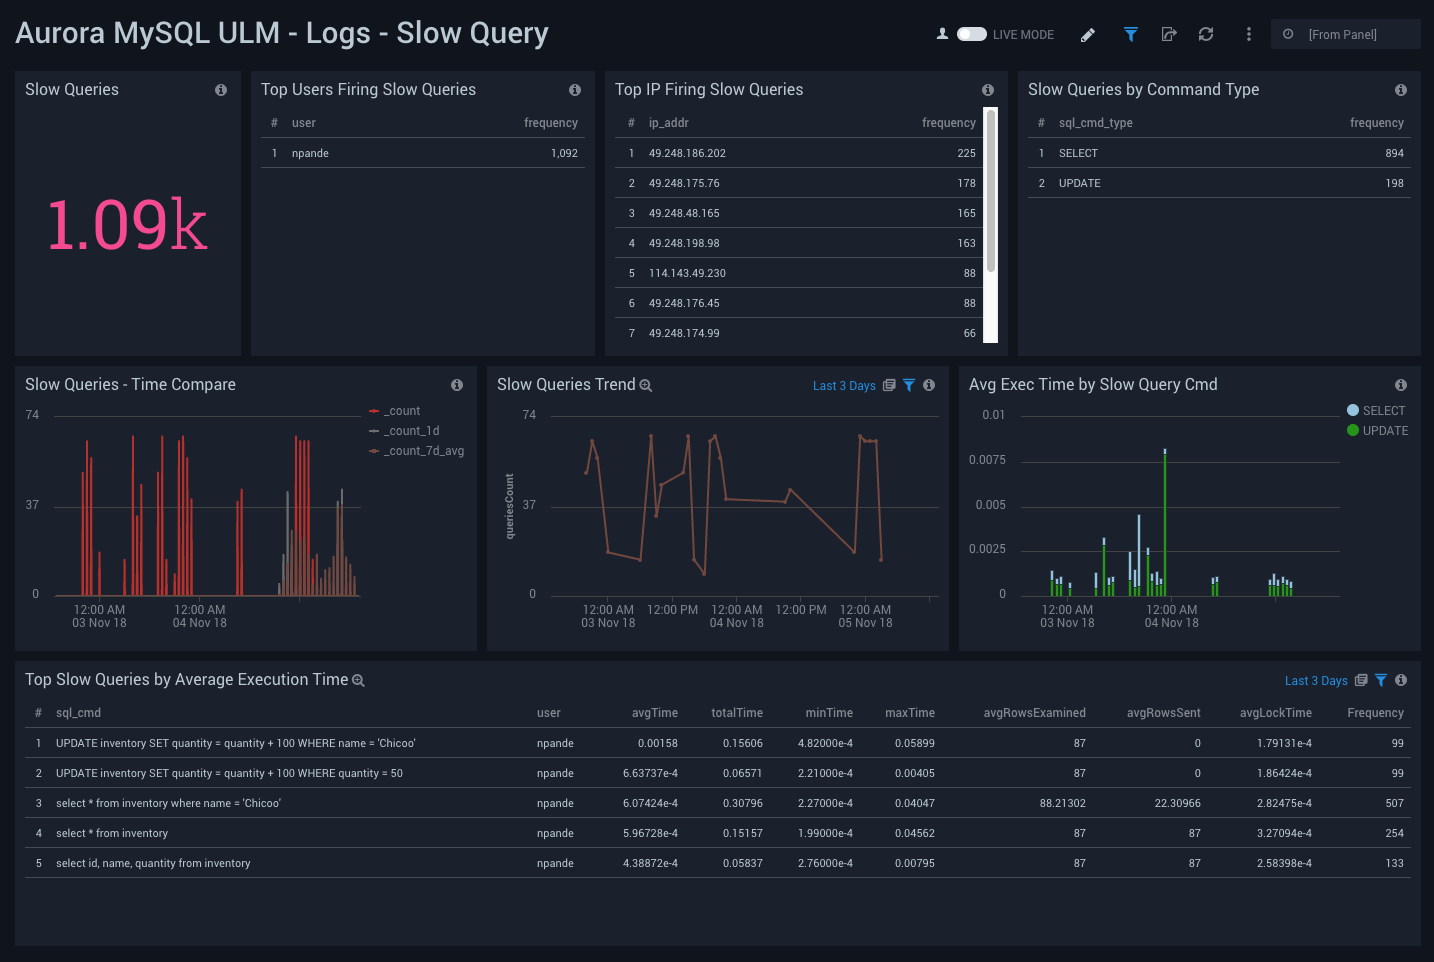
Logs - Slow Query
Aurora MySQL ULM Logs - Slow Query Dashboard allows you to view log details on slow queries, including the number of slow queries, trends, execution times, time comparisons, command types, users, and IP addresses.
This dashboard utilizes SlowQuery Logs that must be enabled and ingested into Sumo Logic.
Use this dashboard to:
- Identify queries that are taking longer to process than the time onfigured in DB Parameter Group.
- Identify queries used to search non-indexed columns, thus impacting performance.
- Identify candidate queries, for improvements based on frequency of execution, time it takes to execute, locking time, and other factors.
- Identify users responsible for slow queries, from the client IP address and type of command.
- Check if SQL SELECT type queries can be shifted to read replicas.
- Monitor trends of slow queries, comparing history to analyze the cause and troubleshoot a solution.
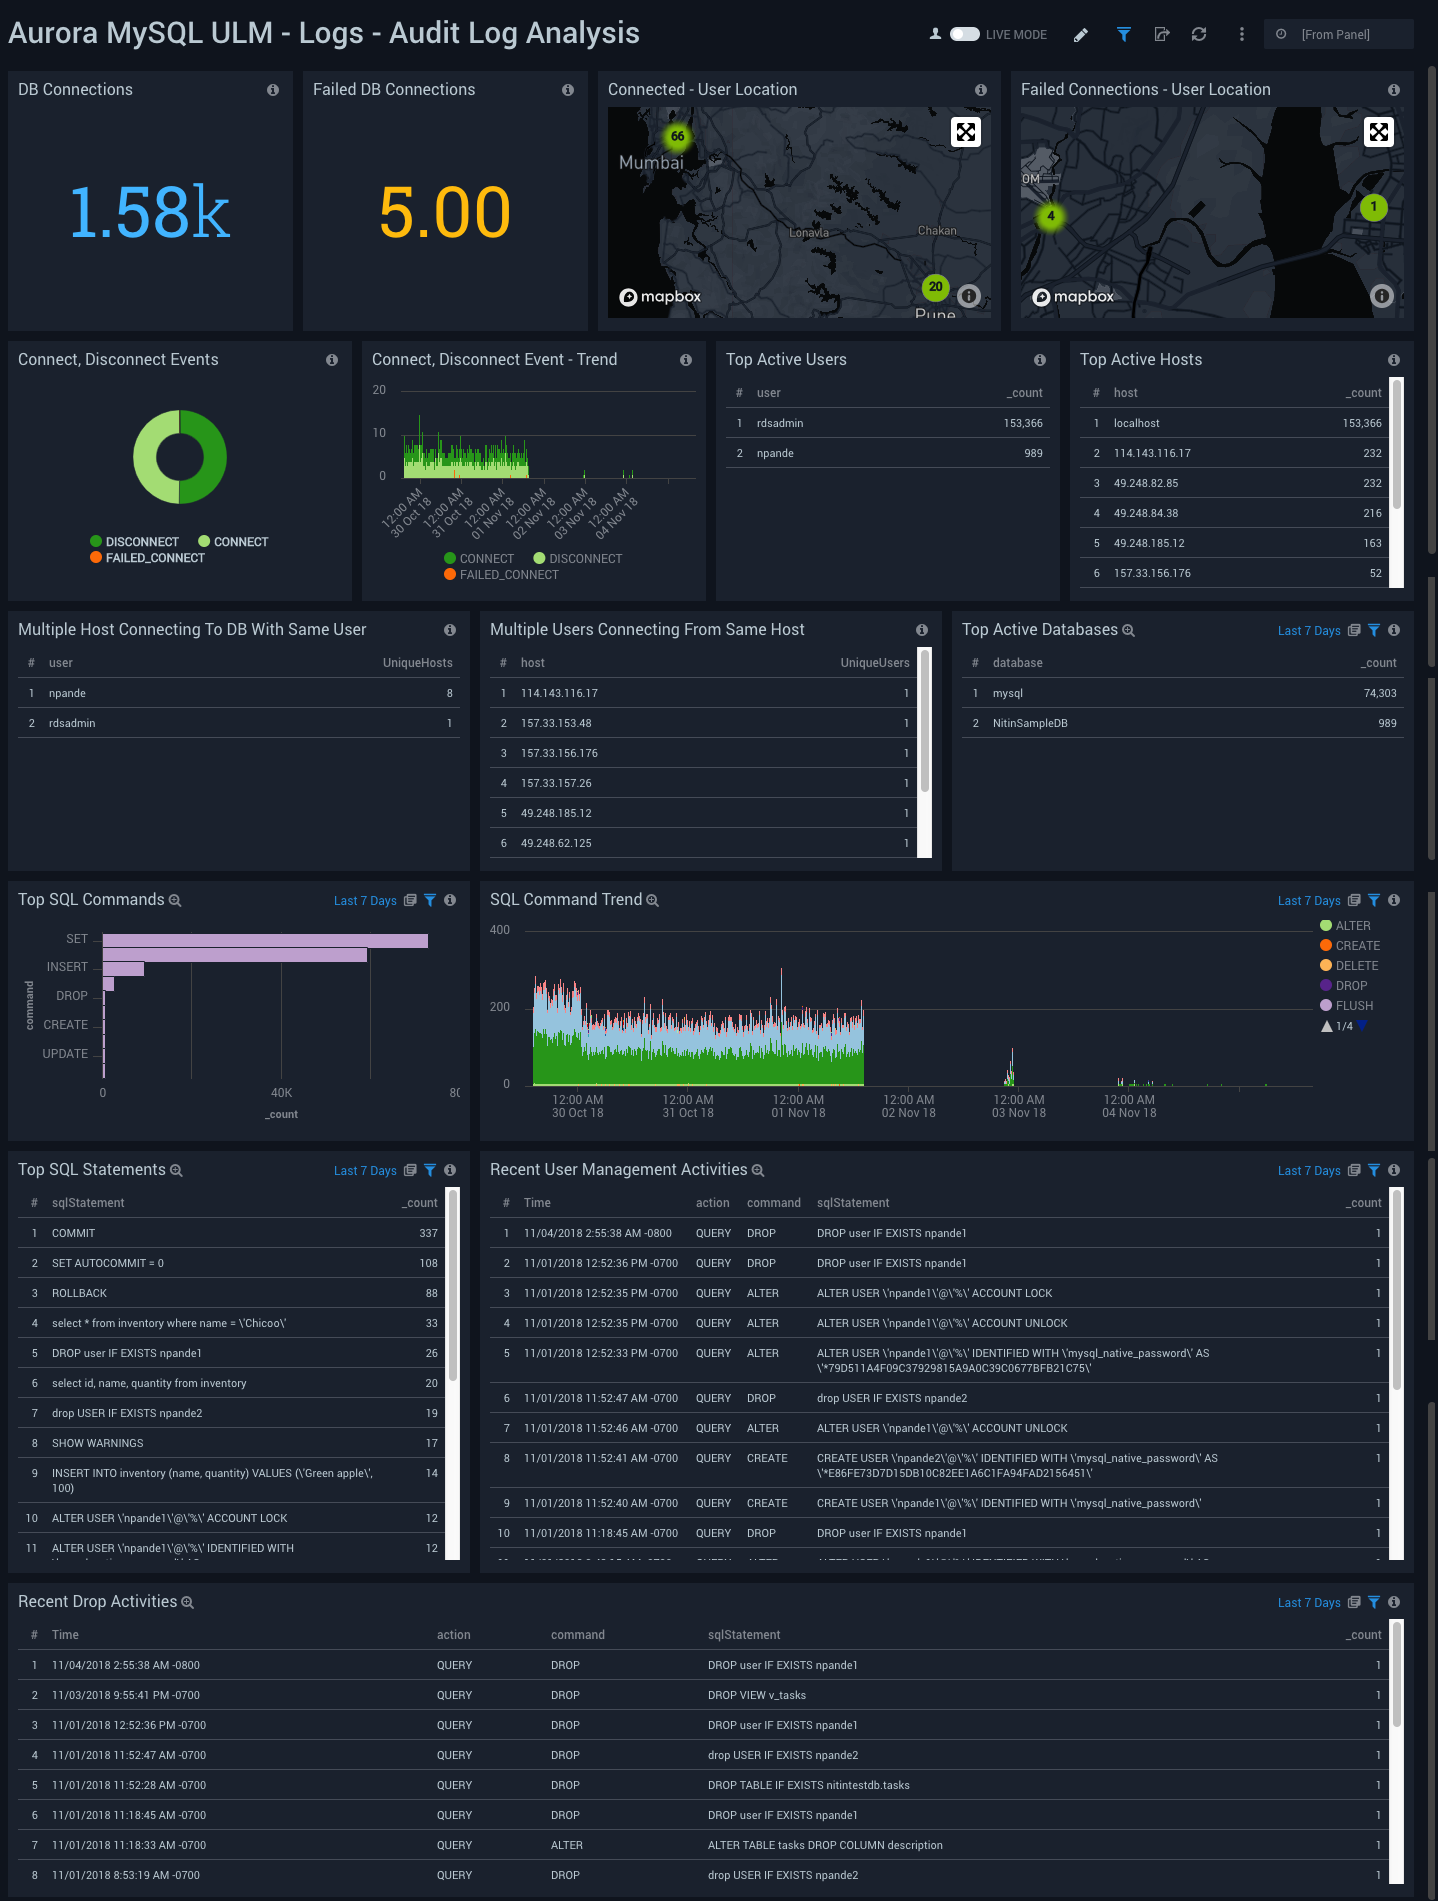
Logs - Audit Log Analysis
Aurora MySQL ULM Logs - Audit Log Analysis Dashboard allows you to view an analysis of events, including accessed resources, destination and source addresses, timestamps, and user login information. These logs are specifically enabled to audit activities that are of interest from an audit and compliance perspective.
This dashboard works on Audit Logs that must be turned on enabled to be uploaded to cloudwatch and ingest into Sumo.
Use this dashboard to:
- Identify successful and failed connections to the database with details about user, client IP address, location.
- Identify whether multiple hosts are connecting to DB with same user.
- Identify whether multiple users are connecting to DB from same host.
- Identify the most active users, client hosts, and databases.
- Get a high level overview of SQL statements and commands being executed.
- Identify user management related activities.
You can drill deeper into SQL Statements and or commands that are being executed by clicking “Top SQL Commands” panel. This opens “Aurora MySQL ULM - Logs - Audit Log SQL Statements” dashboard for further details.
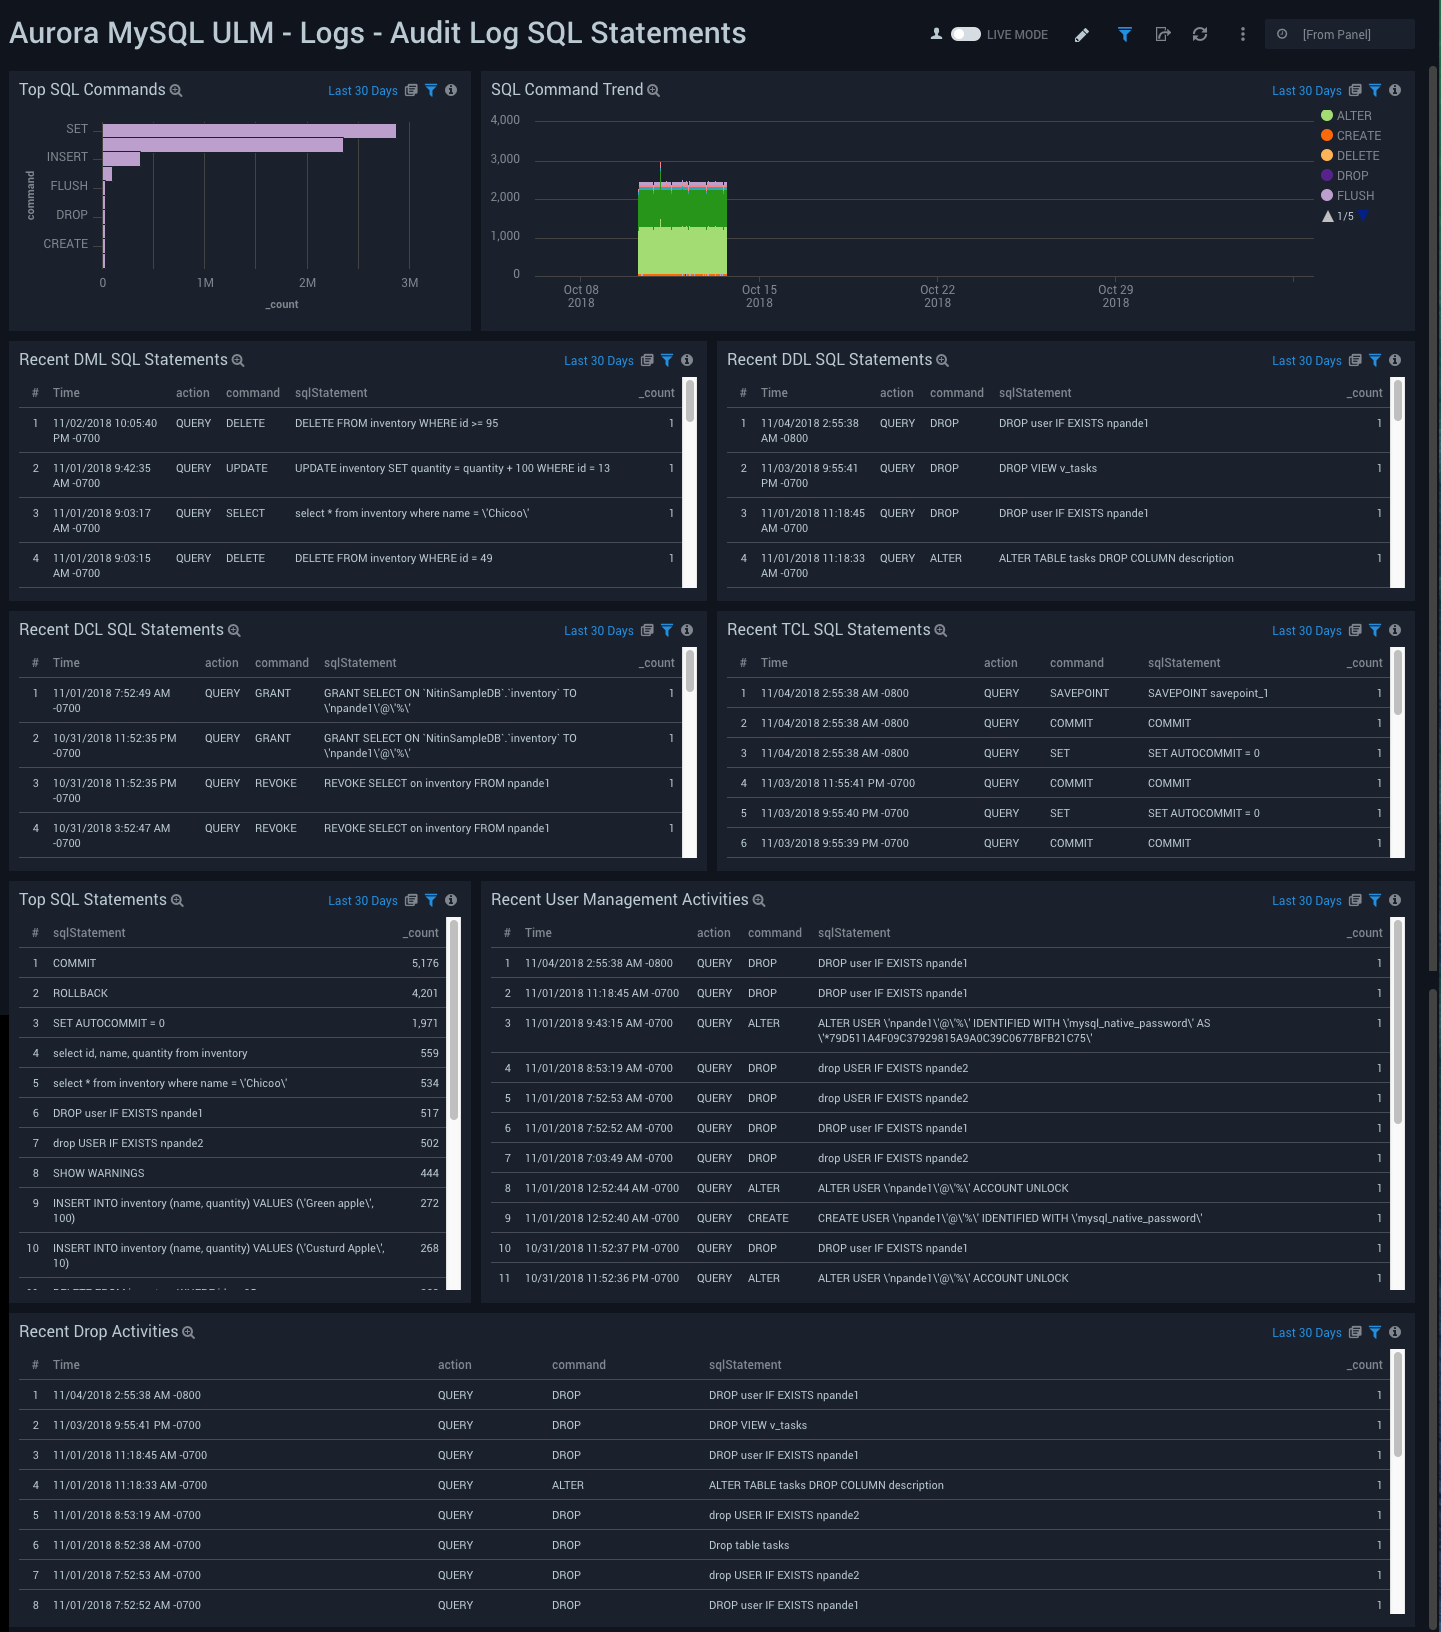
Logs - Audit Log SQL Statements
Aurora MySQL Logs - Audit Log SQL Statements Dashboard allows you to view details for SQL statement events, including Top SQL commands and statements, trends, user management, and activity for various types of SQL statements.
These logs are specifically enabled to audit activities that are of interest from an audit and compliance perspective.
This dashboard utilizes Audit Logs that must be turned on enabled to be uploaded to cloudwatch and ingested into Sumo logic.
Use this dashboard to:
- Identify top SQL statements, trends, and commands that are being executed.
- Get details on SQL statements and commands (DML, DDL, DCL, TCL) that are eing executed.
- Identify user management activities.
- Identify objects that have been dropped.
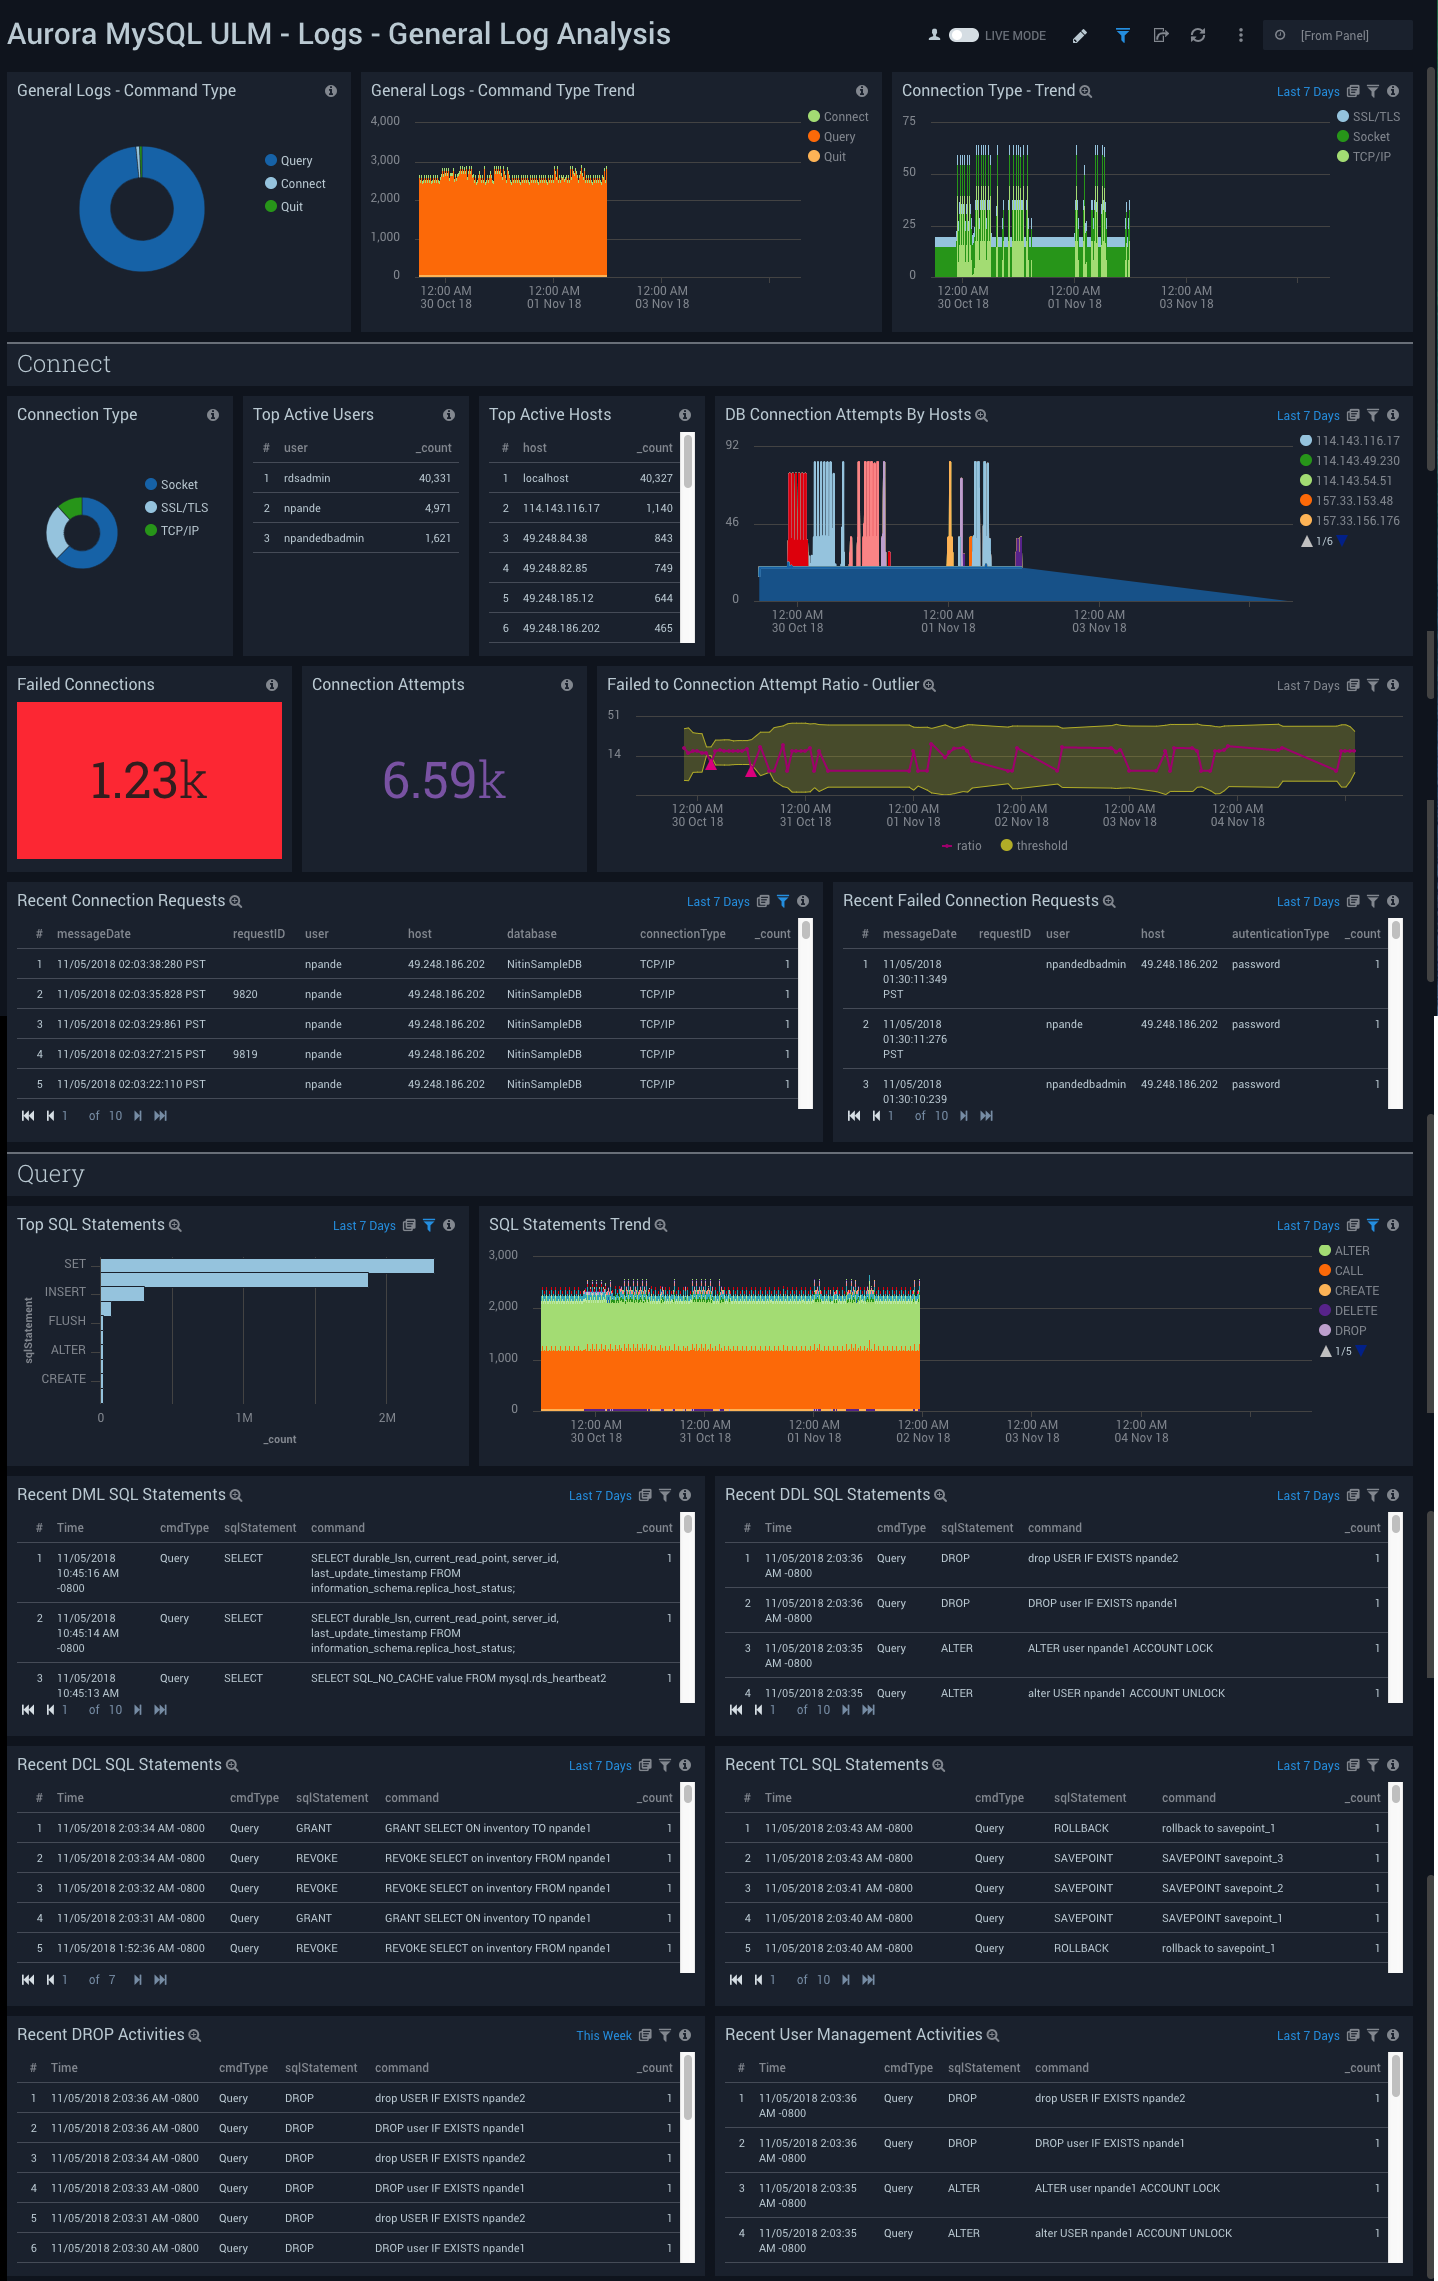
Logs - General Log Analysis
Aurora MySQL ULM Logs - General Log Analysis Dashboard allows you to view event details for general logs, including command types and trends, user activity and management, host activity, connections, and SQL statements.
This dashboard utilizes General Query logs that must to be enabled and ingested into Sumo Logic.
Use this dashboard to:
- Identify attempts at client connection and disconnection.
- Identify authentication failures, along with their reason, for user and client host being used to connect.
- Monitor failed authentication attempts along with total attempts to track anomalies.
- Monitor failures by checking the executables the clients sent to the server.
- Monitor the types of SQL statements and queries (DML, DDL, DCL, TCL, and others) that are sent by a client.
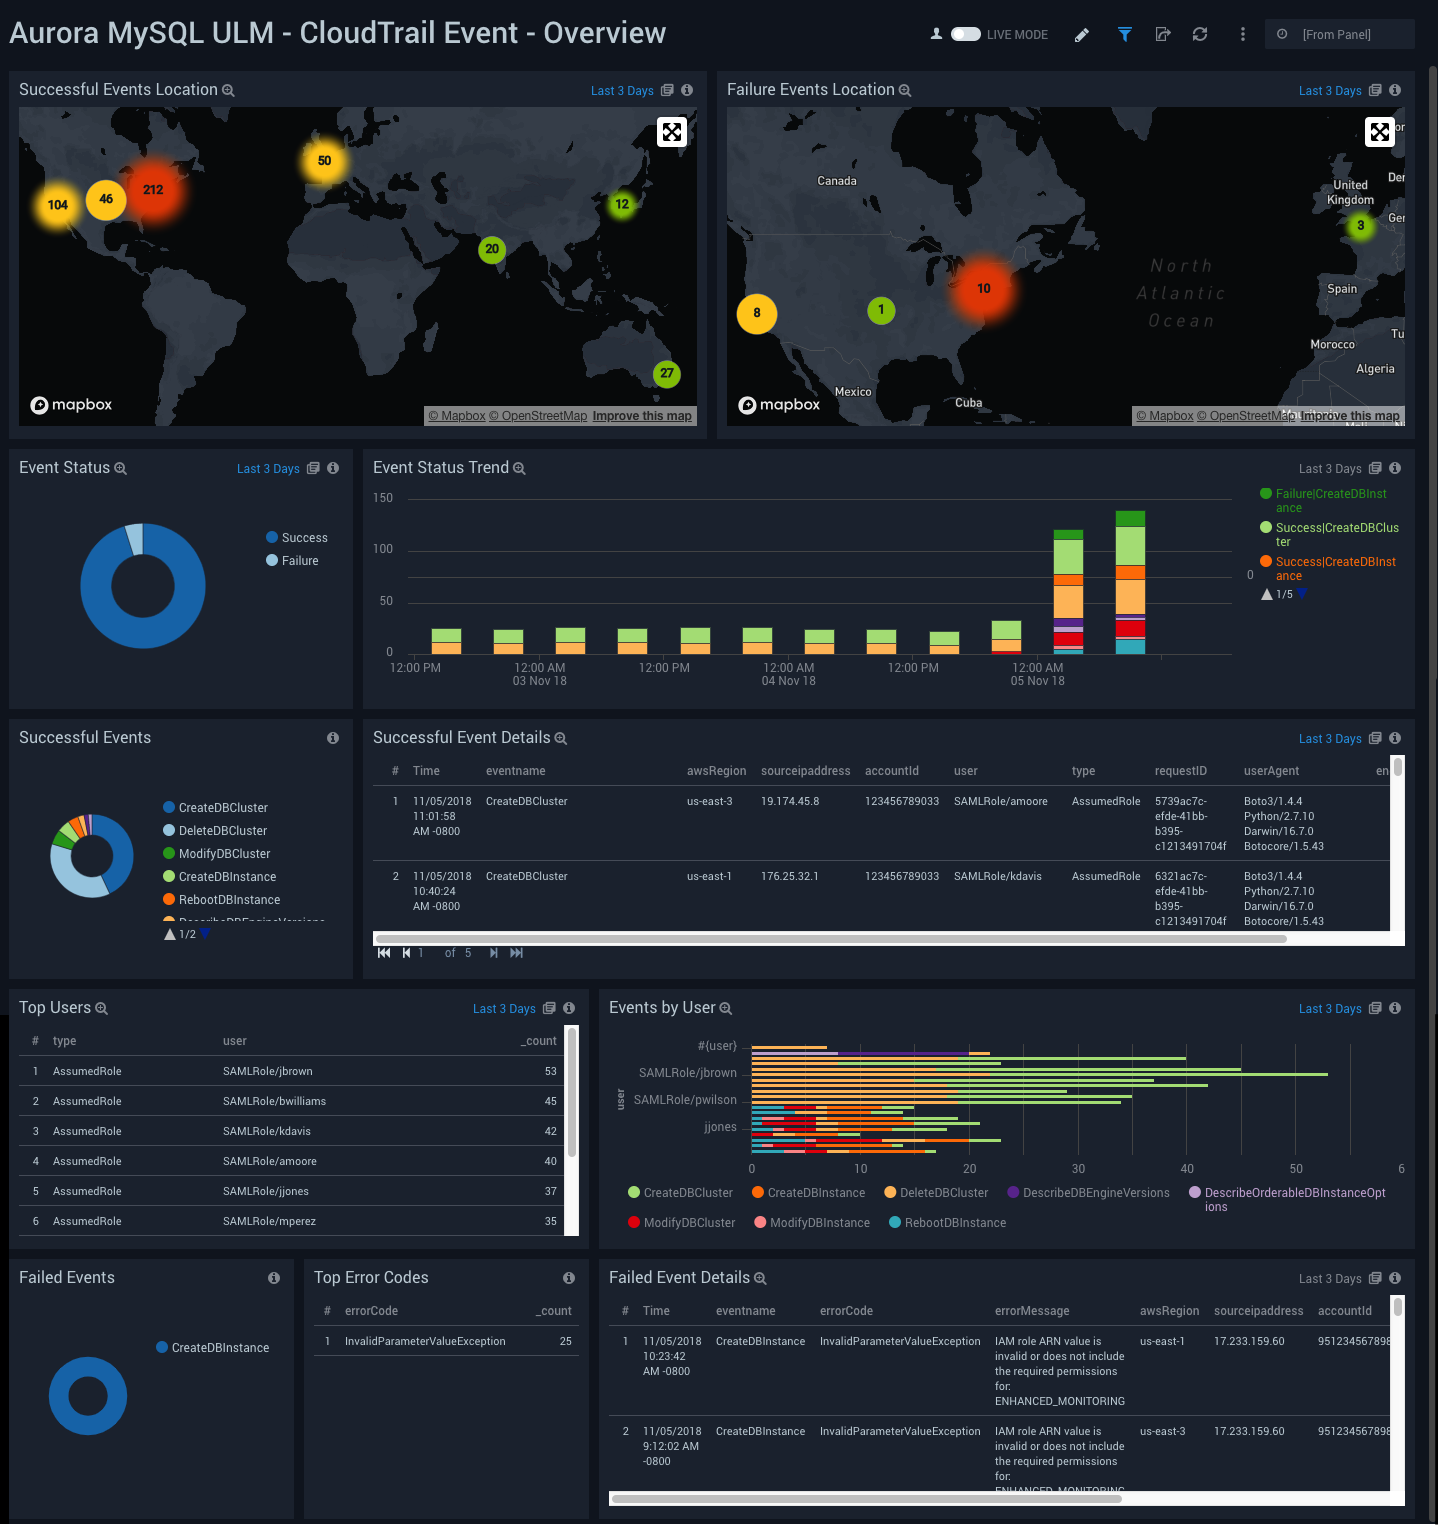
CloudTrail Event - Overview
Aurora MySQL ULM CloudTrail Event - Overview Dashboard allows you to view details for event logs, including geographical locations, trends, successful and failed events, user activity, and error codes.
Use this dashboard to get an at-a-glance overview of following:
- Locations of successful and failed activities to check whether they're within compliance.
- Event trends to identify if there is something different compared to typical patterns.
- Users and the type of authentication method used.
- Keep watch on reasons of failed activities to take corrective actions as the need be.
To drill down for details, click on “Event Status” panel to get details of events in linked dashboard “Aurora MySQL ULM - CloudTrail Event - Details”.
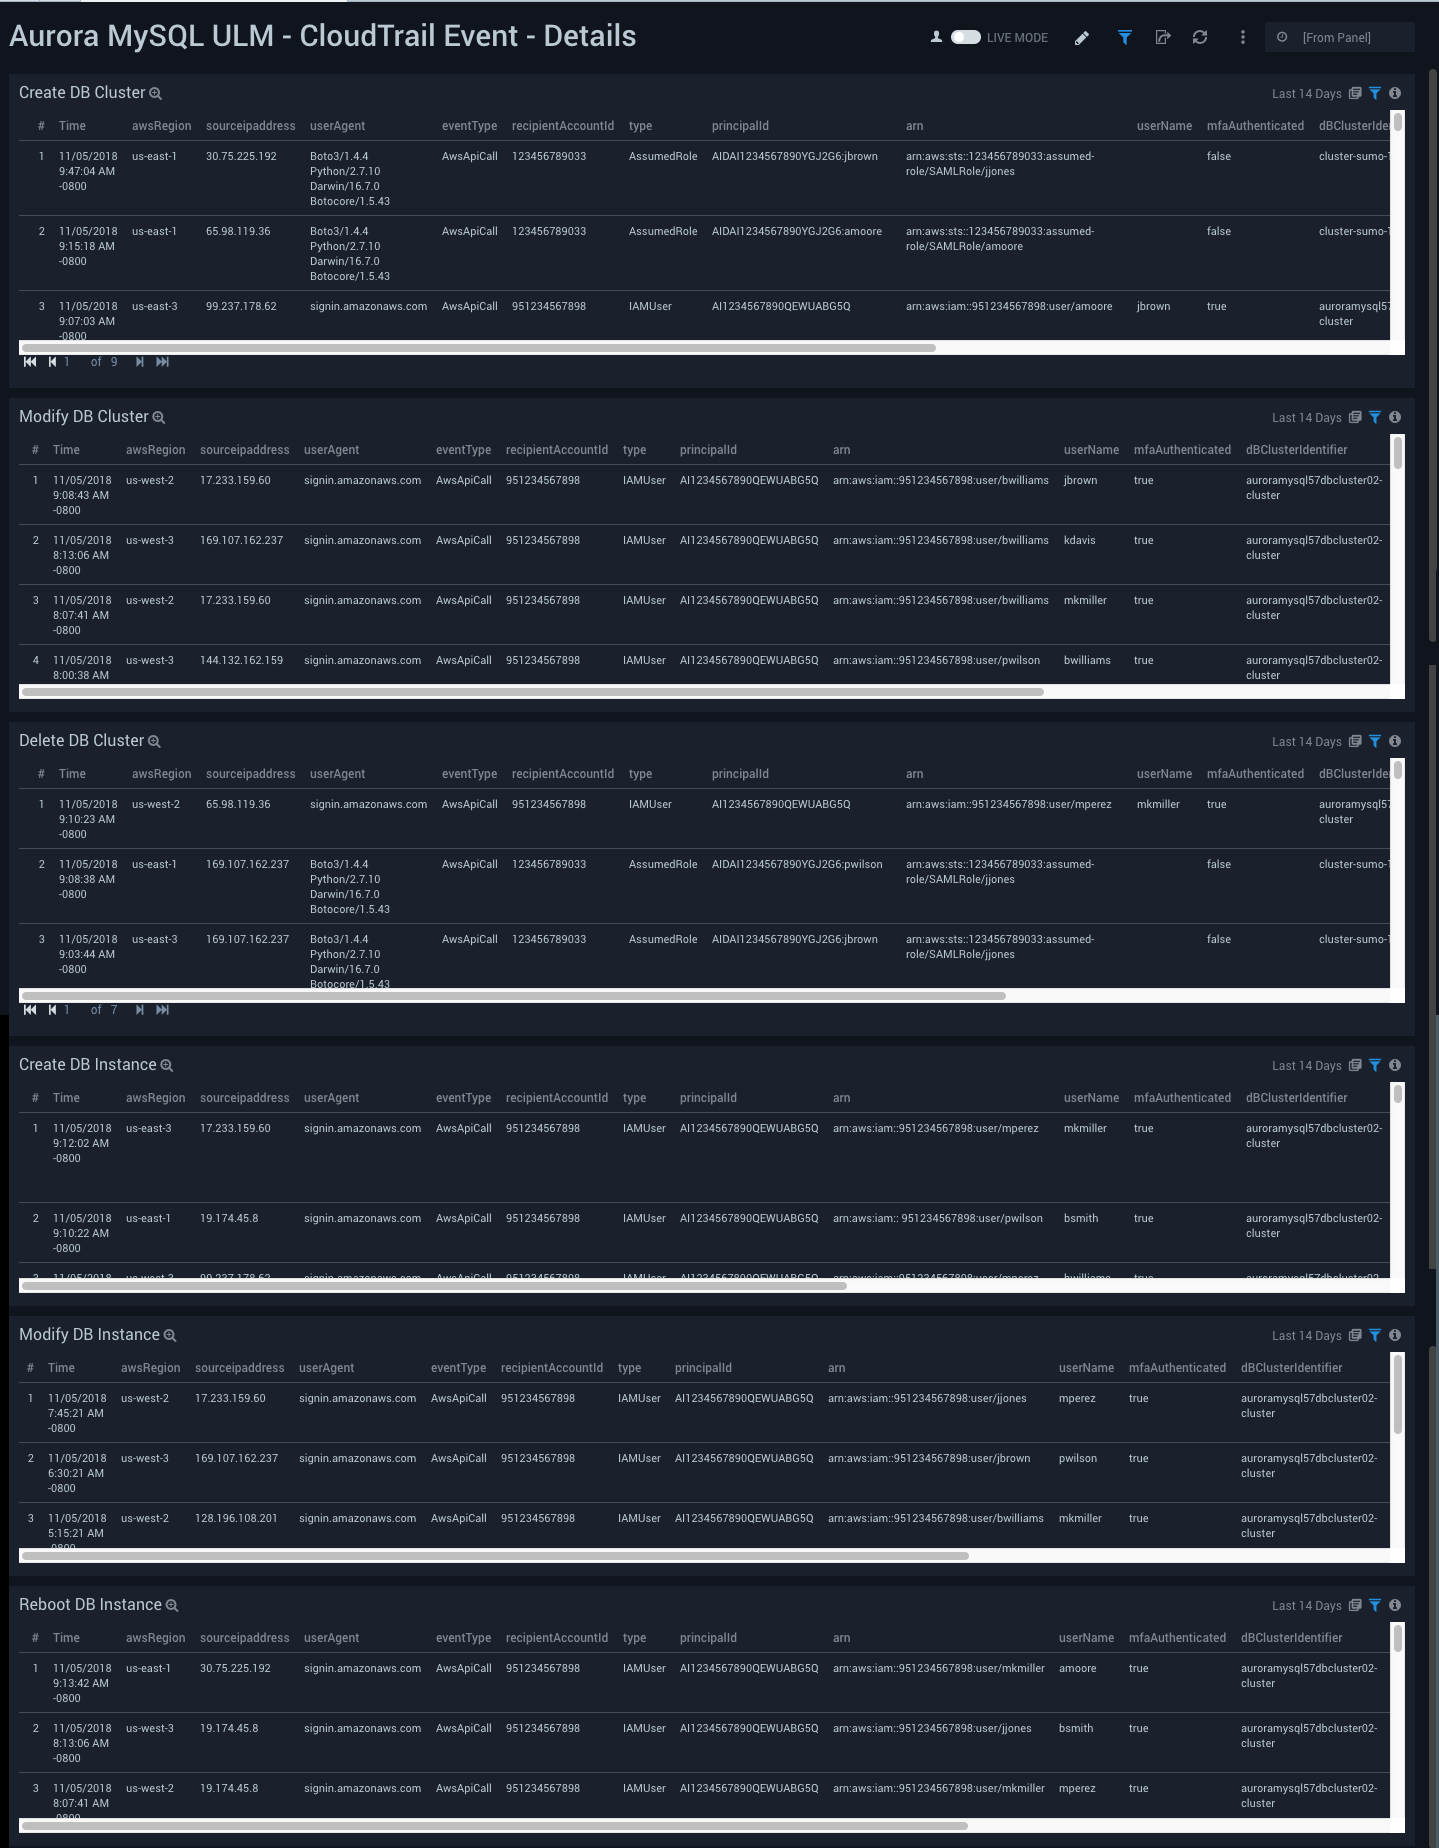
CloudTrail Event - Details
Aurora MySQL ULM CloudTrail Event - Details Dashboard allows you to view details for events, including creating, modifying, and deleting database clusters and database instances.
Use this dashboard to keep track of your Aurora MySQL Clusters and Instances. This dashboard provides details about various cluster and instance related activities, such as creation, modification, deletion and reboot of instances. Improper configuration of clusters and instances may have an adverse impact on performance. This dashboard helps to identify these issues from the details of the Aurora MySQL-specific events, so you can effectively remedy the situation.
Metric - Overview
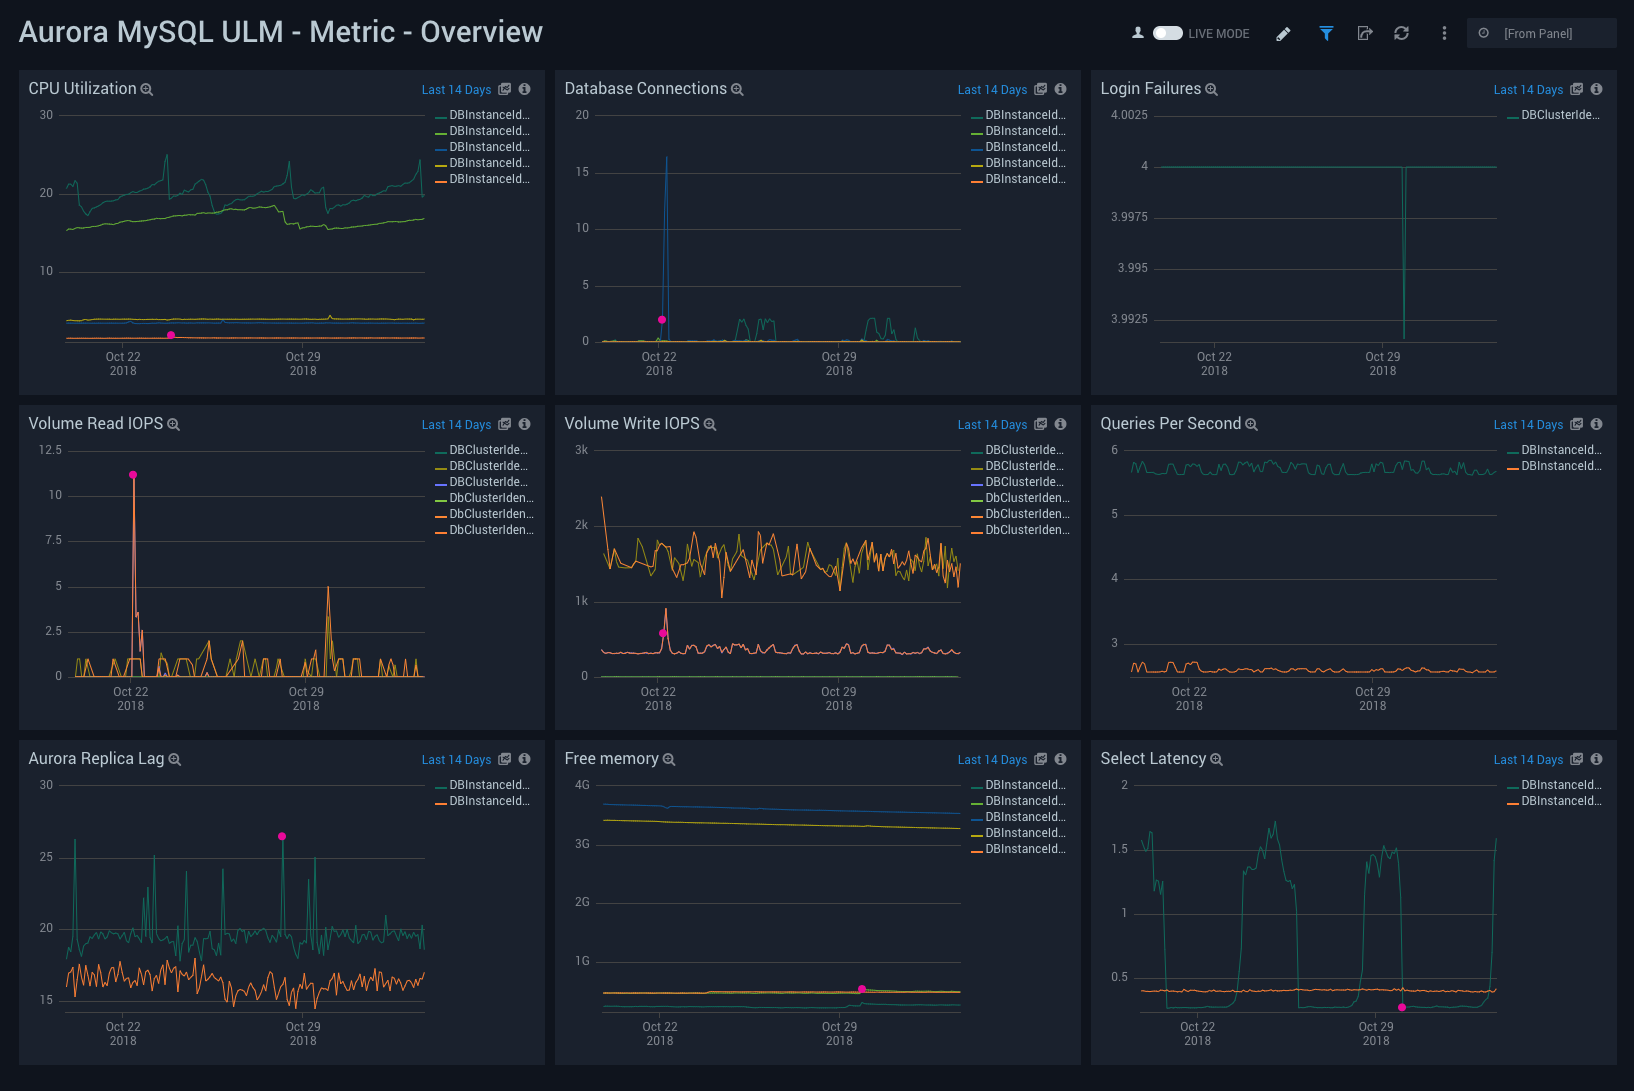
Aurora MySQL ULM Metric - Overview Dashboard allows you to view high-level analysis of Aurora MySQL database CPU utilization, connections, login failures, IOPS, latency, and memory usage.
This dashboard utilizes CloudWatch RDS Metrics for Aurora.
Use this dashboard to:
- Monitor the number of connections any given time, how many queries are executed per second, and CPU utilization.
- Monitor the Volume Read/Write IOPS to ensure the database is optimally interacting with disk.
- Monitor replica lags, and select latency and free memory to ensure it can support heavy read loads with sustained performance.
- Detect failed login and connection attempts.
Metric - Generic
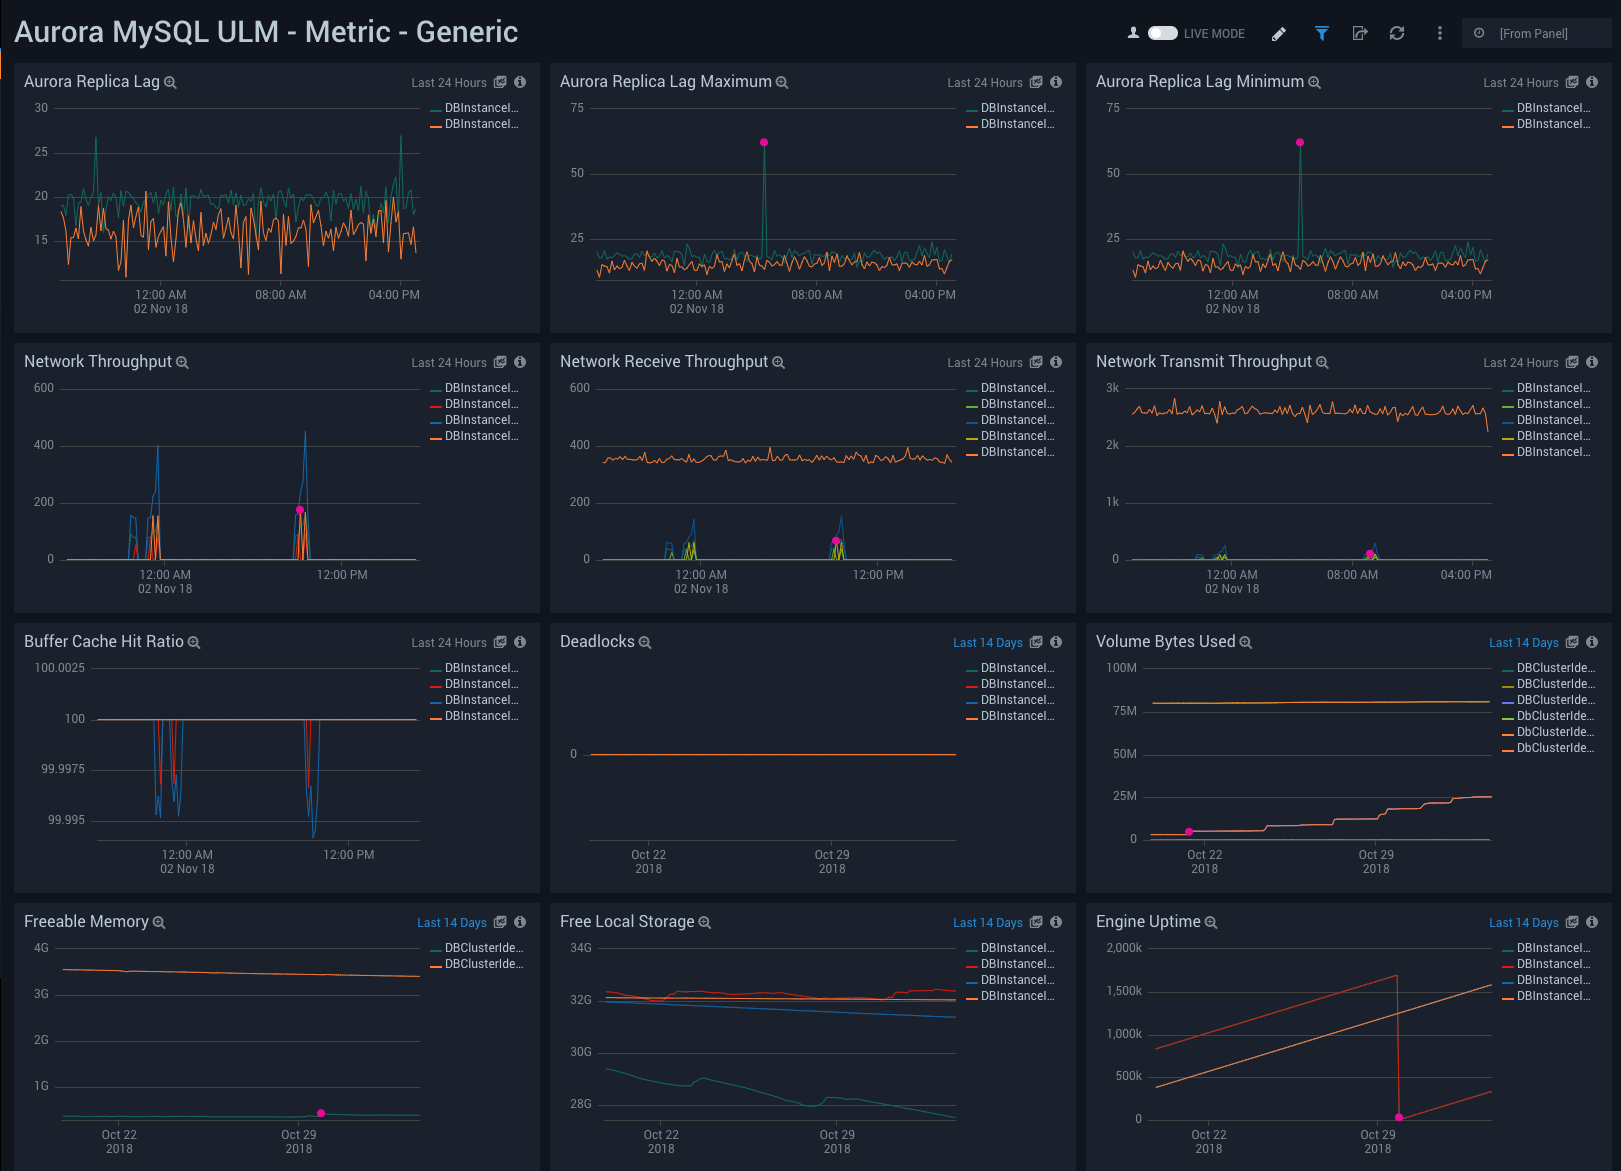
Aurora MySQL ULM Metric - Generic Dashboard allows you to view a high-level analysis of database latency, throughput, uptime, memory and storage capacity.
This dashboard utilizes CloudWatch RDS Metrics for Aurora.
Use this dashboard to:
- Monitor replica lags for applications with heavy read activity loads. Aurora supports read replicas with extremely low replica lags.
- Monitor network traffic load and usage. In general, RDS supports monitoring its Network throughput.
- Monitor cache hit ratio, to analyze free memory from a query performance perspective.
- Identify deadlocks, volume used in bytes, to analyze free local storage and engine uptime.
Metric - Latency, Throughput, and IOPS Monitoring
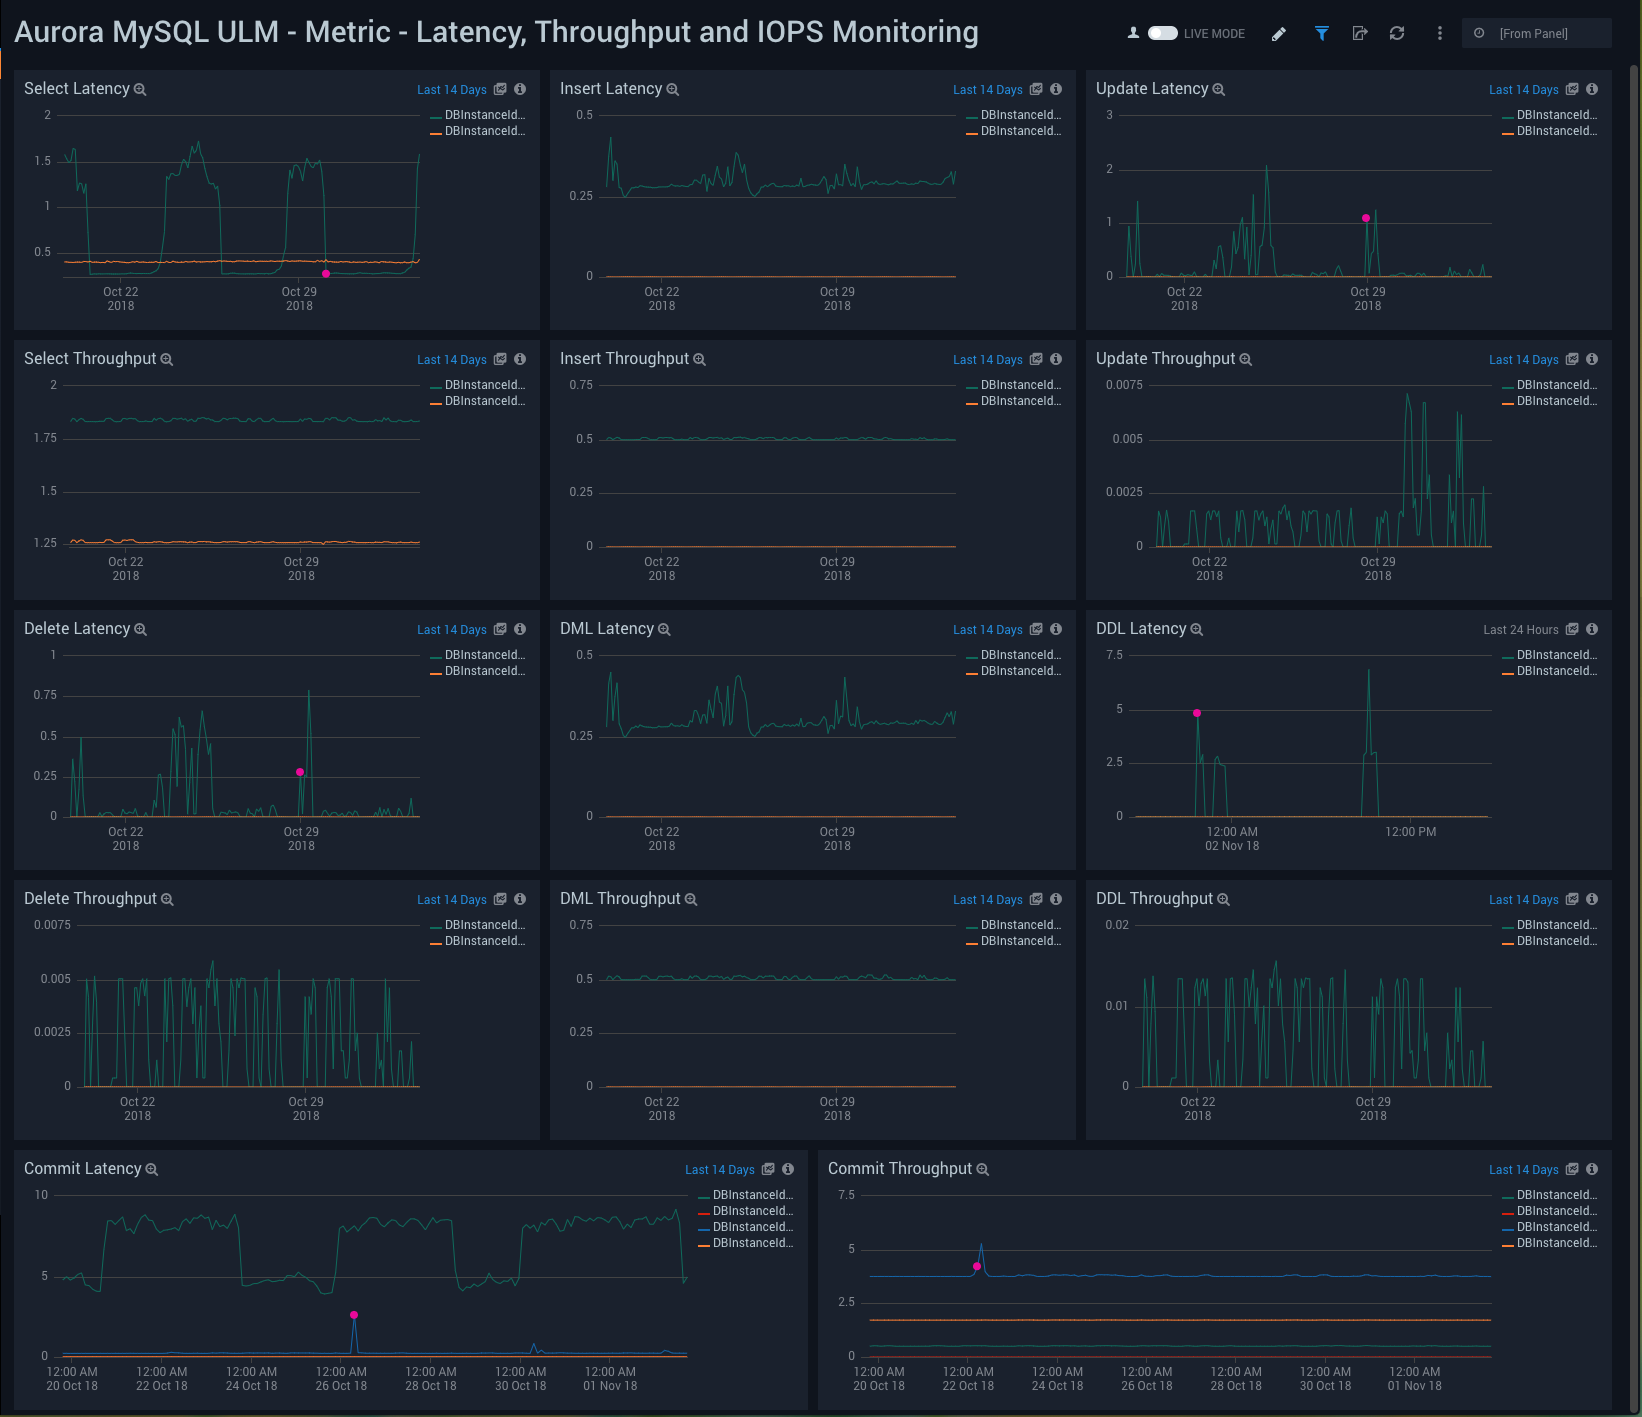
Aurora MySQL ULM Metric - Latency, Throughput, and IOPS Monitoring Dashboard allows you to view granular details on database latency, throughput, and IOPS.
This dashboard utilizes CloudWatch RDS Metrics for Aurora.
Use this dashboard to:
- Monitor the performance of database queries.
- Monitor latency and throughput for performance analysis.
- Monitor, select, insert, update, delete, commit, DML and DDL latency and throughput.
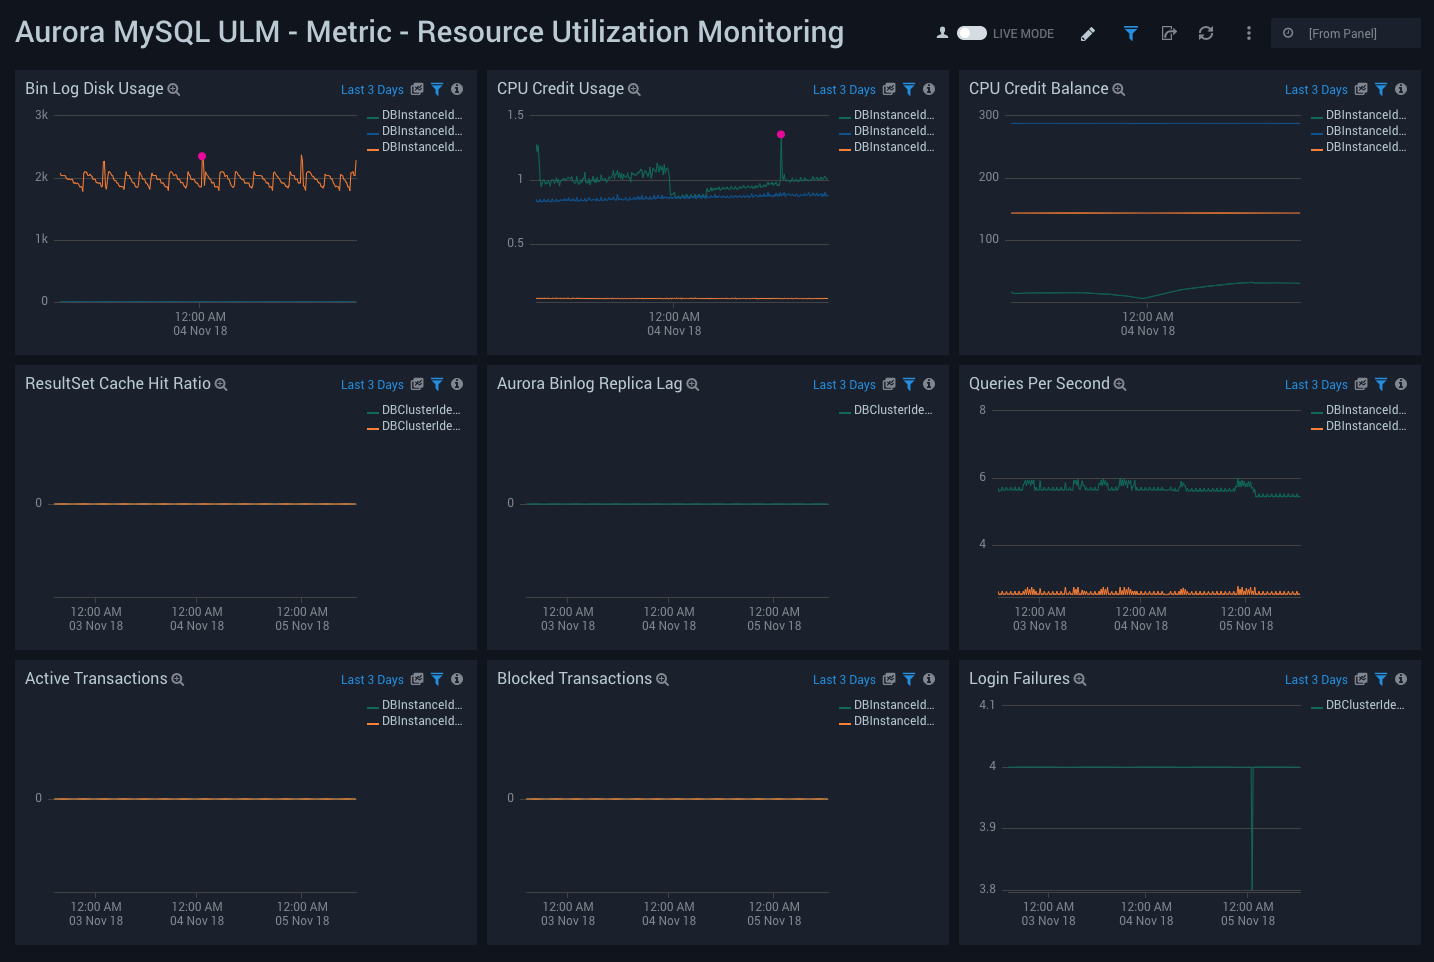
Metric - Resource Utilization Monitoring
Aurora MySQL ULM Metric - Resource Utilization Monitoring Dashboard allows you to view analysis of resource utilization, including usage, latency, active and blocked transactions, and login failures.
This dashboard utilizes CloudWatch RDS Metrics for Aurora.
Use this dashboard to:
- Monitor CPU Credit Usage/Balance, as well as disk usage for bin logs,
- Identify active and blocked transactions.
- Monitor bin og replica lag.
- Monitor Result Set Cache Hit Ratio from a performance perspective.
