Amazon Aurora PostgreSQL ULM

The Sumo Logic App for Aurora PostgreSQL uses unified logs and metrics (ULM) to monitor your Aurora PostgreSQL database. The app allows you to monitor the number of connections made, CPU utilization, free memory, network utilization, volume read / write IOPS, disk queue depth, replica lags, latency, throughput and other resource utilization details. With Cloudtrail Logs, the app allows you to identify user, client host and client locations being used to configure Aurora PostgreSQL infrastructure.
The Sumo Logic App for Aurora PostgreSQL ULM includes predefined searches and dashboards that allow you to monitor logs and metrics for the database. The logs enable you to monitor database activity, user activity, incoming connections, query execution time, and errors. The metrics allow you to monitor database resource utilization and throughput performance.
Amazon Aurora PostgreSQL is a relational database service built for the cloud. For more information, see the Amazon Aurora PostgreSQL
This guide provides an overview of the Aurora PostgreSQL ULM App pre-defined queries and dashboards, as well as instructions for collecting logs and metrics from Aurora PostgreSQL, and installing the App.
Log and Metric types
The Sumo Logic App for Aurora PostgreSQL ULM uses the following logs and metrics:
Below are example logs and metrics collected from your Aurora PostgreSQL database as well as example queries.
Sample Log
Click to expand. The following is an example of an AWS Cloud Trail log.
{
    "eventVersion":"1.05",
    "userIdentity":{
        "type":"IAMUser",
        "principalId":"AI1234567890QEWUABG5Q",
        "arn":"arn:aws:iam::951234567898:user/bwilliams",
        "accountId":"951234567898",
        "accessKeyId":"ABCDEFGHIHFBOT4FDVK",
        "userName":"jjones",
        "sessionContext":{
            "attributes":{
                "mfaAuthenticated":"true",
                "creationDate":"2018-11-05T11:22:45Z"
            }
        },
        "invokedBy":"signin.amazonaws.com"
    },
    "eventTime":"2018-11-12T06:56:02Z",
    "eventSource":"rds.amazonaws.com",
    "eventName":"DeleteDBCluster",
    "awsRegion":"us-east-3",
    "sourceIPAddress":"19.174.45.8",
    "userAgent":"signin.amazonaws.com",
    "requestParameters":{
        "dBClusterIdentifier":"nitinpsql968cluster01",
        "skipFinalSnapshot":false,
        "finalDBSnapshotIdentifier":"psqldb968nitin02-final-snapshot"
    },
    "responseElements":{
        "allocatedStorage":1,
        "availabilityZones":[
            "us-east-1a",
            "us-east-1b",
            "us-east-1c"
        ],
        "backupRetentionPeriod":2,
        "databaseName":"nitintestdpsql1",
        "dBClusterIdentifier":"nitinpsql968cluster01",
        "dBClusterParameterGroup":"default.aurora-postgresql9.6",
        "dBSubnetGroup":"default-vpc-b81fc4d7",
        "status":"available",
        "earliestRestorableTime":"Nov 5, 2018 2:17:31 PM",
        "endpoint":"nitinpsql968cluster01.cluster-ci123456789d.us-east-3.rds.amazonaws.com",
        "readerEndpoint":"nitinpsql968cluster01.cluster-ro-ci123456789d.us-east-1.rds.amazonaws.com",
        "multiAZ":false,
        "engine":"aurora-postgresql",
        "engineVersion":"9.6.8",
        "latestRestorableTime":"Nov 5, 2018 3:36:06 PM",
        "port":5432,
        "masterUsername":"npandepsql",
        "preferredBackupWindow":"08:59-09:29",
        "preferredMaintenanceWindow":"sun:08:09-sun:08:39",
        "readReplicaIdentifiers":[

        ],
        "dBClusterMembers":[
            {
                "dBInstanceIdentifier":"psqldb968nitin02",
                "isClusterWriter":true,
                "dBClusterParameterGroupStatus":"in-sync",
                "promotionTier":1
            }
        ],
        "vpcSecurityGroups":[
            {
                "vpcSecurityGroupId":"sg-0e81530fe36e37076",
                "status":"active"
            }
        ],
        "hostedZoneId":"Z2R2ITUGPM61AM",
        "storageEncrypted":true,
        "kmsKeyId":"arn:aws:kms:us-west-3:951234567898:key/9a3d8016-4cdb-478f-a3a4-9a310fc25307",
        "dbClusterResourceId":"cluster-LXLBREEIXOAMLSUUDXVKXFVIDA",
        "dBClusterArn":"arn:aws:rds:us-west-2:951234567898:cluster:nitinpsql968cluster01",
        "associatedRoles":[

        ],
        "iAMDatabaseAuthenticationEnabled":false,
        "clusterCreateTime":"Nov 5, 2018 2:16:12 PM",
        "engineMode":"provisioned",
        "deletionProtection":false,
        "httpEndpointEnabled":false
    },
    "requestID":"0df6f69d-8040-45fa-9171-98043977a14c",
    "eventID":"ab48927c-7bd8-4c1d-9d86-0b2f6732949c",
    "eventType":"AwsApiCall",
    "recipientAccountId":"951234567898"
}
Sample Log Query
The following log query is from the Event Status Trend panel of the CloudTrail Event - Overview dashboard.
(_sourceCategory=*cloudtrail* or _sourceCategory=*AWS_EAGLE*) "\"eventSource\":\"rds.amazonaws.com\"" ("\"engine\":\"aurora-postgresql\"")
| json "userIdentity", "eventSource", "eventName", "awsRegion", "sourceIPAddress", "userAgent", "eventType", "recipientAccountId", "requestParameters", "responseElements", "requestID", "errorCode", "errorMessage" nodrop
| json field=userIdentity "type", "principalId", "arn", "userName", "accountId" nodrop
| json field=userIdentity "sessionContext.attributes.mfaAuthenticated" as mfaAuthenticated nodrop
| json field=requestParameters "dBClusterIdentifier", "engine", "engineMode" as req_dBClusterIdentifier, req_engine, req_engineMode nodrop
| json field=responseElements "dBClusterIdentifier", "engine", "engineMode" as res_dBClusterIdentifier, res_engine, res_engineMode nodrop
| parse field=arn ":assumed-role/*" as user nodrop
| parse field=arn "arn:aws:iam::*:*" as accountId, user nodrop
| if (isEmpty(errorCode), "Success", "Failure") as eventStatus
| if (isEmpty(userName), user, userName) as user
| if (isEmpty(req_dBClusterIdentifier), res_dBClusterIdentifier, req_dBClusterIdentifier) as dBClusterIdentifier
| if (isEmpty(req_engine), res_engine, req_engine) as engine
| if (isEmpty(req_engineMode), res_engineMode, req_engineMode) as engineMode
| where eventSource = "rds.amazonaws.com" and (req_engine in ("aurora-postgresql") or res_engine in ("aurora-postgresql"))
| timeslice 6h
| count by _timeslice, eventStatus, eventName
| transpose row _timeslice column eventStatus, eventName
Sample Metrics Query
The following metrics query is from the Volume Write IOPS panel of the Metric - Overview dashboard.
_sourceCategory=AWS/RDS/Metric Namespace=AWS/RDS \
metric=VolumeWriteIOPs DBClusterIdentifier=* Statistic=Average \
| avg by DBClusterIdentifier
Collecting Logs and Metrics for the Aurora PostgreSQL ULM App
The Aurora PostgreSQL ULM App includes predefined searches and dashboards that allow you to monitor logs and metrics for your Aurora MySQL database. The logs enable you to monitor database activity, user activity, incoming connections, query execution time, and errors. The metrics allow you to monitor database resource utilization and throughput performance.
The Aurora PostgreSQL ULM App is used for monitoring CloudTrail event Logs and CloudWatch Metrics. Metrics allow you to monitor database resource utilization and throughput performance. CloudTrail events help you monitor use of Aurora services and operations by users.
This section provides instruction for collecting logs and metrics for the Sumo Logic App for Aurora PostgreSQL ULM.
Step 1: Collecting AWS CloudTrail events using AWS CloudTrail Source
This section provides instructions for setting up AWS CloudTrail Source to collect events for ingest into Sumo Logic.
To collect AWS CloudTrail events, do the following:
- Configure a Hosted Collector.
- Add an AWS CloudTrail Source to the Hosted Collector, providing the following information:
- Name - Enter a name to display for the new Source.
- Description - Enter an optional description.
- S3 Region - Select the Amazon Region for your CloudTrail Aurora S3 bucket.
- Bucket Name - Enter the exact name of your CloudTrail Aurora S3 bucket.
- Path Expression - Enter the string that matches the S3 objects you'd like to collect. You can use a wildcard (
*) in this string. DO NOT use a leading forward slash; see Amazon Path Expressions) The S3 bucket name is not part of the path. Don’t include the bucket name when you are setting the Path Expression. - Source Category - Enter a source category, for example, AWS/Cloudtrail.
- Access Key ID and Secret Access Key - Enter your Amazon Access Key ID and Secret Access Key.
- Scan Interval. Use the default of 5 minutes, or enter a time interval frequency at which Sumo Logic will scan your S3 bucket for new data.
- Enable Timestamp Parsing - Select the checkbox to enable.
- Time Zone - Deselect Ignore time zone from log file and instead select UTC.
- Timestamp Format - Select Automatically detect the format.
- Enable Multiline Processing - Select the checkbox to enable, and select Infer Boundaries.
- Click Save.
Step 2: Collecting Aurora CloudWatch metrics using AWS CloudWatch Metric Source
This section provides instructions setting up the collection of Aurora CloudWatch metrics using AWS CloudWatch Metric Source for ingest into Sumo Logic.
To collect Aurora CloudWatch metrics, do the following:
- Configure a Hosted Collector.
- Configure an Amazon CloudWatch Metrics Source, providing the following information:
- Name - Enter a name to display for the new Source.
- Description - Enter an optional description.
- Regions - Select your Amazon Regions for Amazon RDS.
- Namespaces - Select AWS/RDS.
- Source Category - Enter a source category, for example, AWS/RDS/Metric.
- Access Key ID and Secret Access Key - Enter your Amazon Access Key ID and Secret Access Key.
- Scan Interval - Accept the default of 5 minutes, or enter a time interval at which Sumo Logic will scan CloudWatch Sources for new data.
Installing the Aurora PostgreSQL ULM App
Now that you have set up log and metric collection for Amazon Aurora PostgreSQL, you can install the Sumo Logic App for Aurora PostgreSQL ULM, and use its pre-configured searches and dashboards.
To install the app, do the following:
Locate and install the app you need from the App Catalog. If you want to see a preview of the dashboards included with the app before installing, click Preview Dashboards.
- From the App Catalog, search for and select the app.
- Select the version of the service you're using and click Add to Library. Version selection is applicable only to a few apps currently. For more information, see the Install the Apps from the Library.
- To install the app, complete the following fields.
- App Name. You can retain the existing name, or enter a name of your choice for the app.
- Data Source. Select either of these options for the data source.
- Choose Source Category, and select a source category from the list.
- Choose Enter a Custom Data Filter, and enter a custom source category beginning with an underscore. Example: (
_sourceCategory=MyCategory).
- Advanced. Select the Location in Library (the default is the Personal folder in the library), or click New Folder to add a new folder.
- Click Add to Library.
Once an app is installed, it will appear in your Personal folder, or other folder that you specified. From here, you can share it with your organization.
Panels will start to fill automatically. It's important to note that each panel slowly fills with data matching the time range query and received since the panel was created. Results won't immediately be available, but with a bit of time, you'll see full graphs and maps.
Viewing Aurora PostgreSQL ULM Dashboards
Each dashboard has a set of filters that you can apply to the entire dashboard, as shown in the following example. Click the funnel icon in the top dashboard menu bar to display a scrollable list of filters that narrow search results across the entire dashboard.
Each panel has a set of filters that are applied to the results for that panel only, as shown in the following example. Click the funnel icon in the top panel menu bar to display a list of panel-specific filters.
CloudTrail Event - Overview
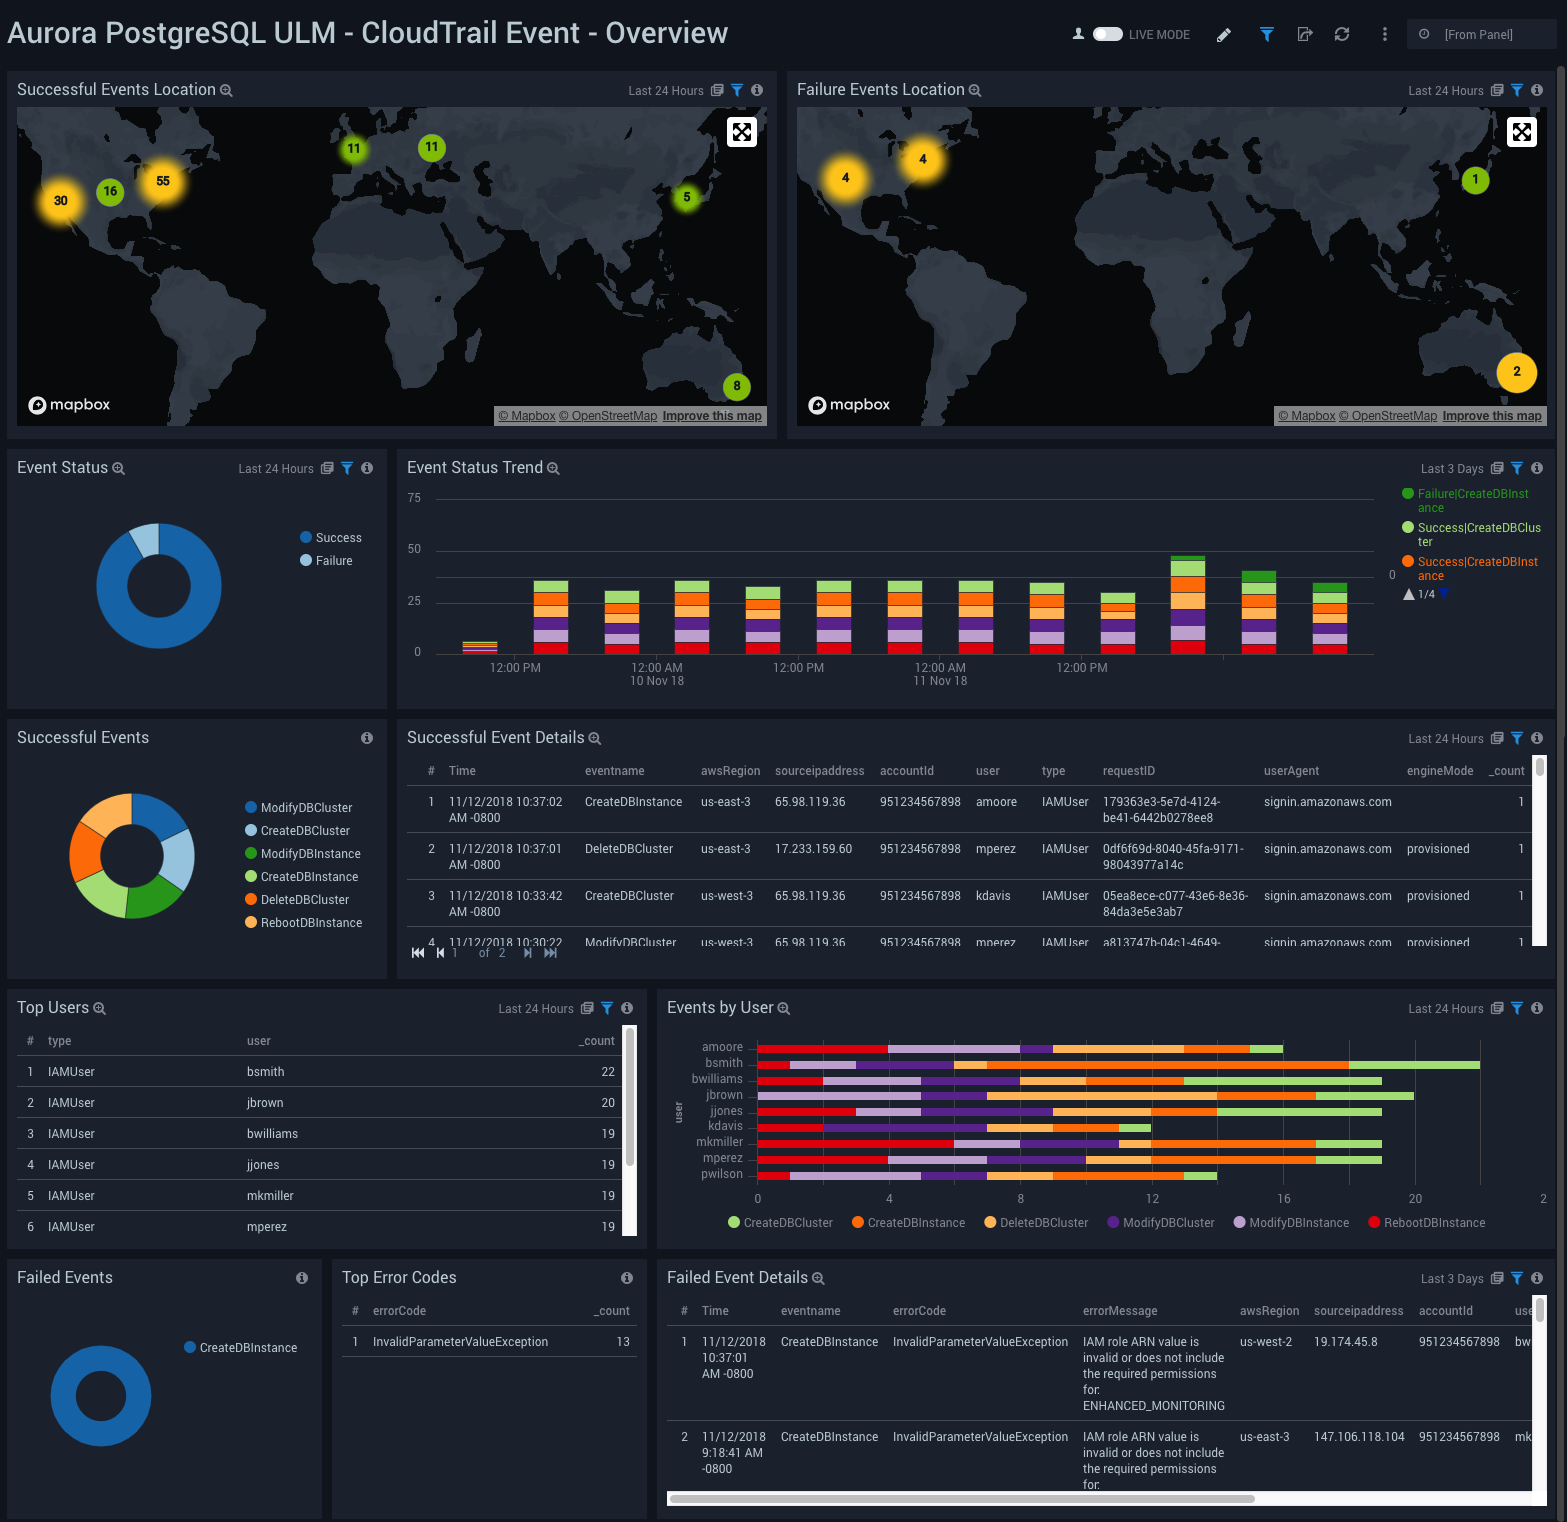
Aurora PostgreSQL ULM CloudTrail Event - Overview Dashboard allows you to view details for event logs, including geographical locations, trends, successful and failed events, user activity, and error codes.
Use this dashboard to get an at-a-glance overview of following:
- Locations of successful and failed activities to check if they're within compliance.
- Event trends to identify if there is something different compared to typical patterns.
- Users and the type of authentication method used.
- Failed activities so you can take corrective actions.
To drill down for details, click the Event Status panel. Details are shown for the of events in the linked dashboard: Aurora PostgreSQL ULM - CloudTrail Event - Details.
CloudTrail Event - Details
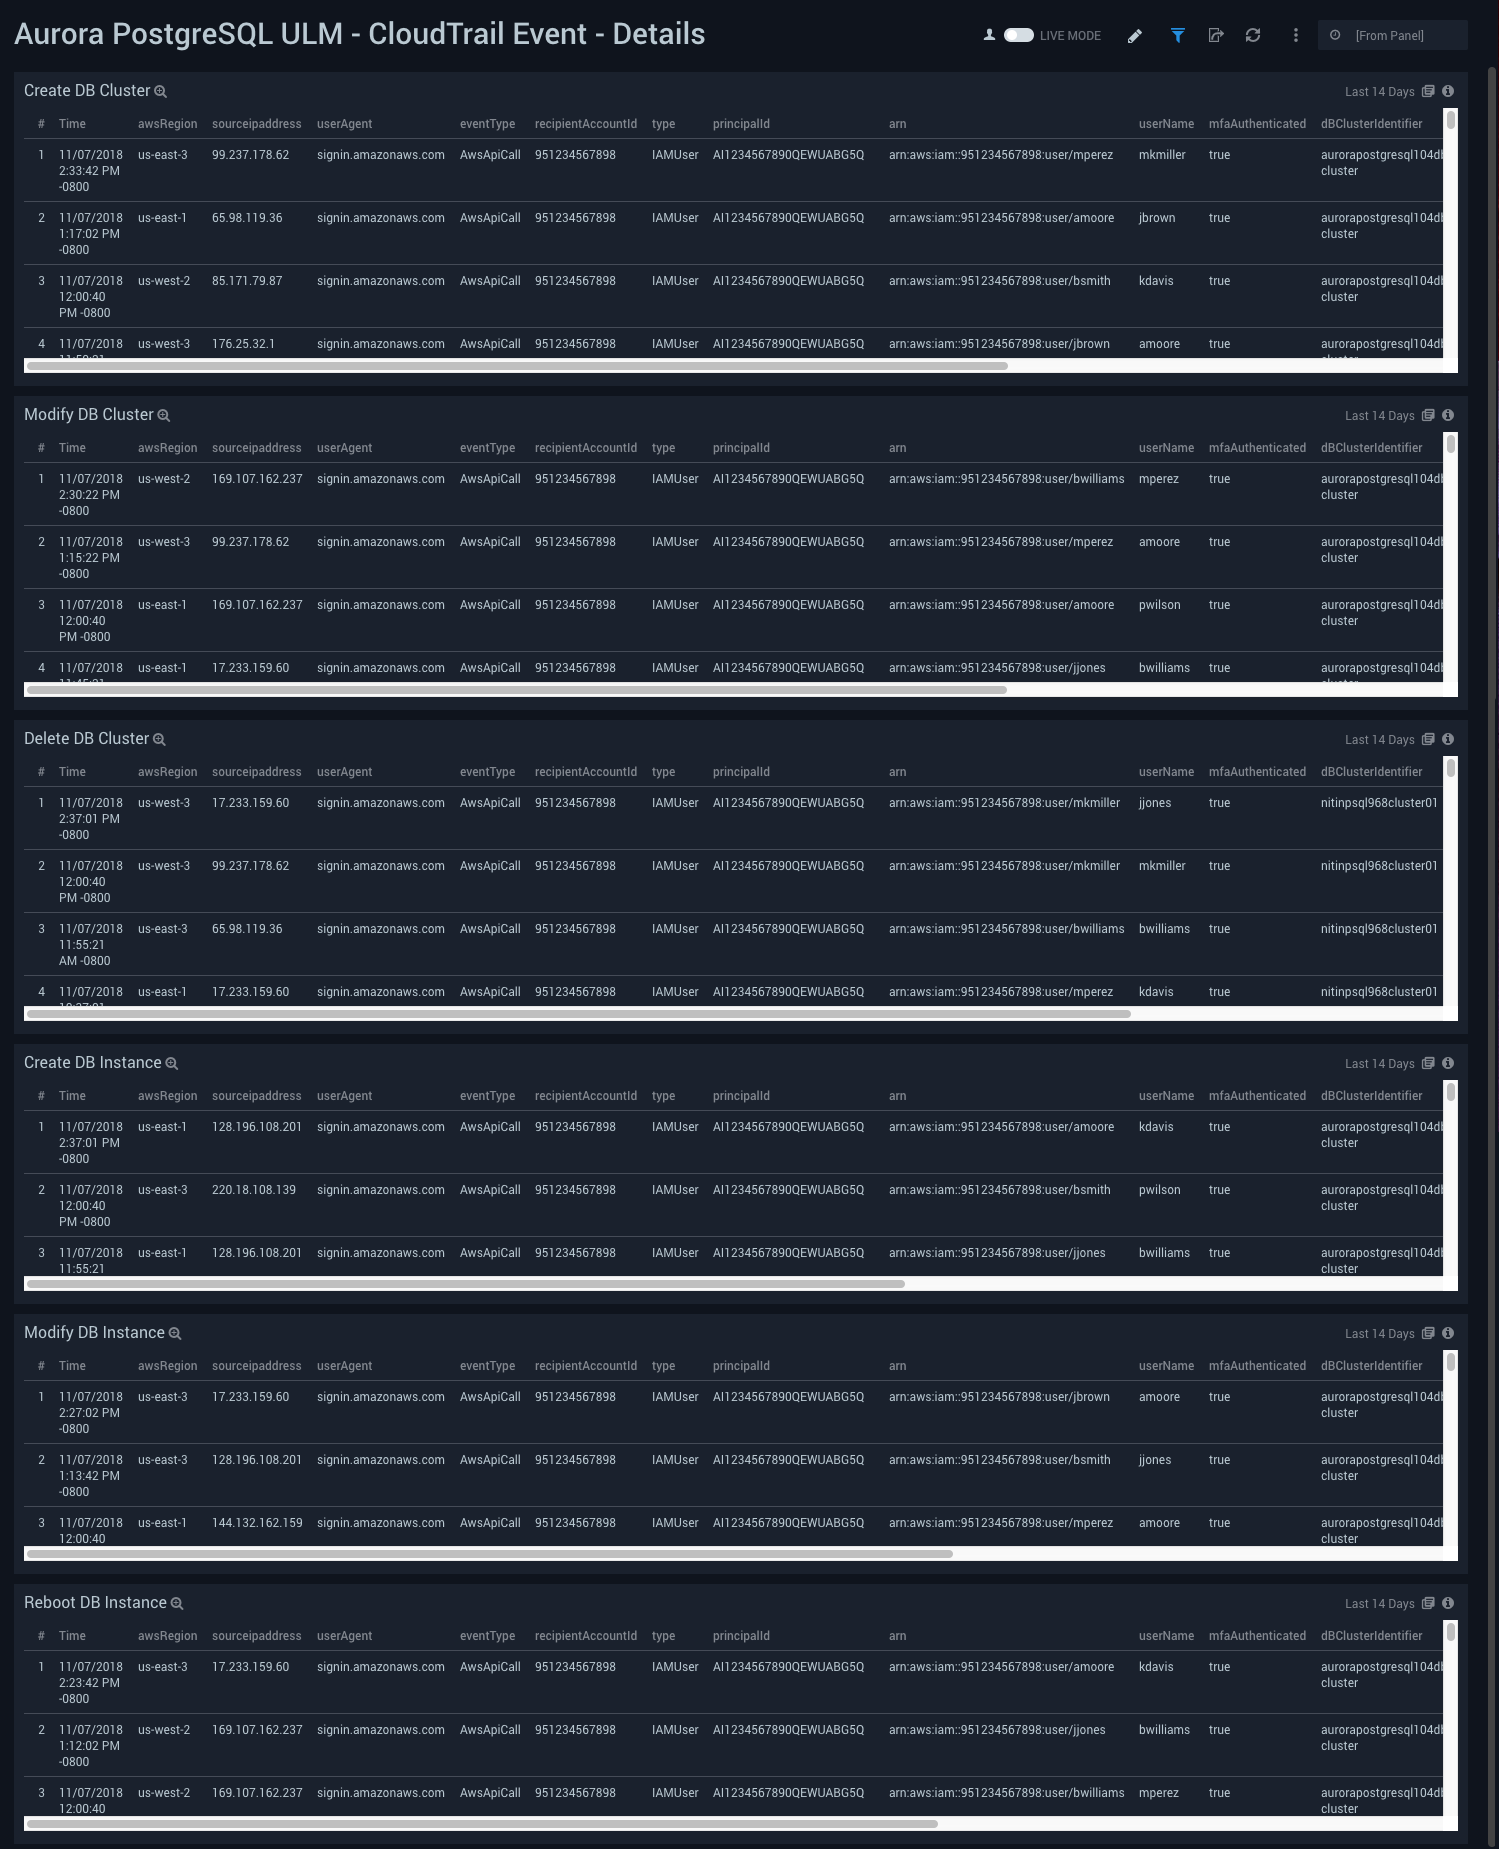
Aurora PostgreSQL ULM CloudTrail Event - Details Dashboard allows you to view details for events, including creating, modifying, and deleting database clusters and database instances. Use this dashboard to:
Use this dashboard to:
- Keep track of your Aurora PostgreSQL Clusters and Instances. This dashboard provides details about various cluster and instance related activities, such as creation, modification, deletion and reboot of instances. The improper configuration of clusters and instances may have adverse impact on performance.
- Help identify problems with details about the Aurora PostgreSQL specific events that provide insights into how to solve a particular problem.
Metric - Overview
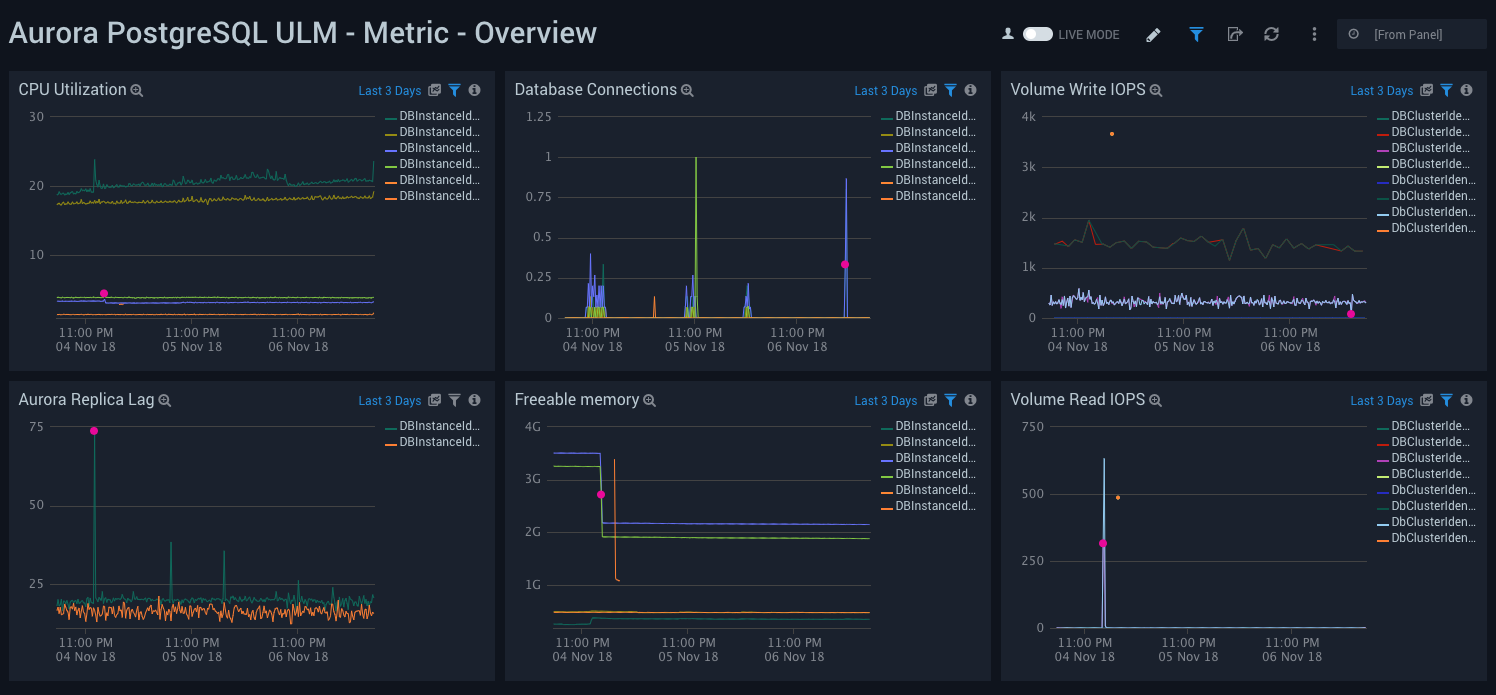
Aurora PostgreSQL ULM Metric - Overview Dashboard allows you to view a high-level analysis of Aurora PostgreSQL database CPU utilization, connections, IOPS, replica lag, and memory usage.
This dashboard utilizes CloudWatch RDS Metrics for Aurora.
Use this dashboard to:
- Monitor the number of connections.
- Monitor CPU utilization.
- Monitor Volume Read and Write IOPS to ensure the database is optimally interacting with disk.
- Monitor replica lags and available free memory to ensure support of heavy read loads with good performance.
Metric - Generic
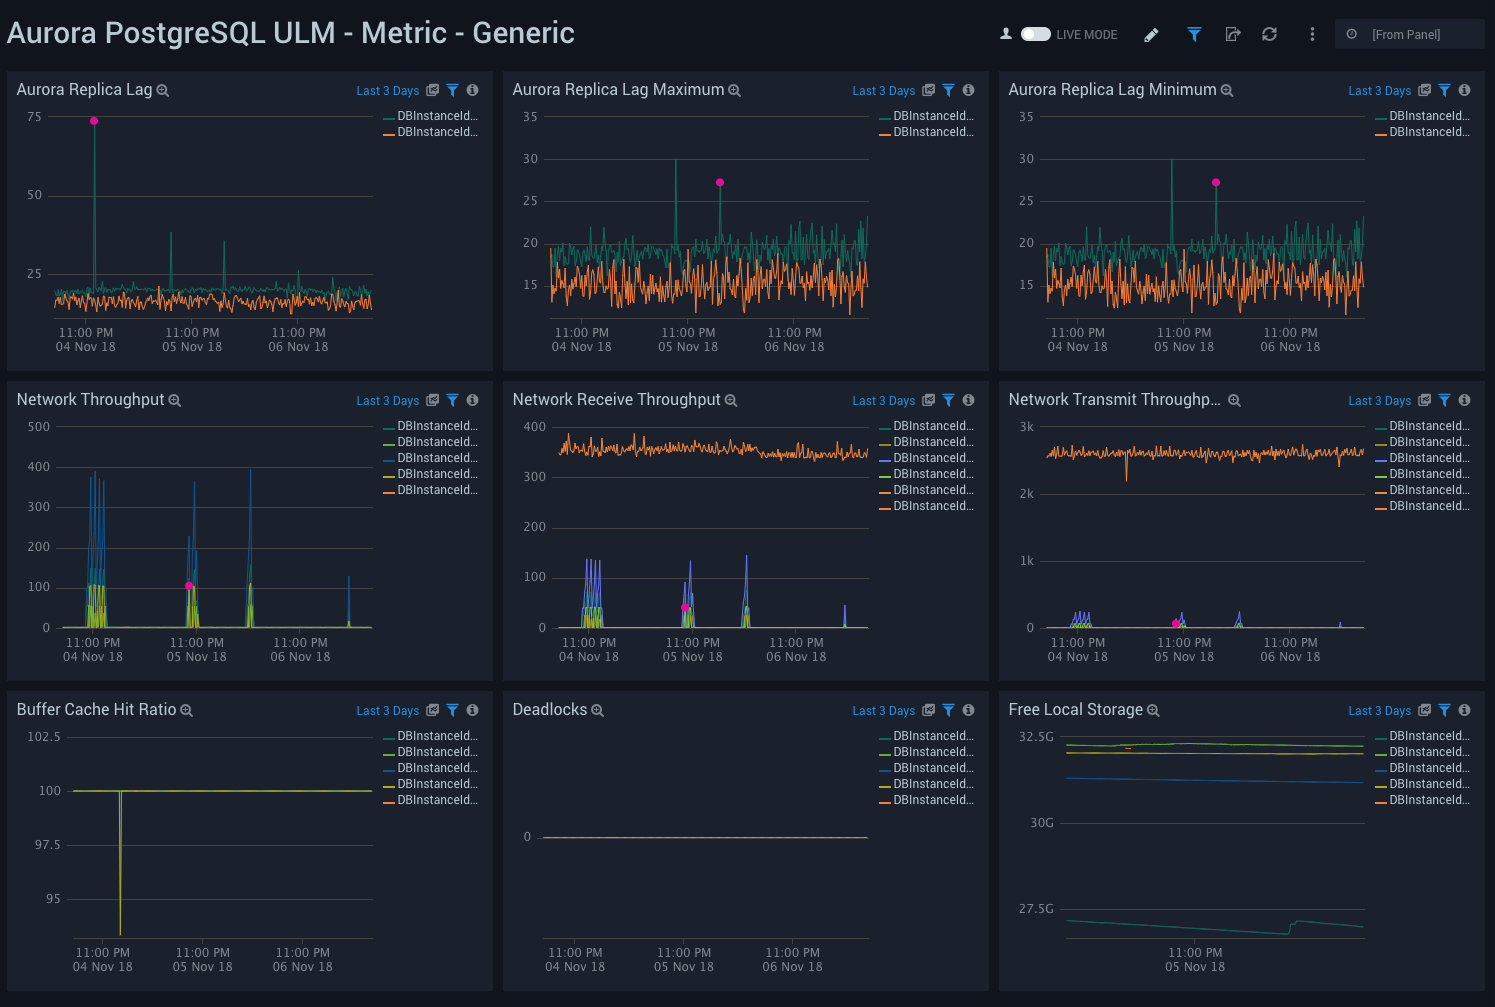
Aurora PostgreSQL ULM Metric - Generic Dashboard allows you to view analysis of replica lag, network throughput, buffer cache hit ratio, deadlocks, and free storage capacity.
This dashboard utilizes CloudWatch RDS Metrics for Aurora.
Use this dashboard to:
- Monitor replica lags. Aurora supports read replicas with extremely low replica lags to support applications with heavy read activity loads.
- Monitor network traffic load and usage. RDS supports monitoring network throughput.
- Monitor cache hit ratio to identify free memory from query performance perspective.
- Identify deadlocks, if any, and identify free local storage.
Metric - Latency, Throughput, and IOPS Monitoring
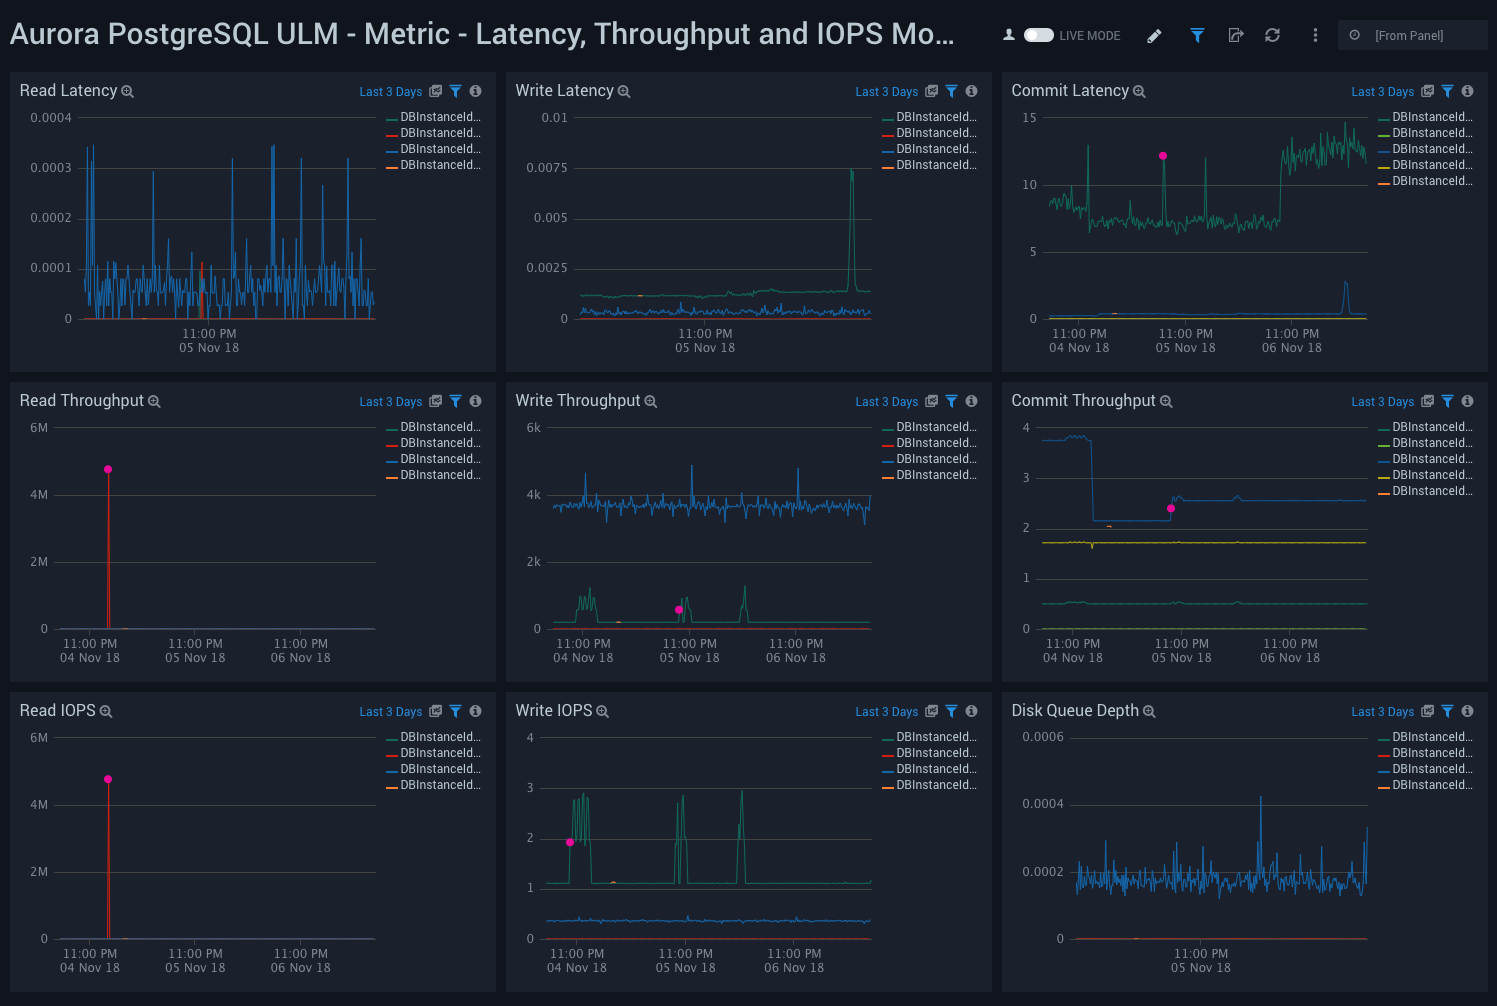
Aurora PostgreSQL ULM Metric - Latency, Throughput, and IOPS Monitoring Dashboard allows you to view granular details of database latency, throughput, IOPS and disk queue depth. It is important to monitor the performance of database queries. Latency and throughput are the key performance metrics.
This dashboard utilizes CloudWatch RDS Metrics for Aurora.
Use this dashboard to:
- Monitor read, write latency and throughput.
- Monitor Read and Write IOPS to ensure your database is interacting with disk optimally.
- Monitor database wait times for disk access with the Disk Queue Depth panel.
Metric - Resource Utilization Monitoring
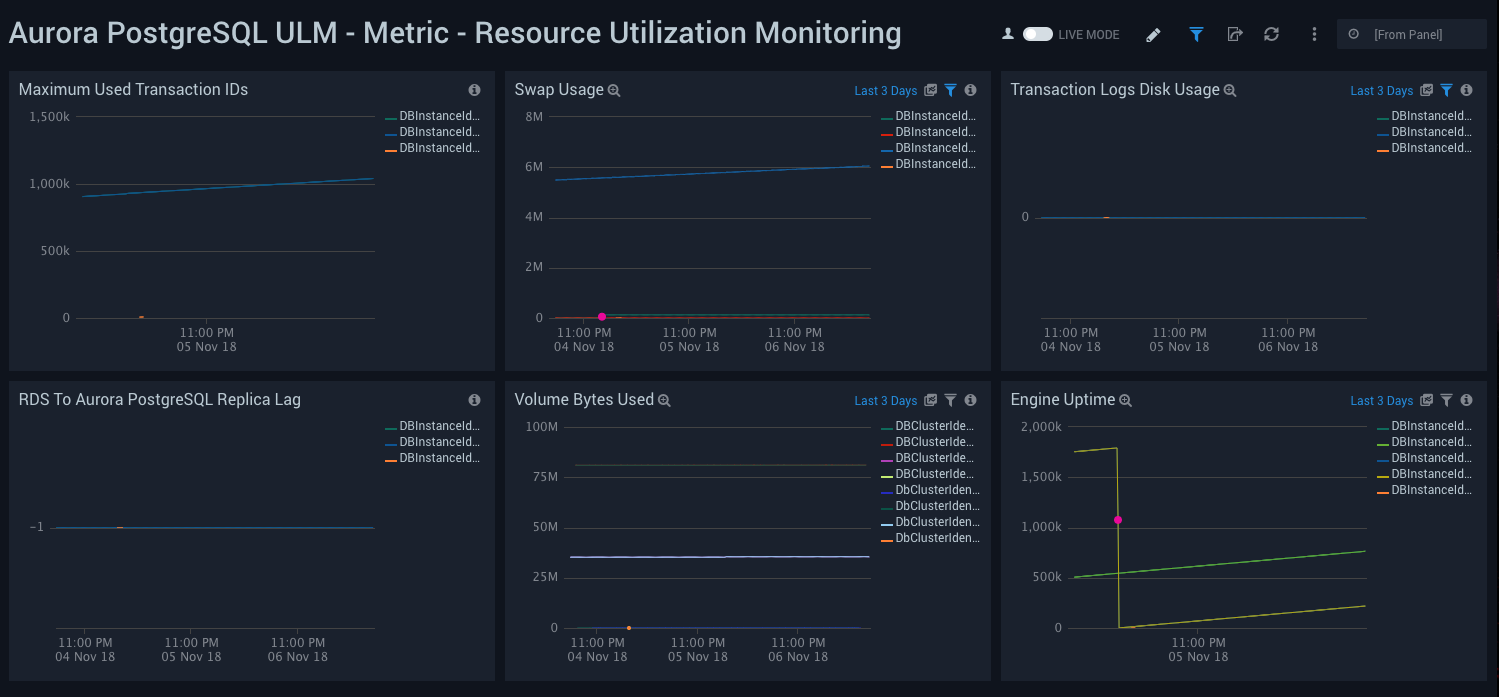
Aurora PostgreSQL ULM Metric - Resource Utilization Monitoring Dashboard allows you to view analysis of resource utilization, including volume usage, swap usage, transaction log disk usage, uptime, transaction IDs, and replica lag.
This dashboard utilizes CloudWatch RDS Metrics for Aurora.
Use this dashboard to:
- Monitor disk usage for transaction logs and swap usage for a database instance.
- Monitor Maximum transaction IDs used to avoid the database going into read-only mode to avoid transaction ID wraparound.
- Monitor replica lag when replicating updates from the primary RDS PostgreSQL instance to other cluster nodes.
- Monitor engine up time.
