Sumo Logic App for Amazon Inspector - Classic

For information about our newer app for Amazon Inspector, which leverages findings from AWS Security Hub, see Amazon Inspector.
Amazon Inspector allows you to monitor your AWS resources for potential security risks. The Sumo Logic App for Amazon Inspector provides preconfigured searches and Dashboards that give you instant access to an overview of Amazon Inspector as well as details on assessments, runs, and findings.
The App uses a Lambda function to collect assessment run events (notifications) directly from the Amazon Inspector service, which then retrieves further details via the Inspector API, and finally sends them over to a Sumo Logic HTTP Source endpoint.
For more information on Amazon Inspector notifications, see: Amazon Inspector Classic assessment templates and assessment runs.
Sample Log
{
   "eventVersion": "1.03",
   "userIdentity": {
       "type": "AssumedRole",
       "principalId": "AIDACKCEVSQ6C2EXAMPLE",
       "arn": "arn:aws:iam::444455556666:user/Alice",
       "accountId": "444455556666",
       "accessKeyId": "AKIAI44QH8DHBEXAMPLE",
       "sessionContext": {
           "attributes": {
               "mfaAuthenticated": "false",
               "creationDate": "2016-04-14T17:05:54Z"
           },
           "sessionIssuer": {
               "type": "Role",
               "principalId": "AIDACKCEVSQ6C2EXAMPLE",
               "arn": "arn:aws:iam::444455556666:user/Alice",
               "accountId": "444455556666",
               "userName": "Alice"
           }
       }
   },
   "eventTime": "2016-04-14T17:12:34Z",
   "eventSource": "inspector.amazonaws.com",
   "eventName": "CreateResourceGroup",
   "awsRegion": "us-west-2",
   "sourceIPAddress": "205.251.233.179",
   "userAgent": "console.amazonaws.com",
   "requestParameters": {
       "resourceGroupTags": [
           {
               "key": "Name",
               "value": "ExampleEC2Instance"
           }
       ]
   },
   "responseElements": {
       "resourceGroupArn": "arn:aws:inspector:us-west-2:444455556666:resourcegroup/0-oclRMp8B"
   },
   "requestID": "148256d2-0264-11e6-a9b5-b98a7d3b840f",
   "eventID": "e5ea533e-eede-46cc-94f6-0d08e6306ff0",
   "eventType": "AwsApiCall",
   "apiVersion": "v20160216",
   "recipientAccountId": "444455556666"
}
Collecting Data for the Amazon Inspector Classic App
For information about our newer app for Amazon Inspector, which leverages findings from AWS Security Hub, see Amazon Inspector.
This section provides instructions for configuring data collection for the Amazon Inspector App.
Step 1: Configure Collection in Sumo Logic
To collect data for the Amazon Inspector App, do the following:
- Configure a Hosted Collector.
- Configure an HTTP Source.
Step 2: Configure Amazon Inspector
On Amazon Inspector, perform these tasks under the same AWS region:
- Create an Amazon SNS topic to receive assessment template events.
- Configure the Amazon Inspector to send findings to the SNS topic.
- Create an appropriate role to execute a Lambda function and read Inspector data.
- Set up a Lambda function to fetch data and send to the Sumo Logic HTTP Source endpoint.
Details are provided in the following sections.
Step 3: Create an Amazon SNS Topic
- Log in to the Amazon Console.
- Click Services. In the dropdown go to Application Integration > Simple Notification Service (SNS).
- On the SNS Dashboard, select Topics on the left side.
- A new window opens, select Create topic button.
- In the new window, enter the following details:
- Name: Enter a topic name.
- Access Policy: Select Advance.
- JSON Editor: Replace the existing text with the following.
{
  "Version": "2008-10-17",
  "Id": "inspector-sns-publish-policy",
  "Statement": [
    {
      "Sid": "inspector-sns-publish-statement",
      "Effect": "Allow",
      "Principal": {
        "Service": "inspector.amazonaws.com"
      },
      "Action": "SNS:Publish",
      "Resource": "arn:aws:sns:*"
    }
  ]
}
- Click Create Topic button.
Step 4: Configure Amazon Inspector
- In the Amazon Console, click Services. In the opened dropdown, go to Security, Identity & Compliance > Inspector.
- Select assessment templates on the left side.
- A new window opens, select each assessment template you want to monitor.
- Expand each row and find the section called SNS topics.
- Click the Edit icon and select the SNS topic you created in the previous section.
- Click Save.
Step 5: Create a Role
- In the Amazon Console, click Services. In the opened dropdown, go to Security, Identity & Compliance > IAM.
- Select Roles on the left side. A new window open, click the Create role button.
- Select Lambda and then click Next: Permissions button.
- In the Attach permissions policy section, search and select AWSLambdaBasicExecutionRole and AmazonInspectorReadOnlyAccess policies.
- Select Next: Tags button.
- Select Next: Review button.
- In the Review section, Enter the role name Lambda-Inspector and click the Create role button.
Step 6: Create a Lambda Function
- In the Amazon Console, click Services. In the opened dropdown, go to Compute > Lambda.
- Click Create function button.
- In the Author from Scratch section:
- Function name: Enter function name.
- Runtime: Select the Python 3.7 runtime.
- Choose or create an execution role: Select Use an existing role radio button. Select the role created in Step 5.
- Click Create function button.
- Click the Add trigger button.
- Select SNS Service.
- Select the SNS topic you created in create an Amazon SNS Topic as trigger.
- Click the Add button.
- Click the Function name and go to the Function code section.
- Go to https://raw.githubusercontent.com/SumoLogic/sumologic-aws-lambda/main/inspector/python/inspector.py and copy-paste the code in the editor.
- Edit the code to enter the URL of the Sumo Logic endpoint ( line 14) that will receive data from the HTTP Source.
- Click Save at the top.
- Scroll down and go to Edit basic settings and configure the rest of the settings as follows:
- Handler: lambda_function.sumo_inspector_handler
- Memory (MB): 128
- Timeout: 10 minutes
- Click Save.
Installing the Amazon Inspector Classic App
Now that you have set up collection for Amazon Inspector, install the Sumo Logic App for Amazon Inspector to use the pre-configured Searches and dashboards that provide visibility into your environment for real-time analysis of overall usage.
To install the app:
Locate and install the app you need from the App Catalog. If you want to see a preview of the dashboards included with the app before installing, click Preview Dashboards.
- From the App Catalog, search for and select the app.
- Select the version of the service you're using and click Add to Library. Version selection is applicable only to a few apps currently. For more information, see the Install the Apps from the Library.
- To install the app, complete the following fields.
- App Name. You can retain the existing name, or enter a name of your choice for the app.
- Data Source. Select either of these options for the data source.
- Choose Source Category, and select a source category from the list.
- Choose Enter a Custom Data Filter, and enter a custom source category beginning with an underscore. Example: (
_sourceCategory=MyCategory).
- Advanced. Select the Location in Library (the default is the Personal folder in the library), or click New Folder to add a new folder.
- Click Add to Library.
Once an app is installed, it will appear in your Personal folder, or other folder that you specified. From here, you can share it with your organization.
Panels will start to fill automatically. It's important to note that each panel slowly fills with data matching the time range query and received since the panel was created. Results won't immediately be available, but with a bit of time, you'll see full graphs and maps.
Viewing Inspector Classic Dashboards
Overview

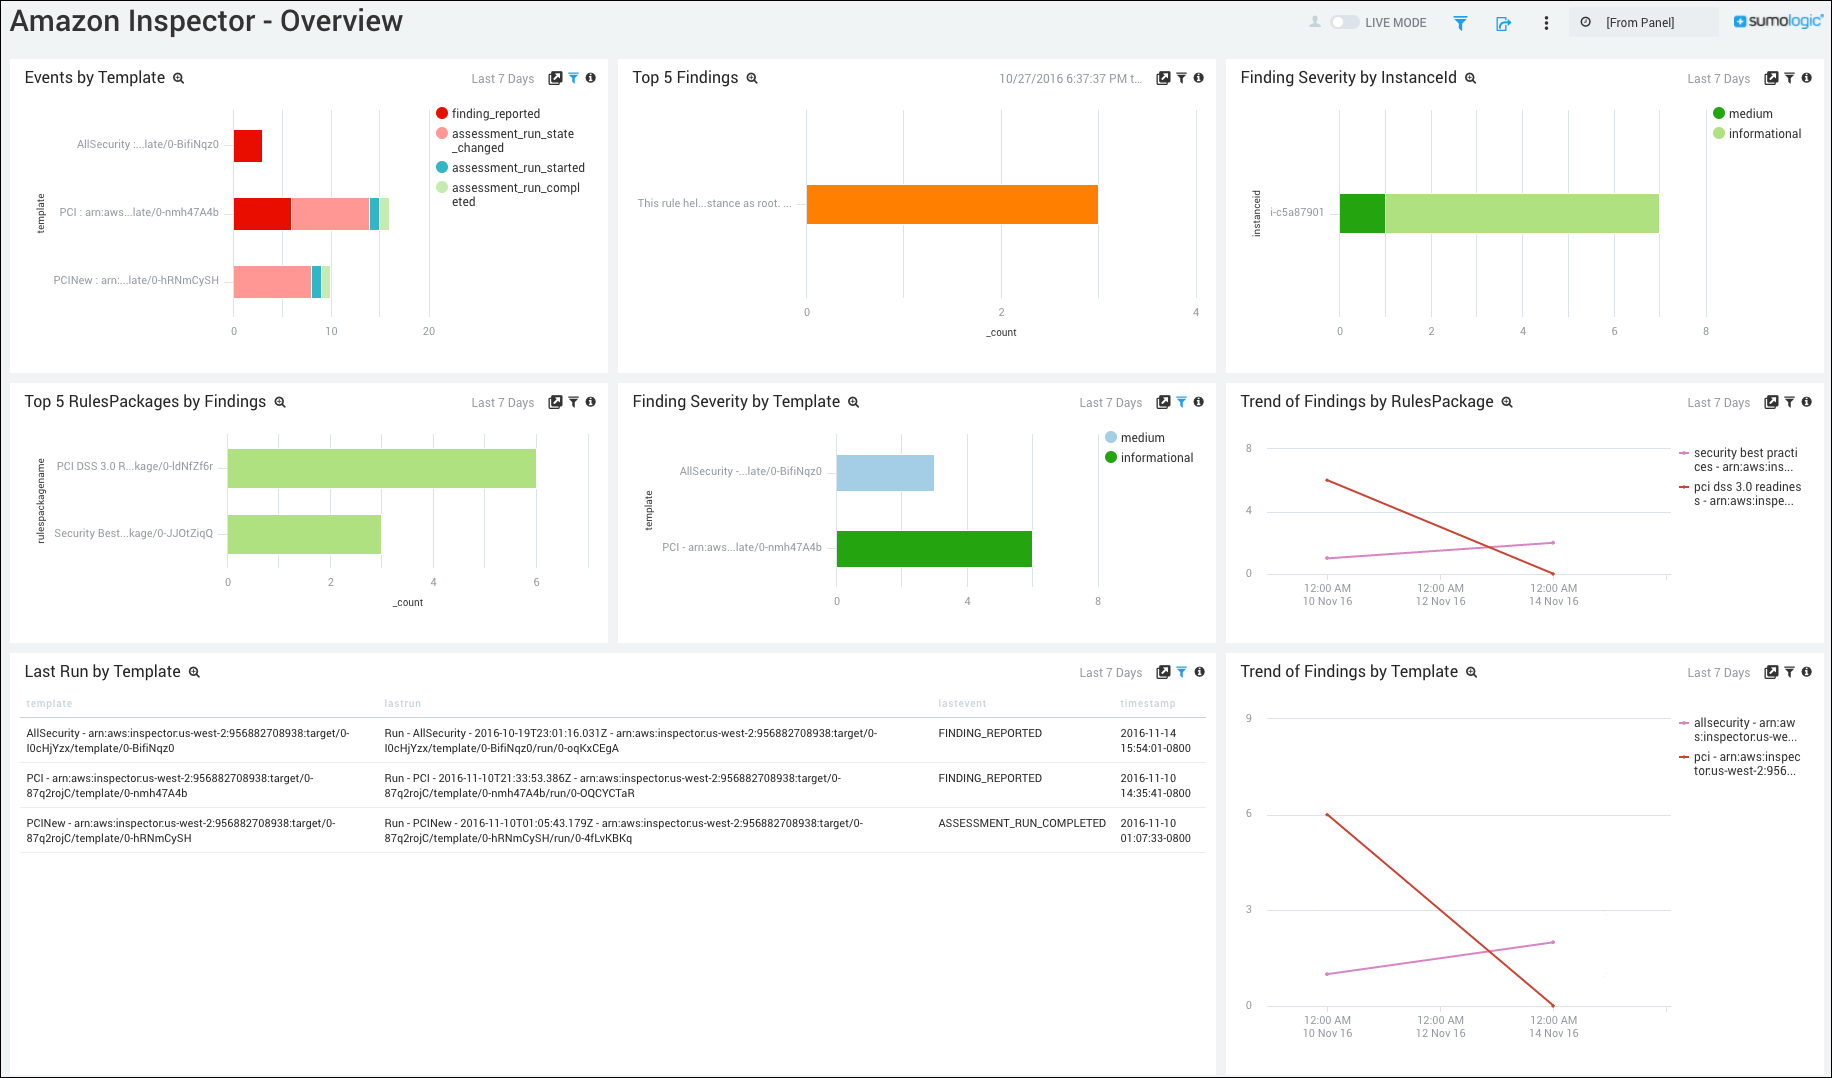
Events by Template. Displays events by template in a stacked bar chart for the last seven days.
Top 5 Findings. Displays the top 5 findings in a bar chart for the last seven days.
Finding Severity by InstanceID. Shows the finding severity by InstanceID in a stacked bar chart for the last seven days.
Top 5 Rules Packages by Findings. Provides details on the top 5 Rules Packages by findings in a bar chart for the last seven days.
Finding Severity by Template. Displays the severity of findings by template in a bar chart for the last seven days.
Trend of Findings by RulesPackage. Shows the trend of findings by RulesPackage in a trend line chart on a timeline for the last seven days.
Last Run by Template. Shows the last run by template in a table chart, including details on the template, lastrun, lastevent, and timestamp for the last seven days.
Trend of Findings by Template. Shows the trend of findings by template in a trend line chart on a timeline for the last seven days.
Findings

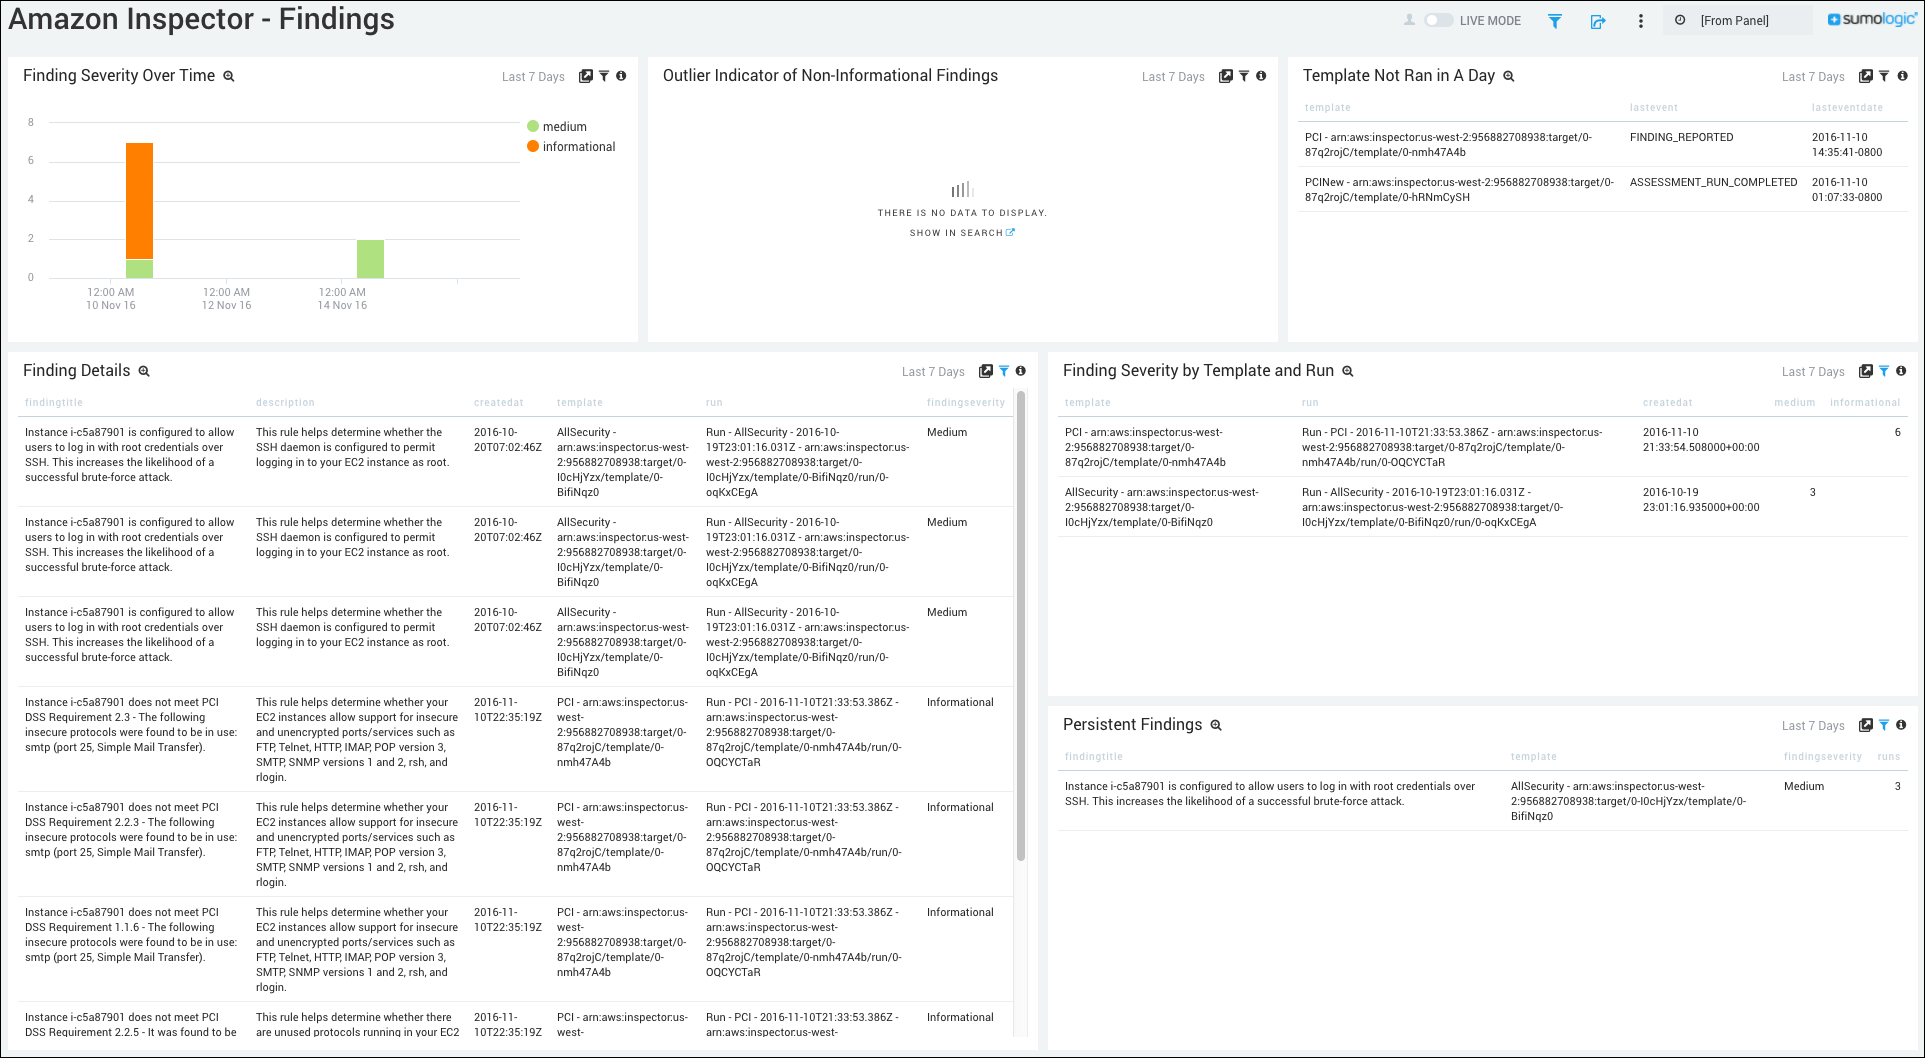
Finding Severity Over Time. Shows the finding severity over time in a stacked column chart on a timeline for the last seven days.
Outlier Indicator of Non-Information Findings. Displays the indicator of non-informational findings in an outlier chart for the last seven days.
Templates Not Run in a Day. Provides information on templates that have not been run in a day in a table chart, including details on the template, last event, and last event date for the last seven days.
Finding Details. Displays complete finding details in a table chart, including information on the finding title, description, create date, template, run, and finding severity for the last seven days.
Finding Severity by Template and Run. Shows the details of finding severity by template and run in a table chart including information on the template, run, create date, and medium or informational severity for the last seven days.
Persistent Findings. Displays persistent findings in a table chart, including details on the finding title, template, finding severity, and number of runs for the last seven days.

