Sumo Logic App for Salesforce

The Sumo Logic App for Salesforce analyzes logs generated by Salesforce Event Monitoring, which provides insight into your Salesforce instance and Salesforce apps. The App allows you to monitor APEX and API performance, logins, report performance, setup audit activity, user activity, and user agents.
Salesforce generates event logs during non-peak hours, every 24 hours. This means that you may not see data fill your Dashboard Panels for at least 24 hours. If you do not see data in 48 hours, contact Salesforce customer support.
Log Types
The Sumo Logic App for Salesforce uses Salesforce Event Log Files. The number of log types you receive depends on the Event Monitoring Edition that you sign up for.
For details, see the Salesforce Event Monitoring Quick Start Guide.
For the complete list of available events and fields, see Event Monitoring Event Types.
Sample log message
{
   "EVENT_TYPE":"Report",
   "TIMESTAMP":"20171002172229.677",
   "REQUEST_ID":"423LBHidMGMvdMH5Tie2a-",
   "ORGANIZATION_ID":"00XT0000000ABmu",
   "USER_ID":"006X0000006TZhh",
   "RUN_TIME":"606",
   "CPU_TIME":"90",
   "CLIENT_IP":"38.99.50.98",
   "URI":"/00OE0000003MThb",
   "REQUEST_STATUS":"S",
   "DB_TOTAL_TIME":"475884875",
   "ENTITY_NAME":"",
   "DISPLAY_TYPE":"S",
   "RENDERING_TYPE":"W",
   "REPORT_ID":"00OE0000003MThb",
   "NUMBER_EXCEPTION_FILTERS":"0",
   "NUMBER_COLUMNS":"3",
   "SORT":"",
   "DB_BLOCKS":"65351",
   "DB_CPU_TIME":"430",
   "NUMBER_BUCKETS":"2",
   "TIMESTAMP_DERIVED":"2016-02-08T21:55:55.667Z",
   "USER_ID_DERIVED":"006X0000006TZhhIAG",
   "USER_ID_DERIVED_LOOKUP":"saad@acme.com",
   "URI_ID_DERIVED":"00OE0000003MThbMAG",
   "REPORT_ID_DERIVED":"00OE0000003MThbMAG",
   "REPORT_ID_DERIVED_LOOKUP":"g Current Q MQL(C) by LC"
}
Sample Query
_sourceCategory=salesforce event type "Report"
| json "REPORT_ID_DERIVED","REPORT_ID_DERIVED_LOOKUP" as report_id, report_name
| count by report_name, report_id
| format("%s : %s",report_name, report_id) as report_id
| count by report_id
| sort by _count desc | top 20 report_id by _count
Prerequisites
Before you begin setting up log collection, review the required prerequisites and process overview described in the following sections. Installing the Sumo Logic App for Salesforce requires the following:
- Your Salesforce subscription must include the Salesforce Event Monitoring add-on, which is required to obtain all of the data presented in the app dashboards. The add-on enables access to all event types in the Salesforce EventLogFile, the LoginEvent object, Transaction Security, and the Event Monitoring Analytics App. For more information, see Get Started with Event Monitoring and Enable Event Monitoring.
- You will need a user with the permissions API Enabled and View Event Log Files (or View All Data). For assistance, you may need to contact your Salesforce administrator. (See Salesforce Configuration for steps.)
- Your system must run JRE 7. If you do not meet this requirement, you may see an exception similar to:
Exception in thread "main" java.lang.UnsupportedClassVersionError: \
com/sumologic/content/tools/apiclient/SumoJanus : Unsupported major.minor version 51.0- If your Salesforce instance does not support Transport Layer Security (TLS) v1.0, you will be required to run JRE 8 instead of JRE 7. Specifically, if you see an error message like this when the script queries data:
TLS 1.0 has been disabled in this organization.
Please use TLS 1.1 or higher when connecting to Salesforce using https. - You may do the configuration steps on a system with a web browser for authentication via OAuth2, and then move the configuration folder to your production system. Or if your production system has a web browser, all steps may be done on that system.
Collecting Logs for the Salesforce App
This section provides instructions for setting up event collection from Salesforce for analysis in Sumo Logic.
Configure Collection for Salesforce
In this section, we will configure a collection of EventLogFiles and audit logs from Salesforce and send them to Sumo Logic via one of the methods listed below.
- For non-FedRamp Sumo Logic deployments:
- If you're using the Sumo Logic FedRamp deployment:
Configure a new SumoJanus installation for Salesforce (DEPRECATED)
These instructions have been tested on Unix, and also work for Windows. For Windows however, you may need to install third-party tools to handle tar.gz files. This process includes the following tasks, which must be performed in the order in which they are presented:
- Set Salesforce permissions.
- Install the collector and download the SumoJanus package.
- Deploy the SumoJanus packages.
- Configure the SFDC bundle.
- Configure the JRE path.
- Authenticate with Salesforce.
- Configure a script source.
Step 1: Set Salesforce user permissions (DEPRECATED)
if you are a Salesforce admin, you don’t need to perform the steps in this section. Otherwise, have your Salesforce admin create a permission set for you, as described below.
To create a permission set and assign it to a user:
- In Salesforce, go to Setup > Administer > Manage Users > Permission Sets.
- Create a permission set with the API Enabled permission and either the View Event Log Files or the View All Data permission. For more information, see Create Permission Sets in Salesforce help.
- On the Permission Set Overview > System Permissions page, select API Enabled and View Event Log Files.
- Click the Manage Assignments button in the permission set you just created, and click Add Assignments.
- Find your user and assign that user to the permission set you just created.
- Save your changes.
Step 2: Install the collector and download the SumoJanus package (DEPRECATED)
In this section you will install a Sumo Logic collector and download the necessary SumoJanus package.
- Install the collector. In Sumo Logic, install a Collector (version i19.115 or later) on the system where you want to collect Salesforce Event Monitoring Logs. Configure an Installed Collector on a Linux or Windows machine. By default the Collector will come with a Java Runtime Environment. To ensure that SumoJanus can locate Java, you may need to update the .bat or .bash file, as described below.
- Download the SumoJanus package. The SumoJanus file is required to collect logs from Salesforce. SumoJanus is a proprietary library used for script-based collection from applications such as Okta, Box, and Salesforce. Use the following SumoJanus package file that is appropriate for your system:
- For Linux, download sumojanus-salesforce-dist.3.1.0.tar.gz from: https://script-collection.s3.amazonaws.com/sfdc/r3.1.0/sumojanus-salesforce-dist.3.1.0.tar.gz.
- For Windows, download sumojanus-salesforce-dist.3.1.0.zip from https://script-collection.s3.amazonaws.com/sfdc/r3.1.0/sumojanus-salesforce-dist.3.1.0.zip.
Step 3: Deploy the SumoJanus package (DEPRECATED)
This section provides steps for a new SumoJanus installation.
- New SumoJanus installation
- On Linux, run the following commands:
tar xzvf sumojanus-salesforce-3.1.0.tar.gz - On Windows, you can use Windows Explorer to open the zip package and copy it to the target folder.
sumojanus-salesforce-dist.3.1.0.zip
- On Linux, run the following commands:
- Upgrade an existing SumoJanus installation for Salesforce (DEPRECATED)
- Back up
conf/sumologic.propertiesand the data folder. - Set up a New SumoJanus installation
- Migrate the backed up
conf/sumologic.propertiesand data folder to the new Janus folder - Modify the paths in Step 7 below to point to the new folder.
- Back up
Step 4: Configure the SFDC Bundle (DEPRECATED)
This section only applies for a new SumoJanus installation.
- Go to the unzipped
sumojanus-salesforcefolder. - Open the file
conf/sumologic.propertiesand add the following section to the end of the file (do not overwrite any existing content in the file):
[salesforce] \
url = <Salesforce Instance URL> \
token_file_path = ${path}/data/salesforce.token \
record_file_path = ${path}/data/sf_readfiles.dat \
# If you're using a SFDC sandbox environment, set the following to true \
sandbox = false \
interval = daily \
- Set the following properties:
url— Point to your Salesforce URL. For example:https://na25.salesforce.comsandbox— If you are is using a sandbox environment, set the property totrue. It is set tofalseby default.start_time— If you don’t specifystart_time, logs will be collected from two days in the past.interval— Controls whether you collect daily or hourly logs. Note that later in this procedure, in Step 7: Configure a script source, the setting you specify for Frequency, should correspond to theintervalsetting.
In the file conf/sumologic.properties, the following properties are supported.
| Property | Required or Default | Description |
url | Required | Instance URL (for example, https://na31.salesforce.com/ |
token_file_path | Required | Path to access token file to authenticate with SFDC API. |
convert_csv_to_json | Not required, default: true | Set to true if output should be in JSON. This is because raw event logs from SF are in CSV format. |
record_file_path | Not required, default: ${path}/sf_readfiles.dat | Path to store list of log event files read successfully. |
sandbox | Not required, default: false | Set to true if the URL points to a sandbox instance. |
start_time | Not required, default: 2 days ago | Milliseconds since the epoch to begin collecting (for example, 1450137600000). |
end_time | Not required, default: now | Milliseconds since the epoch to stop collecting. |
interval | Not required, default: daily | Set to daily or hourly for corresponding log files. |
Step 5: Configure the JRE path (DEPRECATED)
To avoid errors, use the latest bundled JRE version listed in the Collector Release Notes. Since the JRE folder can change with collector upgrades, we strongly recommend copying this JRE folder to a separate place and pointing the JAVAPATH to that folder. To check the current JRE folder the collector is using, go to the collector folder under **config/wrapper.conf, and look for the variable wrapper.java.command.
- On Windows, update SumoJanus_SF.bat. Navigate to the folder where you installed SumoJanus, and open SumoJanus_SF.bat in a text editor. Line 3 of the script sets
JAVAPATHtoC:\Program Files\Sumo Logic Collector\jre\binas shown below:
set JAVAPATH="C:\Program Files\Sumo Logic Collector\jre\bin"
If your collector JRE is in a different location, update Line 3 accordingly.
- On Linux, update SumoJanus_SF.bash. Navigate to the folder where you installed SumoJanus, and open SumoJanus_SF.bash in a text editor. Update the script as follows:
- Add a line that sets
JAVA_HOMEto point to the location of your JRE, just before the last line of the script. For example, if your collector's JRE is in/opt/SumoCollector/jre/bin, insert this line:JAVA_HOME=/opt/SumoCollector/jre/bin - The last line of the script is:
Prefix the line withjava -jar ${SUMOJANUS_JAR_FILE} ${runMode} SalesforceCollector-3.1.0.jar -e 1800$JAVA_HOME/, like this:$JAVA_HOME/java -jar ${SUMOJANUS_JAR_FILE} ${runMode} SalesforceCollector-3.1.0.jar -e 1800 - Add a line that sets
Step 6: Authenticate with Salesforce (DEPRECATED)
After completing the previous steps, you should authenticate the installation with the task outlined in this section.
To authenticate the installation, do the following:
Log out of SalesForce.
Run the following command under the unzipped
sumojanus-salesforcefolder:- On Unix-like systems:
bin/SumoJanus_SF.bash -s - On Windows:
bin\SumoJanus_SF.bat -s
- On Unix-like systems:
A browser will open (if it doesn't, see If your browser does not open, below):
- If your browser has already authenticated with Salesforce, a message will display saying that access has been granted.
- Otherwise, you will see the Salesforce login. Supply your credentials (with the required permissions) to grant access.
You will then see the following message, which says that the token file has been created:
If you do not see the login screen and just see the token file message, check to make sure that the token file actually exists under the package folder. If it doesn't exist, sign out and retry the process.
Don't close the session where you ran
bin/SumoJanus_SF.bash -s.
If your browser doesn't open
If the target environment does not have a GUI, for example if you are remoting into the environment, SumoJanus won't be able to open a browser and will print out a link to the CLI instead. Copy that link and paste into a browser. Then follow the authentication and approval process with Salesforce, until you get a URL back that looks like this:
http://localhost:8080/?code=<some_value>&state=<some_value>
Your browser will display error messages like those shown below. You can ignore them.
Copy the URL from the browser, change the protocol from "https" to "http" then use one of the following options ON THE SAME MACHINE where the script is running (in case your browser is actually on a different machine). The use of single quotes surrounding the URL are required:
- For Linux, open a terminal window and run:
curl -X GET 'the above url'
- For Windows, open a Powershell window and run:
Invoke-WebRequest 'the above url' -Method Get
If everything was successful, you should see the message “Thank you for granting access for SumoLogic SalesforceCollector” somewhere in the return value. If you see an error regarding an expired authorization code instead, make sure you finish this step within 30 seconds of the previous step as noted above.
You should see a confirmation that the token file has been created, similar to the one shown in Step 4 above.
If the curl command returns the message Empty reply from server, it is likely that the single quotes around the_above_url are missing.
If the browser does not connect to the salesforce instance and you are using Chrome, try again with a Firefox browser.
Test your configuration
- To make sure that the settings are correct, run the following command from the
sumojanus-salesforcefolder:- On Unix-like systems:
bin/SumoJanus_SF.bash - On Windows:
bin\SumoJanus_SF.bat(run the command without the-sflag)
- On Unix-like systems:
- You should see something like this (which may go on for a while):
- Remove the
sf_readfiles.datfile that was just created. This file should be located under thedatafolder.
Step 7. Configure a script source (DEPRECATED)
In Sumo Logic, configure a Script Source using the instructions in Script Source. Collectors using version 19.245-4 and later do not allow Script Sources to run by default.
To allow Script Sources you need to set the Collector parameter **enableScriptSource=true in user.properties to true and restart the Collector.
For the Sumo Logic App for Salesforce, use the following configuration settings:
- Frequency.
- For daily log files, set frequency to every 6 hours.
- For hourly log files, set frequency to 1 hour.
- Specify a timeout for your command:
- For daily log files, set timeout to every 3 hours.
- For hourly log files, set timeout to 1 hour.
- Command: /bin/bash
- On Unix-like systems:
/bin/bash - On Windows: Windows Script
- On Unix-like systems:
- Type the full path to the script to execute, for example
- On Unix-like systems:
/opt/SumoCollector/sumojanus/bin/SumoJanus_SF.bash - On Windows:
c:\Program Files\SumoCollector\sumojanus\bin\SumoJanus_SF.bat
- On Unix-like systems:
- Update the Working Directory. For Working Directory set the full path to the sumojanus folder, for example:
- On Unix-like systems:
/opt/SumoCollector/sumojanus - On Windows:
c:\Program Files\SumoCollector\sumojanus
- On Unix-like systems:
Your path may be different, depending on where you deployed SumoJanus. Salesforce generates event logs during non-peak hours, every 24 hours. This means that you may not see data fill your Dashboard Panels for at least 24 hours. If you do not see data in 48 hours, contact Salesforce customer support.
- Working Directory:
- On Unix-like systems:
/opt/SumoCollector/sumojanus - On Windows:
c:\Program Files\SumoCollector\sumojanus
- On Unix-like systems:
- Advanced Options for Logs
3. Timezone: Select "UTC".
4. Timestamp Format:
yyyy-MM-dd'T'HH:mm:ss.SSS5. Timestamp Locator:TIMESTAMP_DERIVED\":\"([^\"]+)\"6. Download and deploy the SumoJanus package, as described in Step 2 and Step 3. 7. Configure the JRE path, as described in Step 5. 8. From the previous sumojanus folder, copy these files into the corresponding subfolders of the new sumojanus-salesforce folder:1. `conf/sumologic.properties`
2. `data/salesforce.token`
3. `data/sf_readfiles.dat`
Installing the Salesforce App
Now that you have set up collection, install the Sumo Logic App for Salesforce to use the preconfigured searches and dashboards that provide insight into your data.
To install the app:
Locate and install the app you need from the App Catalog. If you want to see a preview of the dashboards included with the app before installing, click Preview Dashboards.
- From the App Catalog, search for and select the app.
- Select the version of the service you're using and click Add to Library. Version selection is applicable only to a few apps currently. For more information, see the Install the Apps from the Library.
- To install the app, complete the following fields.
- App Name. You can retain the existing name, or enter a name of your choice for the app.
- Data Source. Select either of these options for the data source.
- Choose Source Category, and select a source category from the list.
- Choose Enter a Custom Data Filter, and enter a custom source category beginning with an underscore. Example: (
_sourceCategory=MyCategory).
- Advanced. Select the Location in Library (the default is the Personal folder in the library), or click New Folder to add a new folder.
- Click Add to Library.
Once an app is installed, it will appear in your Personal folder, or other folder that you specified. From here, you can share it with your organization.
Panels will start to fill automatically. It's important to note that each panel slowly fills with data matching the time range query and received since the panel was created. Results won't immediately be available, but with a bit of time, you'll see full graphs and maps.
Viewing Salesforce Dashboards
Salesforce generates event logs during non-peak hours, every 24 hours. This means that you may not see data fill your Dashboard Panels for at least 24 hours. If you do not see data in 48 hours, contact Salesforce customer support.
Overview
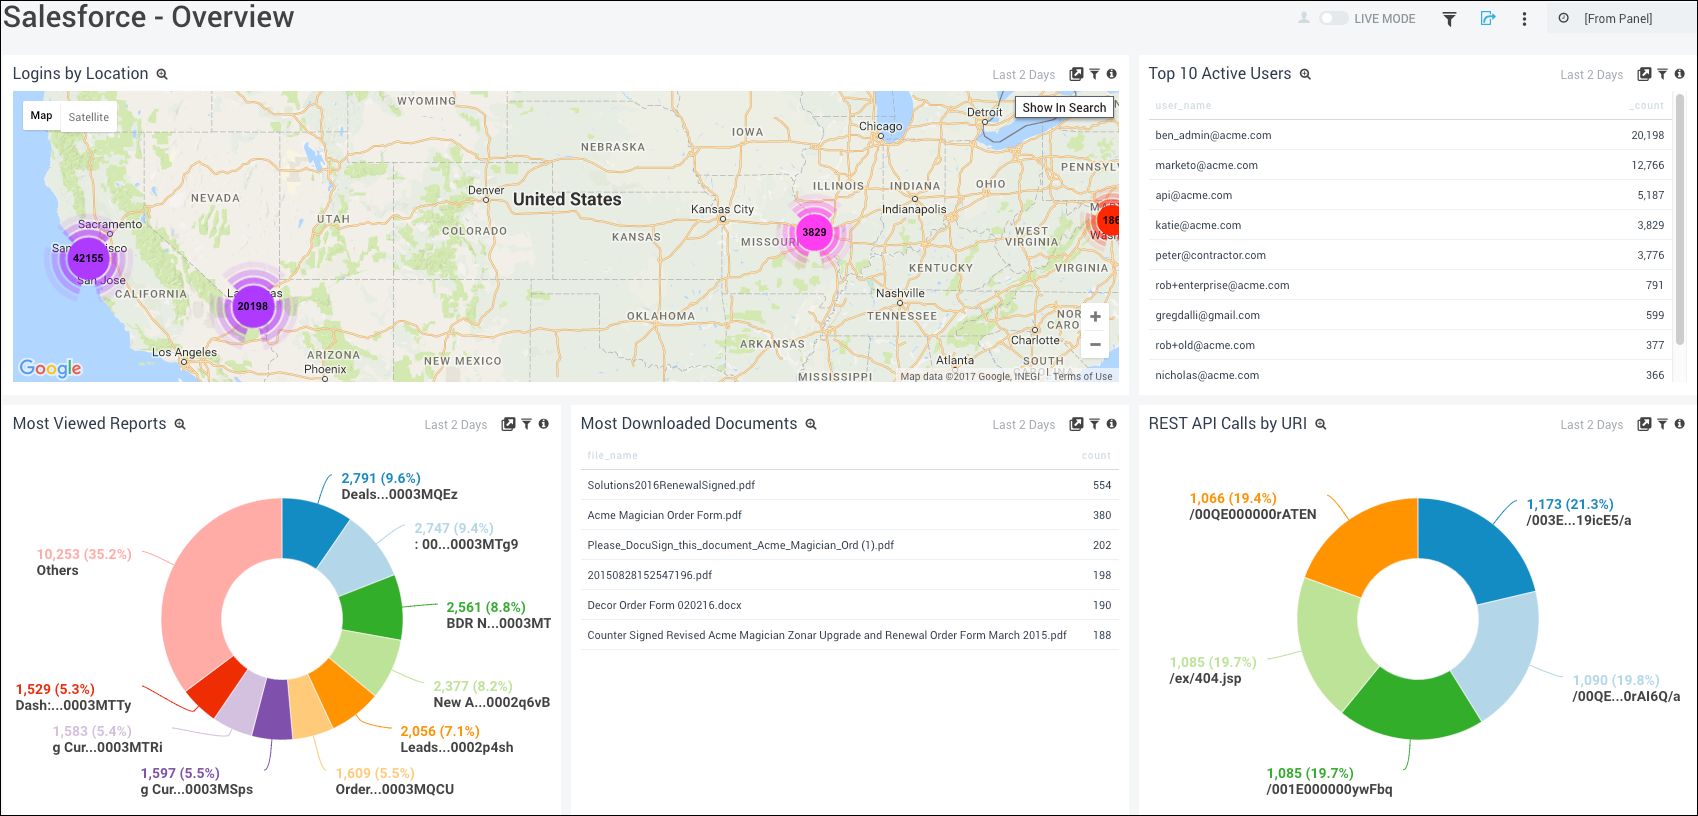
Logins by Location. Uses a geo lookup operation to display login activity on a map of the world for the last two days.
Top 10 Active Users. Lists the top 10 active users in a table chart including user name and count for the last two days.
Most Viewed Reports. Displays the most viewed reports in a pie chart for the last two days.
Most Downloaded Documents. Provides details on the most downloaded documents in a table chart with information on file name and count for the last two days.
REST API Calls by URI. Shows all REST API calls by URI in a pie chart for the last two days.
APEX and API Performance
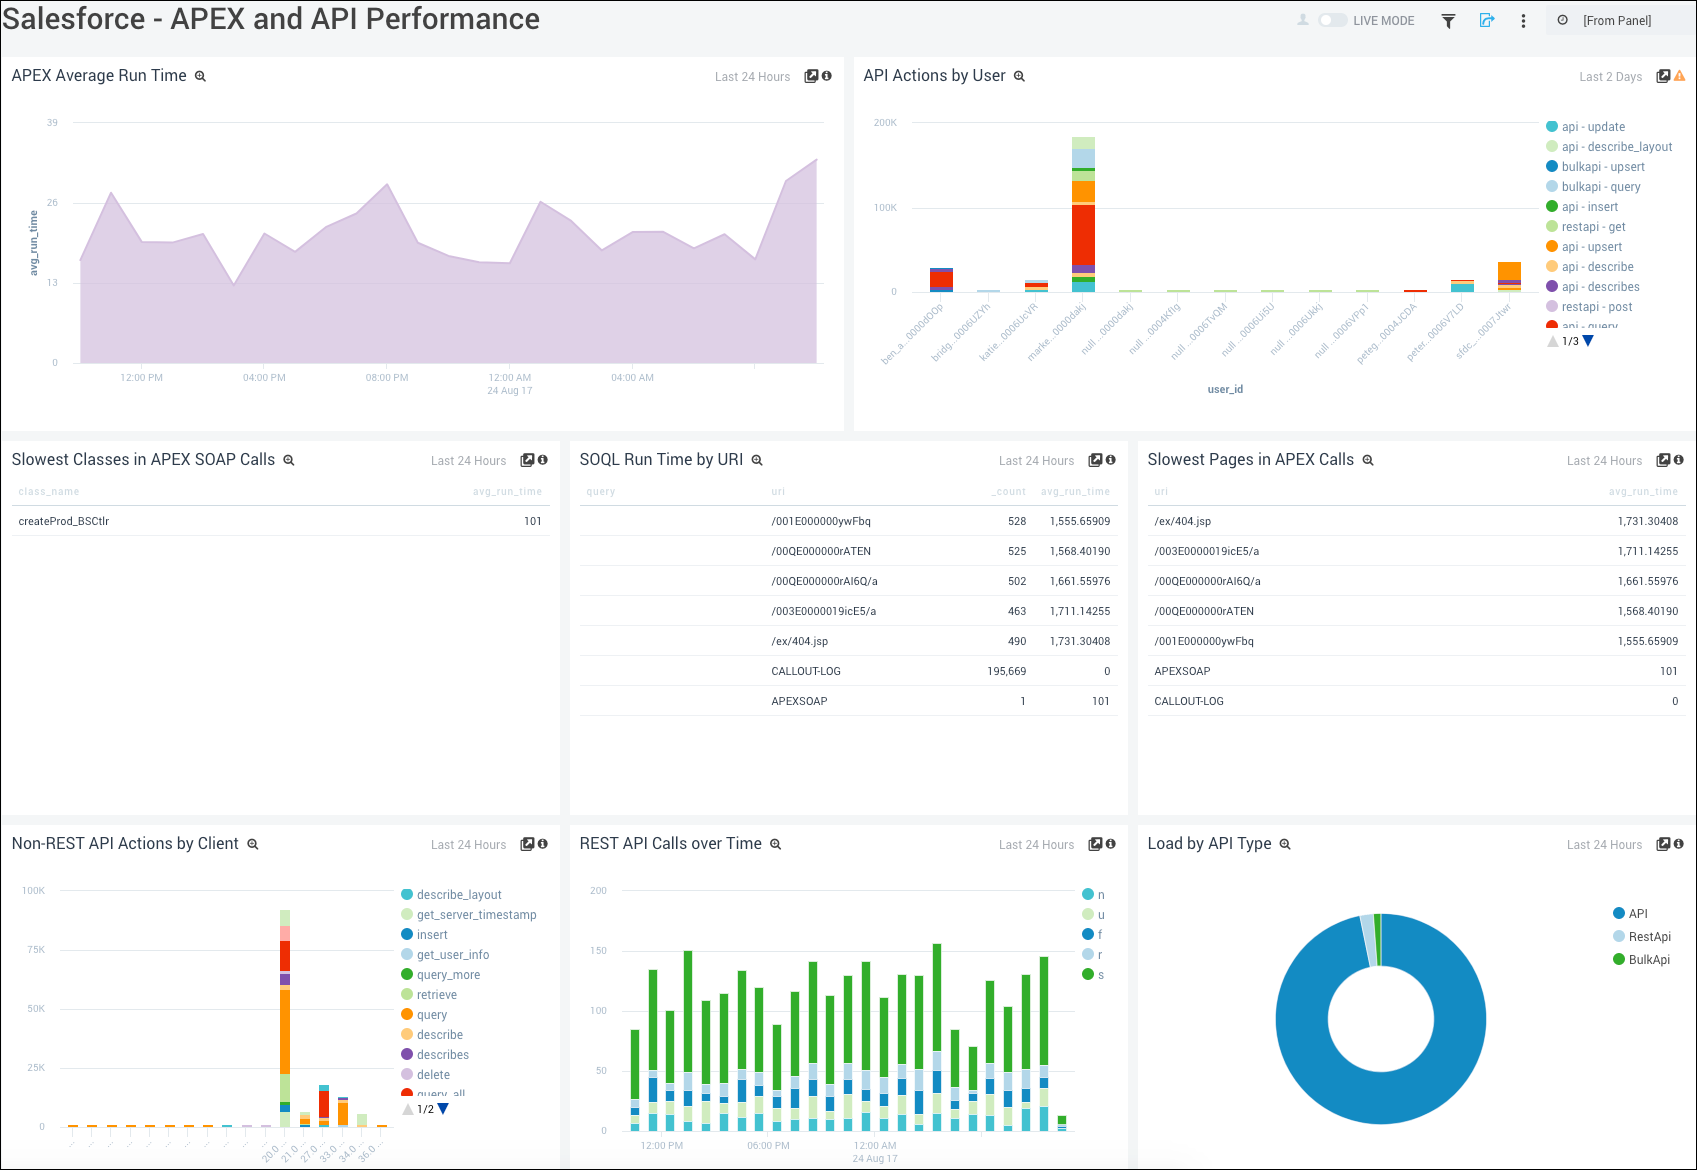
APEX Average Run Time. Displays the APEX average run time in an area chart on a timeline for the last 24 hours.
API Actions by User. Shows API actions by users in a stacked column chart for the last two days.
Slowest Classes in APEX SOAP Calls. Provides details on the slowest classes in APEX SOAP calls in a table chart, including information on the class name and the average run time for the last 24 hours.
SOQL Run Time by URI. Displays the SOQL run time by URI in a table chart including details on the query, URL, count, and average run time for the last 24 hours.
Slowest Pages in APEX Calls. Provides information on the slowest pages in APEX calls in a table chart including details on the URL and average run time for the last 24 hours.
Non-REST API Actions by Client. Shows the non-REST API actions by client in a stacked column chart for the last 24 hours.
REST API Calls Over Time. Displays REST API calls over time in a stacked column chart on a timeline for the last 24 hours.
Load by API Type. Provides information on the load by API type in a pie chart for the last 24 hours.
Logins
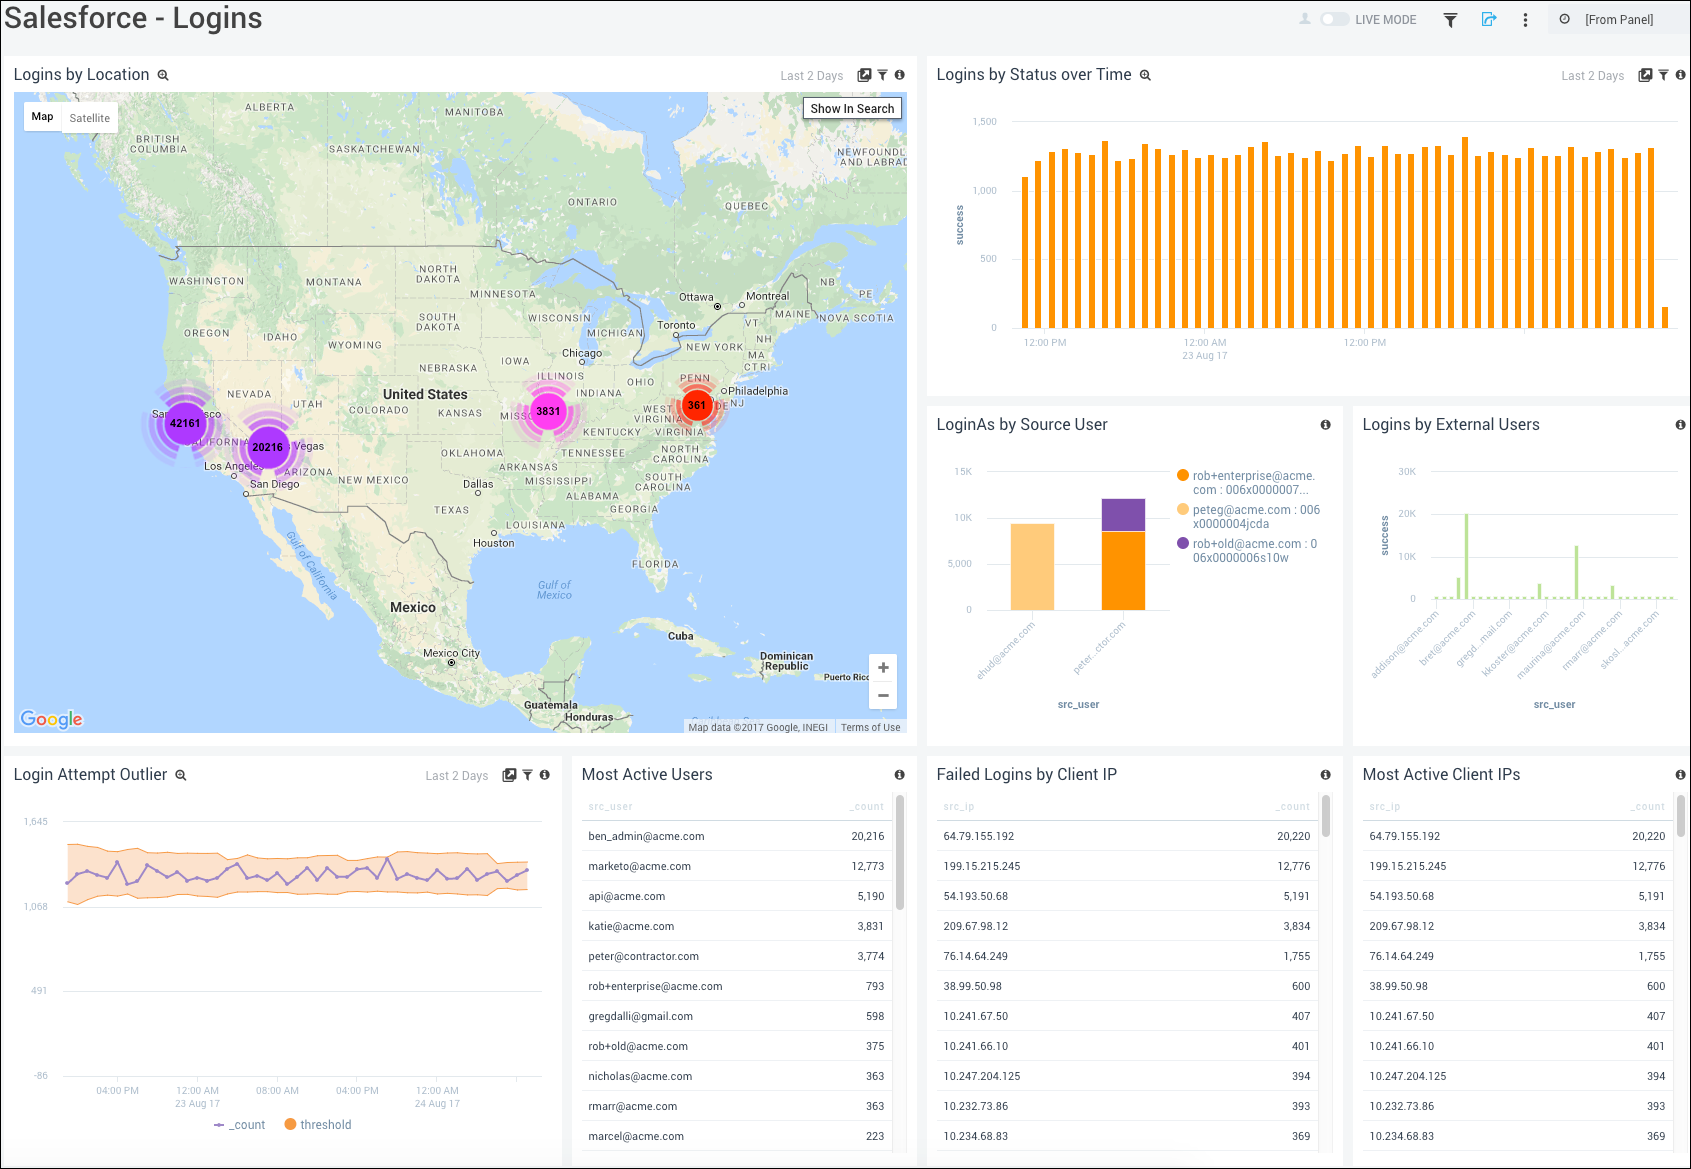
Logins by Location. Uses a geo lookup operation to display login activity on a map of the world for the last two days.
Logins by Status Over Time. Displays successes and failures in a column chart on a timeline for the last two days.
LoginAs by Source User. Provides details on LoginAs actions by source user in a stacked column chart for the last two days.
Logins by External Users. Shows the number of logins by external users by user name on a column chart for the last two days.
Login Attempt Outlier. Performs an outlier operation to display login attempts on a timeline for the last two days.
Most Active Users. Displays the most active users in a table chart including details on the user name and count for the last two days.
Failed Logins by Client IP. Shows details of failed logins by client IP address including information on the client IP address and the count for the last two days.
Most Active Client IPs. Displays the most active client IP addresses in a table chart including details on the client IP address and count for the last two days.
Report Performance
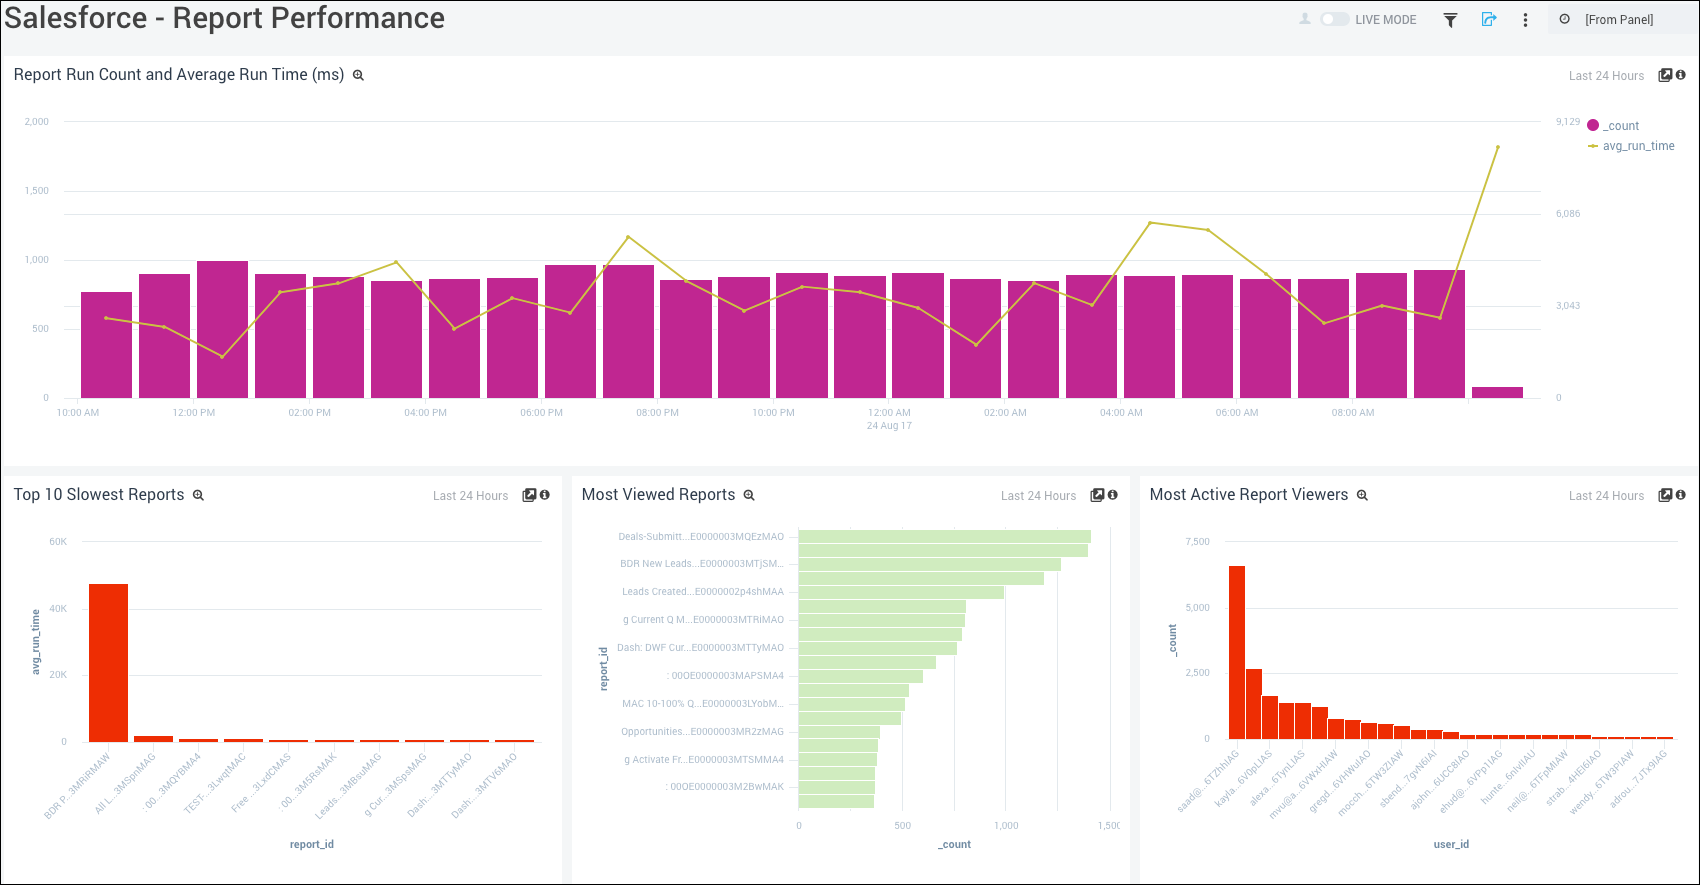
Report Run Count and Average Run Time (ms). Displays the report run count (bar chart) and the average run time (line chart) in milliseconds in a combo chart on a timeline for the last 24 hours.
Top 10 Slowest Reports. Shows the top 10 slowest reports by count and report ID on a column chart for the last 24 hours.
Most Viewed Reports. Provides details on the most viewed reports by count and report ID in a bar chart for the last 24 hours.
Most Active Report Viewers. Displays the most active report viewed by count and user ID on a column chart for the last 24 hours.
Setup Audit Activity
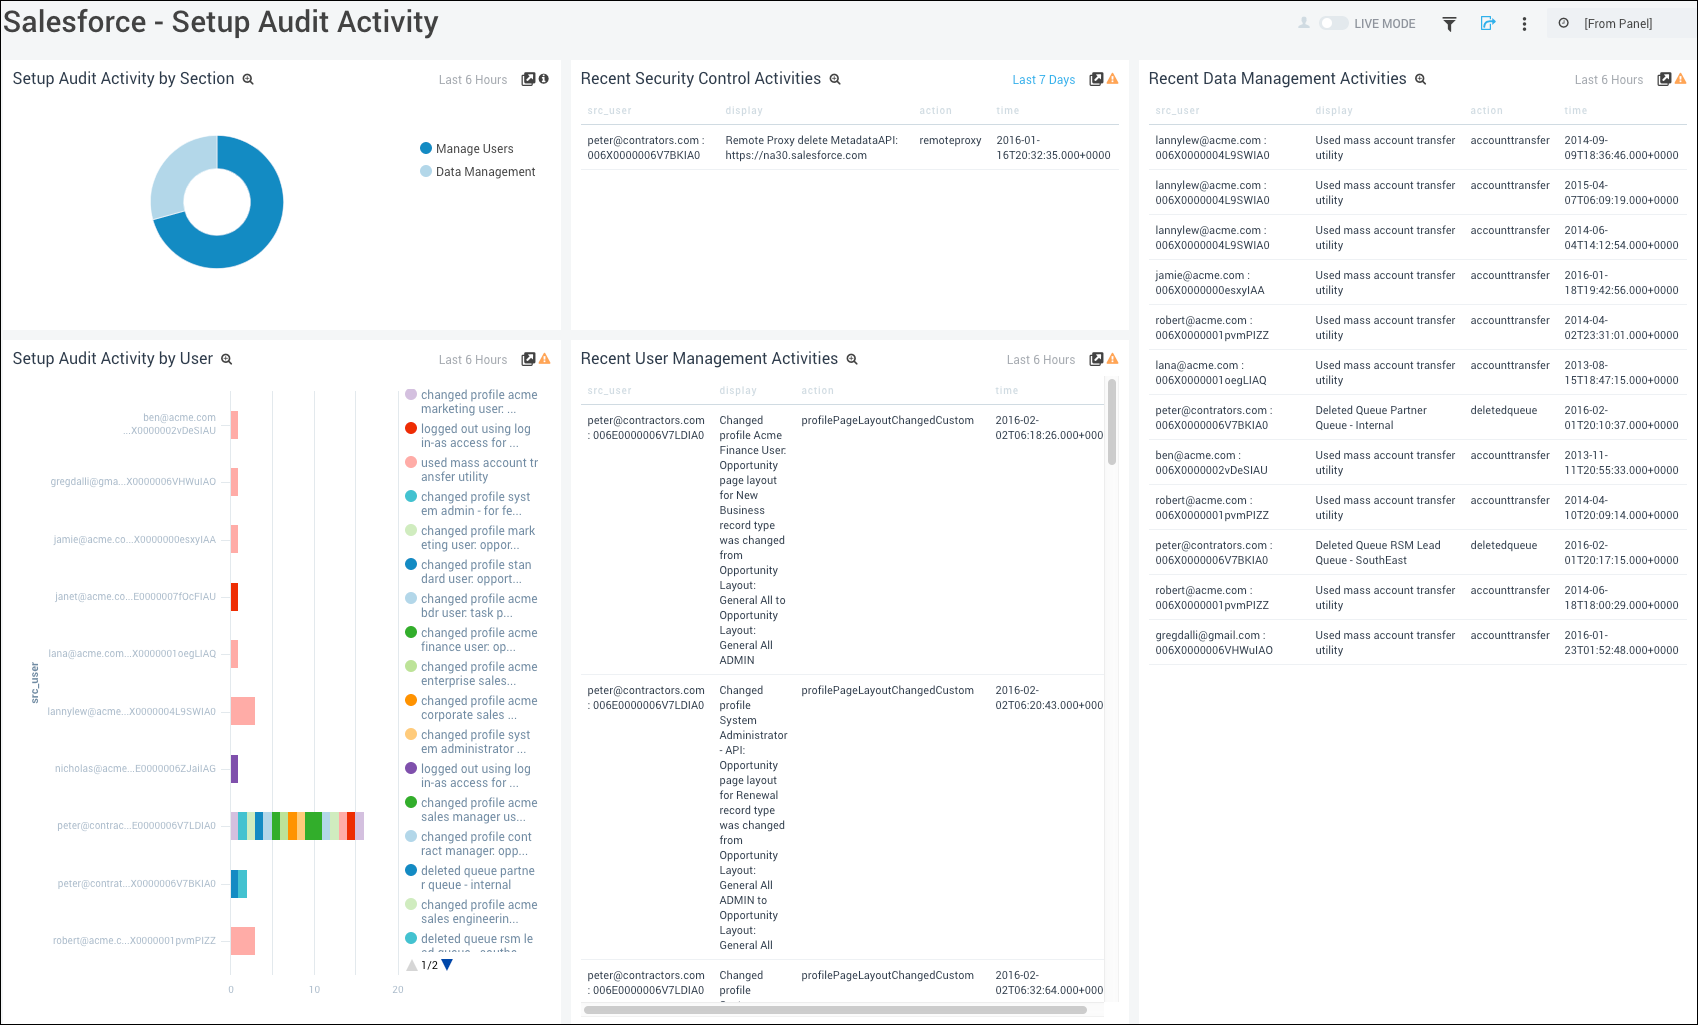
Setup Audit Activity by Section. Displays setup audit activity by section in a pie chart for the last two days.
Recent Security Control Activities. Provides details on recent security control activities in a table chart including information on the source user, display, action, and time for the last two days.
Recent Data Management Activities. Provides details on recent data management activities in a table chart including information on the source user, display, action, and time for the last two days.
Setup Audit Activity by User. Shows setup audit activity by user and by count in a stacked bar chart for the last two days.
Recent User Management Activities. Displays information on recent user management activities in a table chart including details on the source user, display, action, and time for the last two days.
User Activity - Content
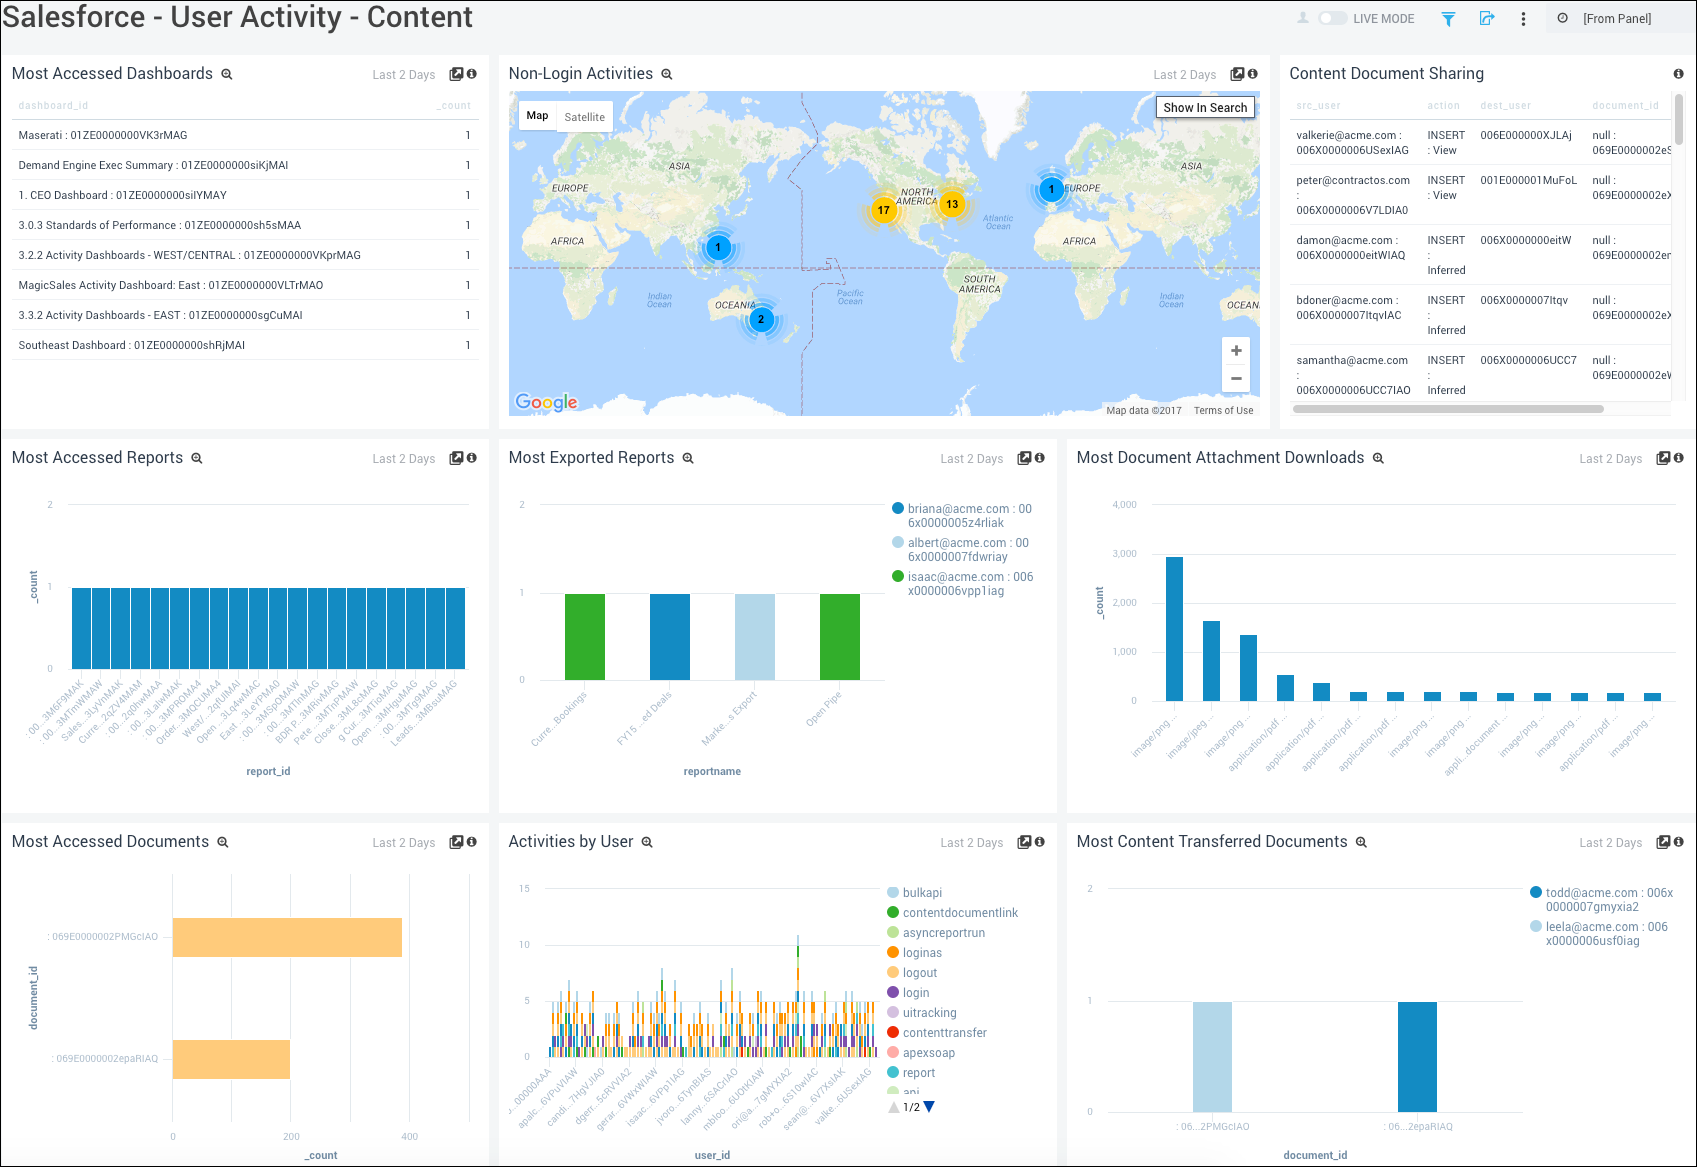
Most Accessed Dashboards. Displays the Dashboards most often accessed by users in a pie chart for the last two days.
Non-Login Activities. Performs a geo lookup operation and displays the IP address location of non-login activities on a map of the world for the last two days.
Content Document Sharing. Provides details on documents shared by users in a table chart including information on the source user, action, destination user, document ID and count for the last two days.
Most Accessed Reports. Shows the reports most often accessed by users and the count in a column chart for the last two days.
Most Exported Reports. Displays details on the reports most exported by users in a column chart by report name and count for the last two days.
Most Document Attachment Downloads. Displays information on the documents with attachments that were most often downloaded by users in a column chart by attachment name, type, and count for the last two days.
Most Accessed Documents. Provides details on the documents most accessed by users in a bar chart by count for the last two days.
Activities by User. Shows information on activities by user in a stacked column chart for the last two days.
Most Content Transferred Documents. Shows details on documents with content that were most often transferred by users in a column chart by document ID and count for the last two days.
User Activity - Monitoring
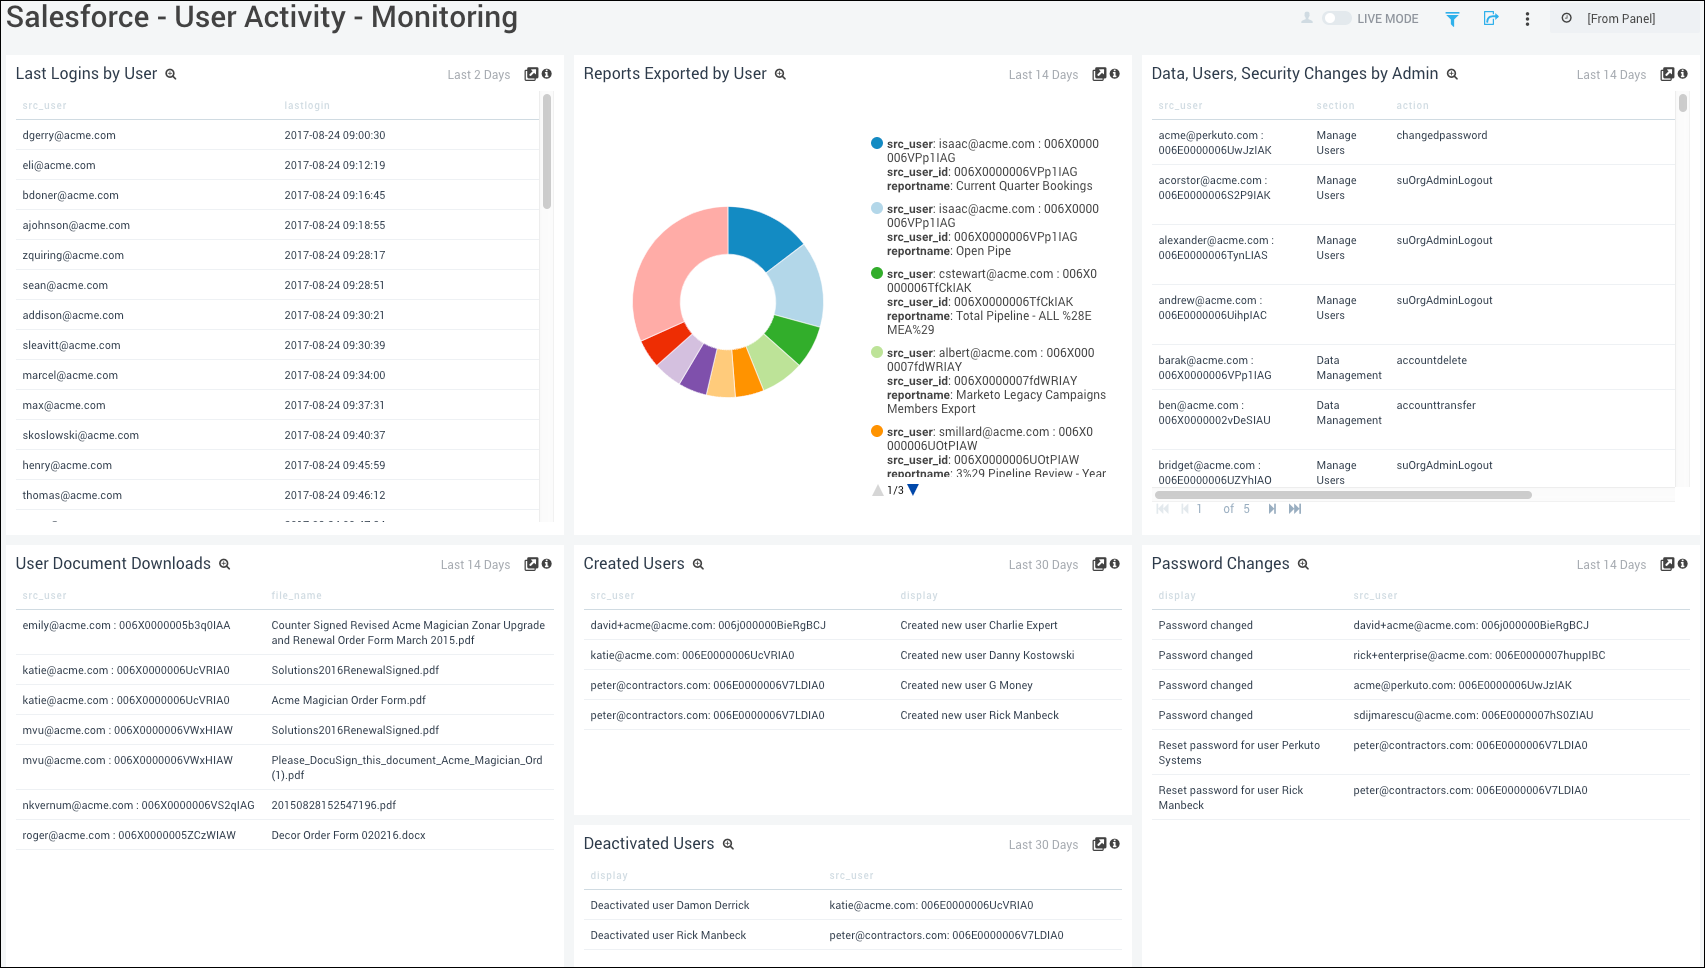
Last login by User. Displays the details of last logins by user in the last two days including the user name and last login time.
Reports Exported by User. Shows the count of reports exported by user including the user name, user ID, and report name in the last 14 days on a pie chart.
Data, Users, Security Changes by Admin. Displays the details of data, user, and security changes performed by admin in the last 14 days including the user ID, section, and action performed.
User Document Downloads. Shows the details of user documents downloaded in the last 14 days including the user ID, and file name.
Created Users. Displays the details of users created in the last 30 days including the source user ID and the description of the action performed.
Password Changes. Displays the details of password changes in the last 14 days including the source user ID and the description of the action performed.
Deactivated Users. Displays the details of users deactivated in the last 30 days including the source user ID and the description of the action performed.
User Agents
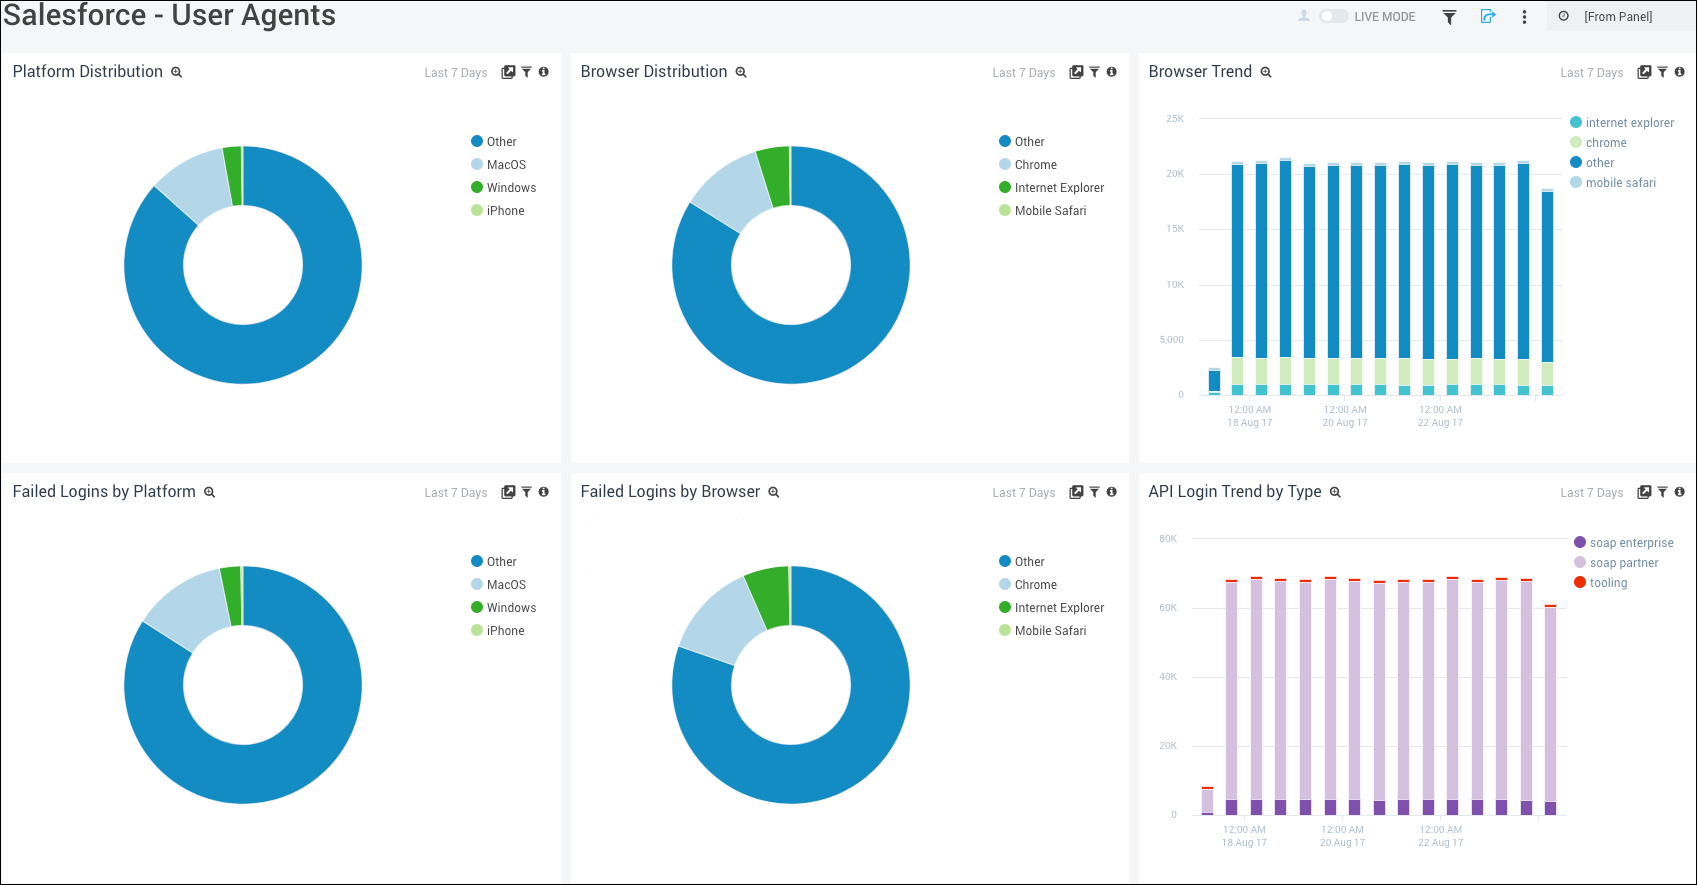
Platform Distribution. Displays the distribution of operating system type used by users in a pie chart for the last seven days.
Browser Distribution. Provides information on the web browser distribution used by users in a pie chart for the last seven days.
Browser Trend. Shows the number and type of web browsers used to login in a stacked column chart on a timeline for the last seven days.
Failed Logins by Platform. Shows details on failed logins by operating system platform in a pie chart for the last seven days.
Failed Logins by Browser. Displays details of failed logins by web browser in a pie chart for the last seven days.
API Login Trend by Type. Provides details on the number and type of APIs used to login in a stacked column chart on a timeline for the last seven days.

