Sumo Logic App for Palo Alto Networks 6

The Palo Alto Networks 6 App provides four dashboards, giving you several ways to discover threats, consumption, traffic patterns, and other security-driven issues, providing additional insight for investigations.
Log Types
Parsing in the Palo Alto Networks 6 App for PAN 6 is based on the PAN-OS Syslog integration.
Sample Log Messages
<12>Dec 22 13:22:14 PA-5050 1,2016/12/22 13:22:14,002201002211,THREAT,vulnerability,1,2016/12/22 13:22:14,77.200.181.165,208.74.205.51,0.0.0.0,0.0.0.0,Alert Logging,,,web-browsing,vsys1,IDS,IDS,ethernet1/21,ethernet1/21,Sumo_Logic,2016/12/22 13:22:14,34403128,1,59305,80,0,0,0x80000000,tcp,alert,"1794",HTTP SQL Injection Attempt(38195),any,medium,client-to-server,128764886,0x0,NL,US,0,,1345817091864062106,,,1,,,,,,,,0

<11>Dec 22 13:08:28 PA-5050 1,2016/12/22 13:08:28,002201002211,THREAT,vulnerability,1,2016/12/22 13:08:28,46.148.24.108,208.74.205.51,0.0.0.0,0.0.0.0,Alert Logging,,,web-browsing,vsys1,IDS,IDS,ethernet1/21,ethernet1/21,Sumo_Logic,2016/12/22 13:08:28,34645066,1,38899,80,0,0,0x80000000,tcp,alert,"message",HTTP /etc/passwd Access Attempt(30852),any,high,client-to-server,128763724,0x0,UA,US,0,,1345817091864061211,,,1,,,,,,,,0
<14>Dec 22 16:24:05 AO-PA500-01.domain.local 1,2016/12/22 16:24:04,009401007189,TRAFFIC,drop,1,2016/12/22 16:24:04,45.55.255.28,184.18.215.26,0.0.0.0,0.0.0.0,deny untrust - logging,,,not-applicable,vsys1,untrust,untrust,ethernet1/1,,Log-Forwarding-01,2016/12/22 16:24:04,0,1,29272,2083,0,0,0x0,tcp,deny,92,92,0,1,2016/12/22 16:24:04,0,any,0,372320422,0x0,US,US,0,1,0,policy-deny,0,0,0,0,,AO-PA500-01,from-policy
Sample Queries
_sourceCategory=palo_alto_network | parse "*,*,*,*,*,*,*,*,*,*,*,*,*,*,*,*,*,*,*,*,*,*,*,*,*,*,*,*,*,*,*,*,*,*,*,*,*,*,*,*,*,*" as f1,recvTime,serialNum,type,subtype,f2,genTime,src_ip,dest_ip,natsrc_ip,natdest_ip,ruleName,src_user,dest_user,app,vsys,src_zone,dest_zone,ingress_if,egress_if,logProfile,f3,sessionID,repeatCnt,src_port,dest_port,natsrc_port,natdest_port,flags,protocol,action,misc,threatID,cat,severity,direction,seqNum,action_flags,src_loc,dest_loc,f4,content_type | count as count by subtype,severity | transpose row severity column subtype
Collecting Logs for the Palo Alto Networks 6 App
This section provides instructions on how to collect logs for the Palo Alto Networks 6 App, as well as log and query samples.
Prerequisites
- Configure Syslog Monitoring for your Palo Alto Networks device, as described in Configure Syslog Monitoring in Palo Alto Networks help.
- This app supports Palo Alto Networks v6.
Configure a Collector
Configure an Installed Collector or a Hosted source for Syslog-ng or Rsyslog.
Configure a Source
For Syslog, configure the Source fields:
- Name. (Required) A name is required.
- Description. Optional.
- Protocol. UDP or TCP
- Port. Port number.
- Source Category. (Required) The Source Category metadata field is a fundamental building block to organize and label Sources. For details see Best Practices.
- Click Save.
For a Hosted source, use advanced settings as necessary, but save the endpoint URL associated in order to configure Palo Alto Networks.
Field Extraction Rules
When creating a Field Extraction Rule, you have the option to select from a template for Palo Alto Networks.
It is recommended that you add THREAT as a keyword in the scope for the rule.
parse "*,*,*,*,*,*,*,*,*,*,*,*,*,*,*,*,*,*,*,*,*,*,*,*,*,*,*,*,*,*,*,*,*,*,*,*,*,*,*,*,*,*"
as f1,recvTime,serialNum,type,subtype,f2,genTime,src_ip,dest_ip,natsrc_ip,natdest_ip,
ruleName,src_user,dest_user,app,vsys,src_zone,dest_zone,ingress_if,egress_if,logProfile,
f3,sessionID,repeatCnt,src_port,dest_port,natsrc_port,natdest_port,flags,protocol,action,
misc,threatID,cat,severity,direction,seqNum,action_flags,src_loc,dest_loc,f4,content_type
Installing the Palo Alto Networks 6 App
Now that you have set up collection for Palo Alto Networks, install the Sumo Logic App for Palo Alto Networks to use the preconfigured searches and dashboards that provide insight into your data.
To install the app:
Locate and install the app you need from the App Catalog. If you want to see a preview of the dashboards included with the app before installing, click Preview Dashboards.
- From the App Catalog, search for and select the app.
- Select the version of the service you're using and click Add to Library.
Version selection is applicable only to a few apps currently. For more information, see the Install the Apps from the Library.
- To install the app, complete the following fields.
- App Name. You can retain the existing name, or enter a name of your choice for the app.
- Data Source. Select either of these options for the data source.
- Choose Source Category, and select a source category from the list.
- Choose Enter a Custom Data Filter, and enter a custom source category beginning with an underscore. Example: (
_sourceCategory=MyCategory).
- Advanced. Select the Location in Library (the default is the Personal folder in the library), or click New Folder to add a new folder.
- Click Add to Library.
Once an app is installed, it will appear in your Personal folder, or other folder that you specified. From here, you can share it with your organization.
Panels will start to fill automatically. It's important to note that each panel slowly fills with data matching the time range query and received since the panel was created. Results won't immediately be available, but with a bit of time, you'll see full graphs and maps.
Viewing PAN 6 Dashboards
Overview
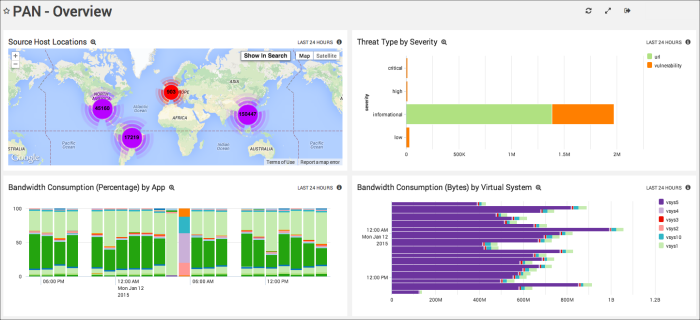
The Overview Dashboard keeps you up-to-speed on the higher level operations of your PAN deployment.

Source Host Locations. Using a geolocation query, this Panel maps the location of source hosts using their IP addresses.
Threat Type by Severity. Breaks down the number of threats, ranked by severity; threat types are divided into separate categories (such as Vulnerabilities and URL). Threat types displayed in this Panel include Low, Informational, High, and Critical.
Bandwidth Consumption (Bytes) by Virtual System. Displays the bandwidth of virtual systems, making it easy to see which systems are consuming the most bandwidth.
Bandwidth Consumption (Percentage) by App. Each app deployed by your organization is represented in an overall breakdown of how apps are consuming bandwidth.
Threat Analysis

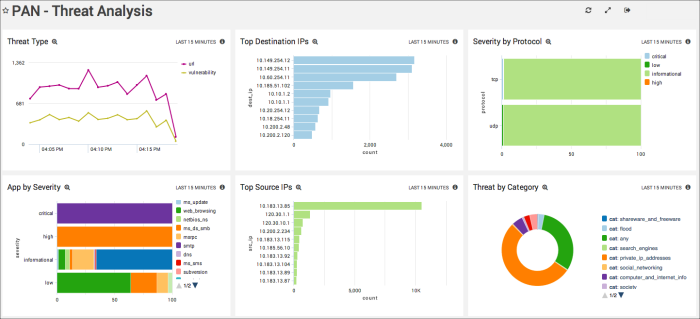
Threat Type. Get an idea of the number of threats as well as the type of threats detected by Palo Alto Networks. Top Destination IPs. Shows the top 10 destination IPs (the IPs that have made the most attempts).
Top Destination IPs. Ranks the top 10 destination IPs as a bar chart.
Severity by Protocol. View the number of threats sorted by severity (Critical, High, Low, or Informational).
App by Severity. Shows the breakdown of threats per app, sorted by threat level (Critical, High, Informational, and Low).
Top Source IPs. Ranks the top 10 source IPs hitting your firewall as a bar chart.
Threat by Category. The query behind this Panel parses the threat ID and category from your Palo Alto Network logs, then returns the number of threats sorted by category.
Traffic Monitoring
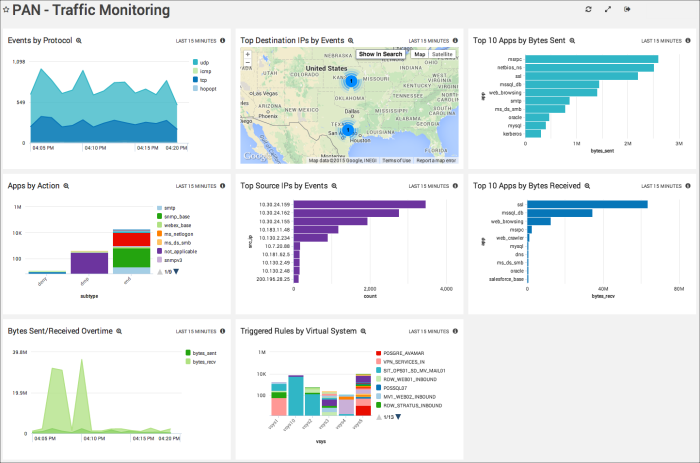
The Traffic Monitoring Dashboard includes several Panels that display information about incoming and outgoing traffic, including bytes sent and received.

Events by Protocol. Displays the breakdown of events, sorted by protocol (ICMP, TCP, UDP, HOPOPT).
Top Destination IPs by Events. Using a geolocation query, this Panel maps which IPs are being accessed outside the network for all event types.
Top 10 Apps by Bytes Sent. Shows which apps are being sent the most bytes.
Apps by Action. This Panel queries all traffic types and then displays each app per drop, denial, and success.
Top Source IPs by Events. Displays the top 10 IPs generating events.
Top 10 Apps by Bytes Received. Traffic from the 10 most active apps is shown, making unexpected upticks in traffic easy to identify.
Bytes Sent/Received Overtime. Keep an eye on the overall inbound and outbound traffic in your deployment.
Triggered Rules by Virtual System. Including all existing trigger rules, this Panel displays traffic from each virtual system in your deployment.
Generic
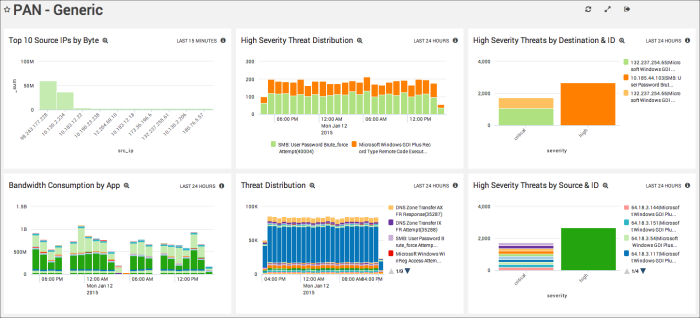
This advanced Dashboard includes specialized, targeted Panels that are typically used by IT Admins.

Top 10 Source IPs by Byte. Watch for unexpected spikes in traffic from the top 10 Source IP addresses.
High Severity Threat Distribution. Displays the severity of threats over the past hour.
High Severity Threats by Destination & ID. Counted by the number of threats coming from specific destinations and IP addresses, Critical and High severity threats are shown.
Bandwidth Consumption by App. View the total bandwidth consumed by each app in one place.
Threat Distribution. Displays the source of threats as well as the number of threats over the past 24 hours.
High Severity Threats by Source & ID. No need to guess where Critical and High threats are coming from. This Panel displays each threat source.

