Sumo Logic App for Palo Alto Networks 8

Palo Alto Networks (PAN) 8 provides a next generation firewall and the Traps Endpoint Security Manager. The Palo Alto Networks 8 App gives you visibility into firewall and traps activity, including information about firewall configuration changes, details about rejected and accepted firewall traffic, traffic events that match the Correlation Objects and Security Profiles you have configured in PAN, and events logged by the Traps Endpoint Security Manager.
Log Types
Parsing in the Sumo Logic app for PAN 8 is based on the PAN-OS Syslog Integration and uses the following log types:
| Log type | Description | Supported log format | For more information |
| Traffic | Entries for the start and end of each session, including date and time; source and destination zones, addresses and ports; application name; security rule applied to the traffic flow; rule action (allow, deny, or drop); ingress and egress interface; number of bytes; and session end reason. | Syslog | Traffic Logs |
| Threat | Events logged when traffic matches one of the Security Profiles attached to a security rule on the firewall. | Syslog | Threat Logs |
| System | Information about system events on the Palo Alto Networks Device. | Syslog | System Logs |
| Config Logs | Information about Palo Alto Networks Device configuration changes. | Syslog | Configuration |
| Correlation | Events logged by firewall when patterns and thresholds defined in a Correlation Object match the traffic patterns on your network. | Syslog | Correlation Logs |
| TrapsV4 | Events logged by the Traps Endpoint Security component. | Common Event Format (CEF) | CEF Format |
Sample Log Messages
Sep 05 12:30:11 SumoStg05 1,2018/09/05 12:30:11,012345678902,CONFIG,0,0,2018/09/05 12:30:11,34.75.147.122,,commit-all,duc,Panorama,Succeeded,,0123456789,0x8000000000000000,0,0,0,0,,SumoStg05
Sep 05 12:00:22 1,2018/09/05 12:00:22,012345678902,CORRELATION,,,2018/09/05 12:00:22,11.95.8.142,npande,,compromised-host,medium,0,0,0,0,,us2,,beacon-heuristics,6005,"Host visited known malware URL (100 times).
Sep 05 12:40:15 SumoQA01a 0,2018/09/05 12:40:15,012345678902,SYSTEM,url-filtering,0,2018/09/05 12:40:15,,upgrade-url-database-success,,0,0,general,informational,PAN-DB was upgraded to version 20170529.40084.,538241,0x8000000000000000,0,0,0,0,,SumoQA01a
Sep 05 12:44:11 SumoStg05 0,2018/09/05 12:44:11,012345678902,THREAT,vulnerability,0,2018/09/05 12:44:11,174.234.40.32,240.84.174.144,,,General Web Infrastructure,,duc,web-browsing,vsys1,z2-FW-Sumo-Internal,inside,ethernet1/2,ethernet1/2,LOGreset-both,2018/09/05 12:44:11,320228,1,80,1296,0,0,0x2000,tcp,alert,"adcount.ohmynews.com/js.kti/ohmynews2007/article70@thumbnail3",Suspicious Abnormal HTTP Response Found(40397),news,informational,server-to-client,1077387368,0x8000000000000000,India,10.0.0.0-10.255.255.255,0,,0,,,1,,,,,,,,0,31,43,0,0,,us3,,,,,0,,0,,N/A,protocol-anomaly,AppThreat-52239-48642,0x0
Sep 05 12:45:15 SumoStg05 0,2018/09/05 12:45:15,012345678901,TRAFFIC,end,0,2018/09/05 12:45:15,182.80.119.50,176.164.175.181,,,Unexpected Traffic,,npande,ping,vsys3,z1-FW-Transit,z3-Sumo-DMZ,ethernet1/2,ethernet1/2,LOGreset-both,2018/09/05 12:45:15,9434,1,0,0,0,0,0x100064,icmp,allow,122,122,0,1,2018/09/05 12:45:15,0,any,0,5134220147,0x8000000000000000,United States,10.0.0.0-10.255.255.255,0,1,0,aged-out,31,42,0,0,,SumoStg05,from-policy,,,0,,0,,N/A
Sep 05 12:30:15 Host CEF:0|Palo Alto Networks|Traps Agent|3.4.3.19949|Client License Request|Agent|3|rt=Sep 05 12:30:15 dhost=preprod_Linux_SumoQA01a duser=administrator msg=New license request
Sample Queries
_sourceCategory=Loggen/PAN/Threat THREAT (virus or "wildfire-virus")
| csv _raw extract 1 as f1, 2 as Receive_Time, 3 as serialNum, 4 as type, 5 as subtype, 6 as f2, 7 as LogGenerationTime, 8 as src_ip, 9 as dest_ip, 10 as NAT_src_ip, 11 as NAT_dest_ip, 12 as ruleName, 13 as src_user, 14 as dest_user, 15 as app, 16 as vsys, 17 as src_zone, 18 as dest_zone, 19 as inbound_interface, 20 as outbound_interface, 21 as LogAction, 22 as f3, 23 as SessonID, 24 as RepeatCount, 25 as src_port, 26 as dest_port, 27 as NAT_src_port, 28 as NAT_dest_port, 29 as flags, 30 as protocol, 31 as action, 32 as urlORFileName, 33 as Threat_Content_Name, 34 as category, 35 as severity, 36 as direction, 37 as seqNum, 38 as action_flags, 39 as src_country, 40 as dest_country, 41 as f4, 42 as content_type, 43 as pcap_id, 44 as filedigest, 45 as cloud, 46 as url_idx, 47 as user_agent, 48 as filetype, 49 as xff, 50 as referer, 51 as sender, 52 as subject, 53 as recipient, 54 as reportid, 55 as Device_Group_Hierarchy, 56 as vsys_name, 57 as DeviceName, 58 as f5, 59 as Source_VM_UUID, 60 as Destination_VM_UUID, 61 as Parent_Session_ID, 62 as Tunnel_ID_IMSI, 63 as Monitor_Tag_IMEI, 64 as method, 65 as parent_start_time, 66 as Tunnel, 67 as thr_category, 68 as contentver, 69 as f6, 70 as SCTP_Association_ID, 71 as Payload_Protocol_ID, 72 as http_headers
| where type = "THREAT" and subtype in ("virus","wildfire-virus") and severity != "informational"
| count as eventCount by Severity
| sort by eventCount, Severity
Collecting Logs for the Palo Alto Networks 8 App
This section has instructions for collecting logs for the Palo Alto Networks 8 App, as well as examples of field extraction rules, logs, and queries.
Prerequisites
- Configure Syslog Monitoring for your Palo Alto Networks device, as described in Configure Syslog Monitoring in Palo Alto Networks help.
- This app supports Palo Alto Networks v7 and v8.
- Parsing in the Sumo Logic app for PAN 8 is based on the information described in these documents:
Refer PAN-OS 8 and PAN-OS 8.1 documentation for devices supporting Correlated Event Logs.
Configure a collector and source
In this step you configure a installed collector with a Syslog source that will act as Syslog server to receive logs and events from Palo Alto Networks 8 devices.
- Configure an Installed Collector
- Add a Syslog source to the installed collector:
- Name. (Required) A name is required.
- Description. Optional.
- Protocol. UDP or TCP. Choose the protocol you configured in Palo Alto Networks 8 for Syslog monitoring.
- Port. Port number. Choose the port you configured in Palo Alto Networks 8 for Syslog monitoring.
- Source Category. (Required) The Source Category metadata field is a fundamental building block to organize and label Sources. For details see Best Practices.
- Click Save.
Field Extraction Rules
System Log Parsing
It is recommended that you add SYSTEM as a keyword in the scope for the rule.
_sourceCategory=Loggen/PAN/System ",SYSTEM,"
| csv _raw extract 1 as f1, 2 as Receive_Time, 3 as serialNum, 4 as type, 5 as subtype, 6 as f2, 7 as LogGenerationTime, 8 as vsys, 9 as eventID, 10 as Object, 11 as f3, 12 as f4, 13 as Module, 14 as severity, 15 as description, 16 as seqNum, 17 as action_flags, 18 as Device_Group_Hierarchy, 19 as vsys_name, 20 as DeviceName
Threat Log parsing
It is recommended that you add THREAT as a keyword in the scope for the rule.
_sourceCategory=Loggen/PAN/Threat THREAT
| csv _raw extract 1 as f1, 2 as Receive_Time, 3 as serialNum, 4 as type, 5 as subtype, 6 as f2, 7 as LogGenerationTime, 8 as src_ip, 9 as dest_ip, 10 as NAT_src_ip, 11 as NAT_dest_ip, 12 as ruleName, 13 as src_user, 14 as dest_user, 15 as app, 16 as vsys, 17 as src_zone, 18 as dest_zone, 19 as inbound_interface, 20 as outbound_interface, 21 as LogAction, 22 as f3, 23 as SessonID, 24 as RepeatCount, 25 as src_port, 26 as dest_port, 27 as NAT_src_port, 28 as NAT_dest_port, 29 as flags, 30 as protocol, 31 as action, 32 as urlORFileName, 33 as Threat_Content_Name, 34 as category, 35 as severity, 36 as direction, 37 as seqNum, 38 as action_flags, 39 as src_country, 40 as dest_country, 41 as f4, 42 as content_type, 43 as pcap_id, 44 as filedigest, 45 as cloud, 46 as url_idx, 47 as user_agent, 48 as filetype, 49 as xff, 50 as referer, 51 as sender, 52 as subject, 53 as recipient, 54 as reportid, 55 as Device_Group_Hierarchy, 56 as vsys_name, 57 as DeviceName, 58 as f5, 59 as Source_VM_UUID, 60 as Destination_VM_UUID, 61 as Parent_Session_ID, 62 as Tunnel_ID_IMSI, 63 as Monitor_Tag_IMEI, 64 as method, 65 as parent_start_time, 66 as Tunnel, 67 as thr_category, 68 as contentver, 69 as f6, 70 as SCTP_Association_ID, 71 as Payload_Protocol_ID, 72 as http_headers
Correlation Log Parsing
It is recommended that you add CORRELATION as a keyword in the scope for the rule.
_sourceCategory=Loggen/PAN/Correlation ",CORRELATION,"
| csv _raw extract 1 as f1, 2 as Receive_Time, 3 as serialNum, 4 as type, 5 as subtype, 6 as f2, 7 as LogGenerationTime, 8 as src_ip, 9 as src_user, 10 as vsys, 11 as Category, 12 as Severity, 13 as Device_Group_Hierarchy, 14 as vsys_name, 15 as DeviceName, 16 as vSysID, 17 as Object_Name, 18 as Object_ID, 19 as Evidence
Configuration Log Parsing
It is recommended that you add CONFIG as a keyword in the scope for the rule.
_sourceCategory=Loggen/PAN/Config ",CONFIG,"
| csv _raw extract 1 as f1, 2 as Receive_Time, 3 as serialNum, 4 as type, 5 as subtype, 6 as f2, 7 as LogGenerationTime, 8 as src_ip, 9 as src_user, 10 as cmd, 11 as admin, 12 as client, 13 as result, 14 as path, 15 as seqno, 16 as action_flags, 17 as vsys, 18 as before_change_detail, 19 as after_change_detail, 20 as Device_Group_Hierarchy, 21 as vsys_name, 22 as DeviceName
TrapsV4 Log Parsing
_sourceCategory=Loggen/PAN/TrapsV4 CEF "|Palo Alto Networks|"
| parse "CEF:0|Palo Alto Networks|*|*|*|Agent|*|rt=* dhost=* duser=* msg=*" as TrapsComponent, productVersion, event, ExternalSeverity, rt, dhost, duser, msg nodrop
| parse "CEF:0|Palo Alto Networks|*|*|*|Policy|*|rt=* shost=* suser=* msg=*" as TrapsComponent, productVersion, event, ExternalSeverity, rt, shost, suser, msg nodrop
| parse "CEF:0|Palo Alto Networks|*|*|*|System|*|rt=* shost=* suser=* msg=*" as TrapsComponent, productVersion, event, ExternalSeverity, rt, shost, suser, msg nodrop
| parse "CEF:0|Palo Alto Networks|*|*|*|System|*|rt=* shost=* duser=* management core fname=* msg=*" as TrapsComponent, productVersion, event, ExternalSeverity, rt, shost, duser, fname, msg nodrop
| parse "CEF:0|Palo Alto Networks|*|*|*|Config|*|rt=* shost=* suser=* dhost=* msg=*" as TrapsComponent, productVersion, event, ExternalSeverity, rt, shost, suser, dhost, msg nodrop
| parse "CEF:0|Palo Alto Networks|*|*|*|Agent|*|rt=* dhost=* duser=* msg=*" as TrapsComponent, productVersion, event, ExternalSeverity, rt, dhost, duser, msg nodrop
| parse "CEF:0|Palo Alto Networks|*|*|*|Agent|*|rt=* shost=* suser=* msg=*" as TrapsComponent, productVersion, event, ExternalSeverity, rt, shost, suser, msg nodrop
| parse "CEF:0|Palo Alto Networks|*|*|*|Agent|*|rt=* dhost=* duser=* deviceProcessName=* msg=*" as TrapsComponent, productVersion, event, ExternalSeverity, rt, dhost, duser, deviceProcessName, msg nodrop
| parse "CEF:0|Palo Alto Networks|*|*|*|Agent|*|rt=* dhost=* duser=* cs4Label=* cs4=* msg=*" as TrapsComponent, productVersion, event, ExternalSeverity, rt, dhost, duser, cs4Label, cs4, msg nodrop
| parse "CEF:0|Palo Alto Networks|*|*|*|Threat|*|rt=* shost=* duser=* cs2Label=* cs2=* msg=*" as TrapsComponent, productVersion, event, ExternalSeverity, rt, shost, duser, cs2Label, cs2, msg nodrop
| parse "CEF:0|Palo Alto Networks|*|*|*|Threat|*|rt=* dhost=* duser=* cs2Label=* cs2=* deviceProcessName=* fileHash=* cs3Label=* cs3=* dvc=* msg=*" as TrapsComponent, productVersion, event, ExternalSeverity, rt, dhost, duser, cs2Label, cs2, deviceProcessName, fileHash, cs3Label, cs3, dvc, msg nodrop
| parse field = msg "Agent Service Status Changed: *-> *" as oldStatus, newStatus nodrop
| parse field = msg " received new content- version *" as contentVersion nodrop
| parse field = msg "Content version was * to * successfully" as action, contentVersion nodrop
| parse field = msg "Access Violation- child process: *" as childProcess nodrop
| parse field = msg "New Notification event. Prevention Key: *" as preventionKey nodrop
| parse field = cs2 "WildFire Unknown deviceProcessName=* fileHash=*" as deviceProcessName, fileHash nodrop
Traffic Log Parsing
It is recommended that you add TRAFFIC as a keyword in the scope for the rule.
_sourceCategory=Loggen/PAN/Traffic TRAFFIC
| csv _raw extract 1 as f1, 2 as Receive_Time, 3 as serialNum, 4 as type, 5 as subtype, 6 as f2, 7 as LogGenerationTime, 8 as src_ip, 9 as dest_ip, 10 as NAT_src_ip, 11 as NAT_dest_ip, 12 as ruleName, 13 as src_user, 14 as dest_user, 15 as app, 16 as vsys, 17 as src_zone, 18 as dest_zone, 19 as inbound_interface, 20 as outbound_interface, 21 as LogAction, 22 as f3, 23 as SessonID, 24 as RepeatCount, 25 as src_port, 26 as dest_port, 27 as NAT_src_port, 28 as NAT_dest_port, 29 as flags, 30 as protocol, 31 as action,32 as bytes, 33 as bytes_sent, 34 as bytes_recv, 35 as Packets, 36 as StartTime, 37 as ElapsedTime, 38 as Category, 39 as f4, 40 as seqNum, 41 as ActionFlags, 42 as src_Country, 43 as dest_country, 44 as pkts_sent, 45 as pkts_received, 46 as session_end_reason, 47 as Device_Group_Hierarchy , 48 as vsys_Name, 49 as DeviceName, 50 as action_source, 51 as Source_VM_UUID, 52 as Destination_VM_UUID, 53 as Tunnel_ID_IMSI, 54 as Monitor_Tag_IMEI, 55 as Parent_Session_ID, 56 as parent_start_time, 57 as Tunnel, 58 as SCTP_Association_ID, 59 as SCTP_Chunks, 60 as SCTP_Chunks_Sent, 61 as SCTP_Chunks_Received
Installing the Palo Alto Networks 8 App
This section provides instructions for installing the Palo Alto Networks 8 App, along with examples of each of the dashboards that provide visual insights into your data.
This app supports PAN-OS v7 and v8.
To install the app, do the following:
Locate and install the app you need from the App Catalog. If you want to see a preview of the dashboards included with the app before installing, click Preview Dashboards.
- From the App Catalog, search for and select the app.
- Select the version of the service you're using and click Add to Library. Version selection is applicable only to a few apps currently. For more information, see the Install the Apps from the Library.
- To install the app, complete the following fields.
- App Name. You can retain the existing name, or enter a name of your choice for the app.
- Data Source. Select either of these options for the data source.
- Choose Source Category, and select a source category from the list.
- Choose Enter a Custom Data Filter, and enter a custom source category beginning with an underscore. Example: (
_sourceCategory=MyCategory).
- Advanced. Select the Location in Library (the default is the Personal folder in the library), or click New Folder to add a new folder.
- Click Add to Library.
Once an app is installed, it will appear in your Personal folder, or other folder that you specified. From here, you can share it with your organization.
Panels will start to fill automatically. It's important to note that each panel slowly fills with data matching the time range query and received since the panel was created. Results won't immediately be available, but with a bit of time, you'll see full graphs and maps.
Viewing Palo Alto Networks 8 Dashboards
Overview
Description: See an overview of system, correlation, configuration, and trap events; threats; and bandwidth consumption by app and by virtual system.
Use case: Use this dashboard for an overview of various activities by severity level, geo-location, and bandwidth consumption. Based on the results you see, you can go to more detailed dashboards to drill down for details. For example, if the “Threats By Severity Level” panel shows that there are “Critical” threats, you can proceed to the threat-related dashboards, including Threat Overview, Threat Analysis, Traffic Insight - File Activity, and Traffic Insight - Web Activity.
Configuration Analysis
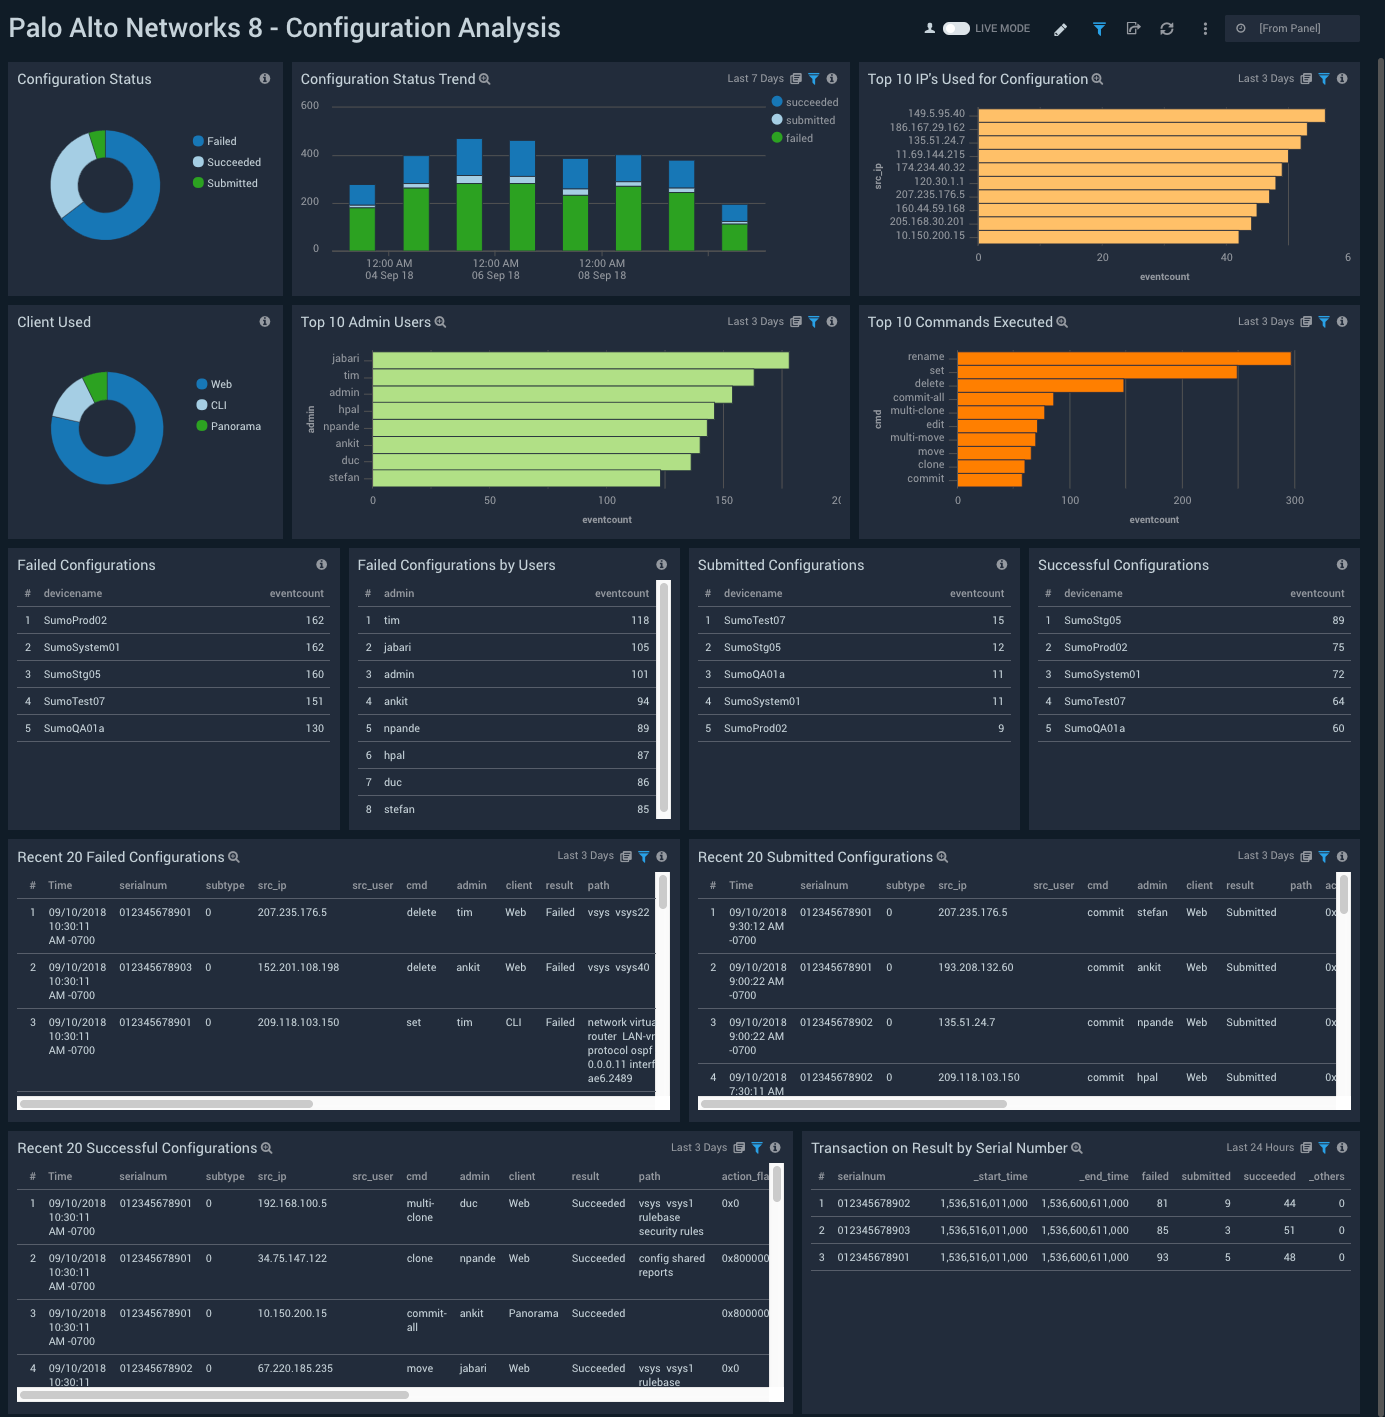
Description: See information about changes to your firewall configurations, including a breakdown of submitted, succeeded, and failed configuration updates; the trend of configuration update statuses; the top 10 IPs used for configuration changes; the top 10 admin users; and the top 10 commands executed.
Use case: Use this dashboard to learn about firewall configuration changes. You can identify who performed a configuration change, and the system from which the configuration change was made. The dashboard also helps you identify failed and successful configurations changes. If you observe a sudden change in device behavior, you can check this dashboard to investigate whether a configuration change might be to blame.
Correlation Analysis
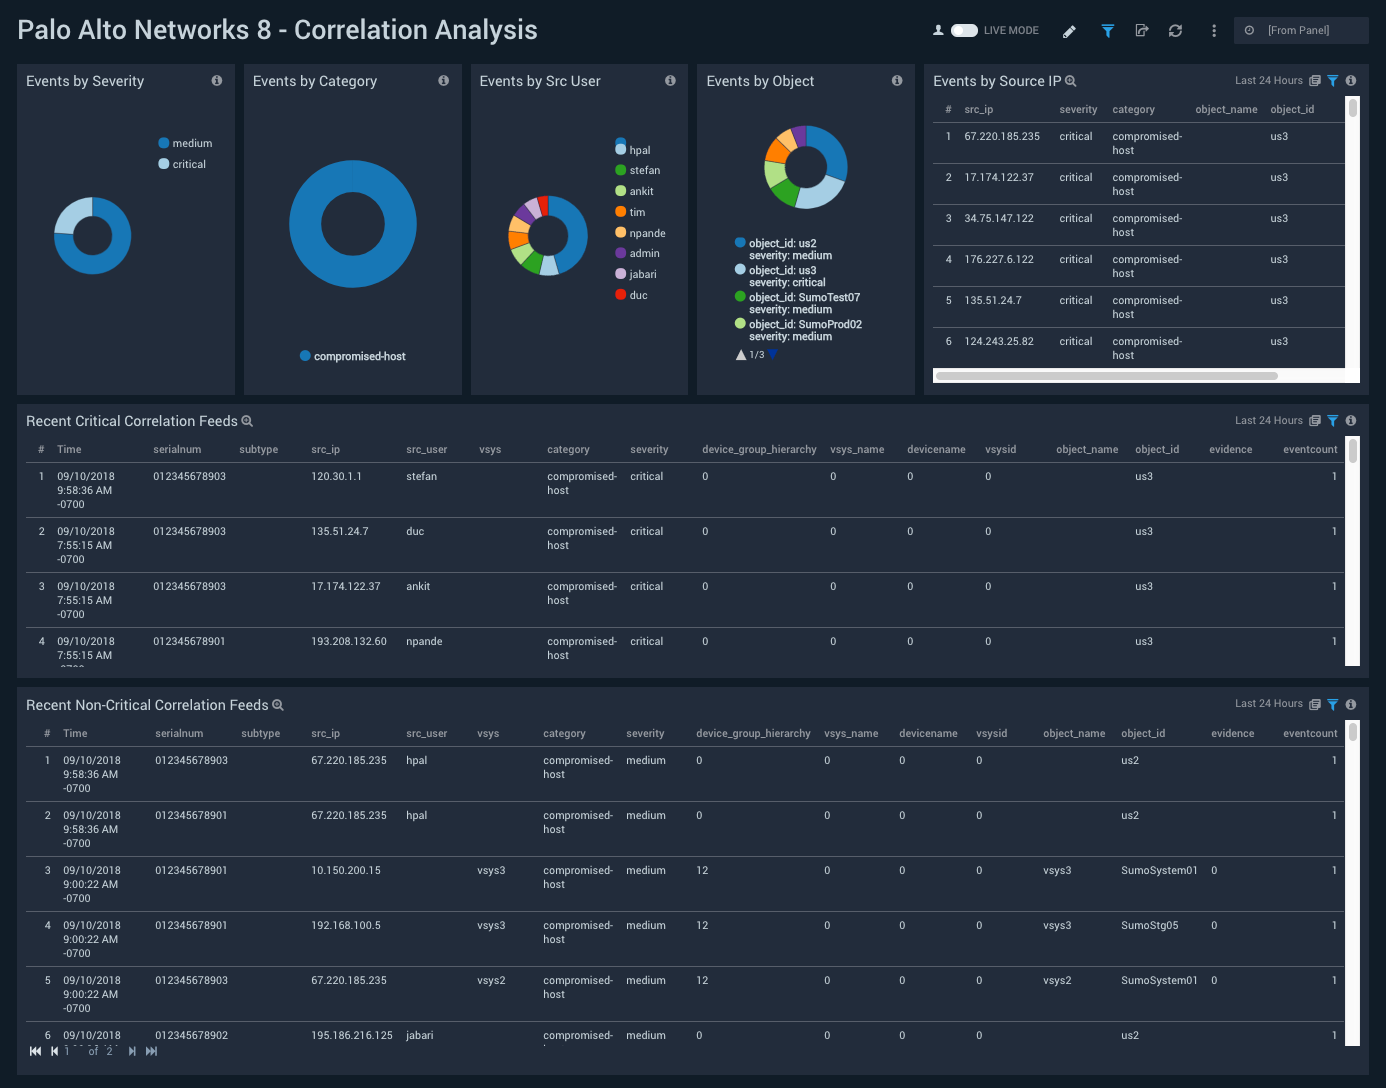
Description: See information about correlated events, including breakdowns of correlated events by severity, category, source user, and object; events by source IP; and recent correlation feeds.
Use case: Use this dashboard to identify hosts that are compromised, very likely compromised, likely compromised, or possibly compromised, based on correlation events.
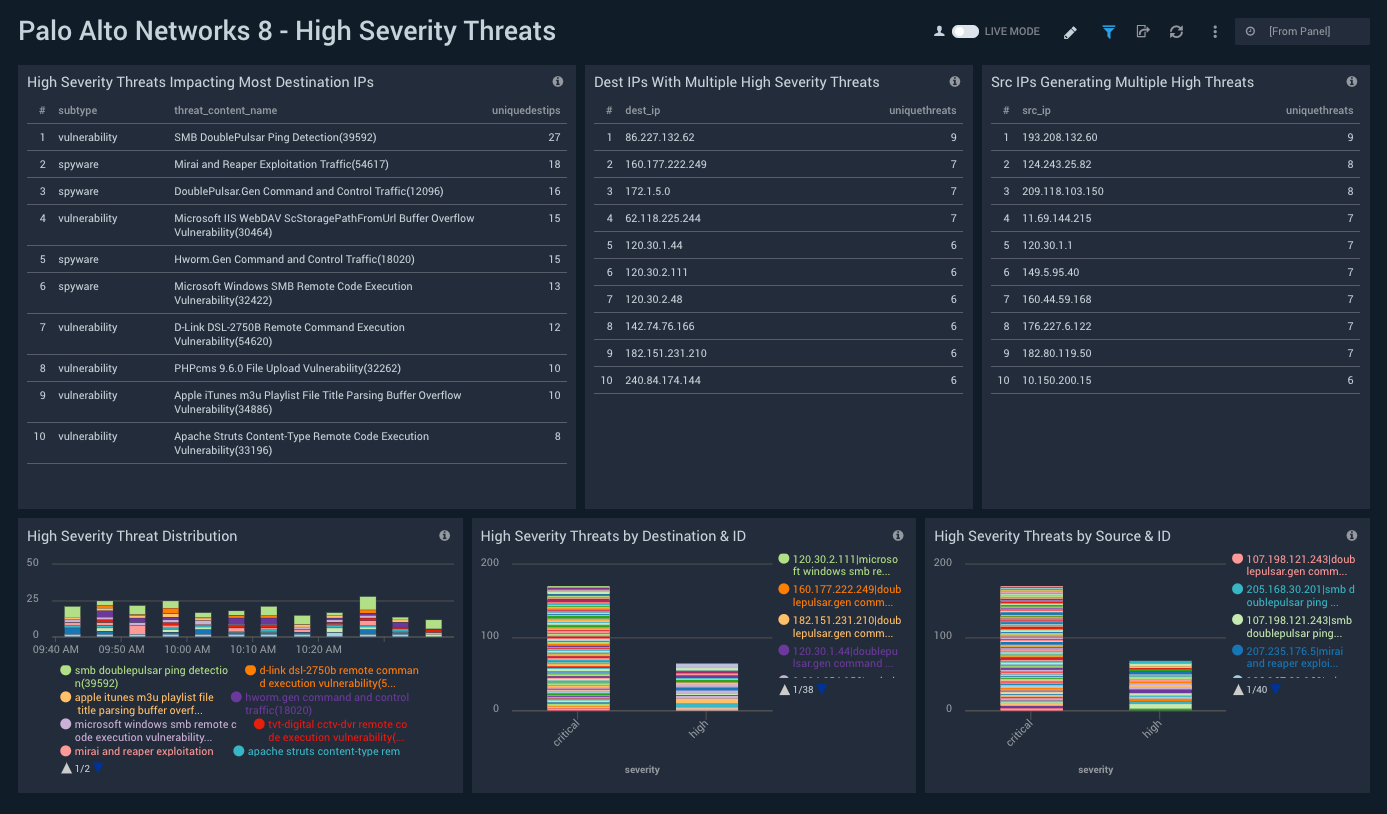
High Severity Threats
Description: See information about the top 10 source IPs by bytes; high and critical severity threats by destination ID, and by Source ID; threat distribution by severity; bandwidth consumption by app; and outlier analysis of allowed and rejected requests.
Use case: Use this dashboard to identify the impact of high severity threats, including the most involved source and destination IPs. You can identify threats affecting multiple IPs, IPs affected by multiple threats, and identify source IPs or users which are responsible for generating high severity threats or are impacted by high severity threats.
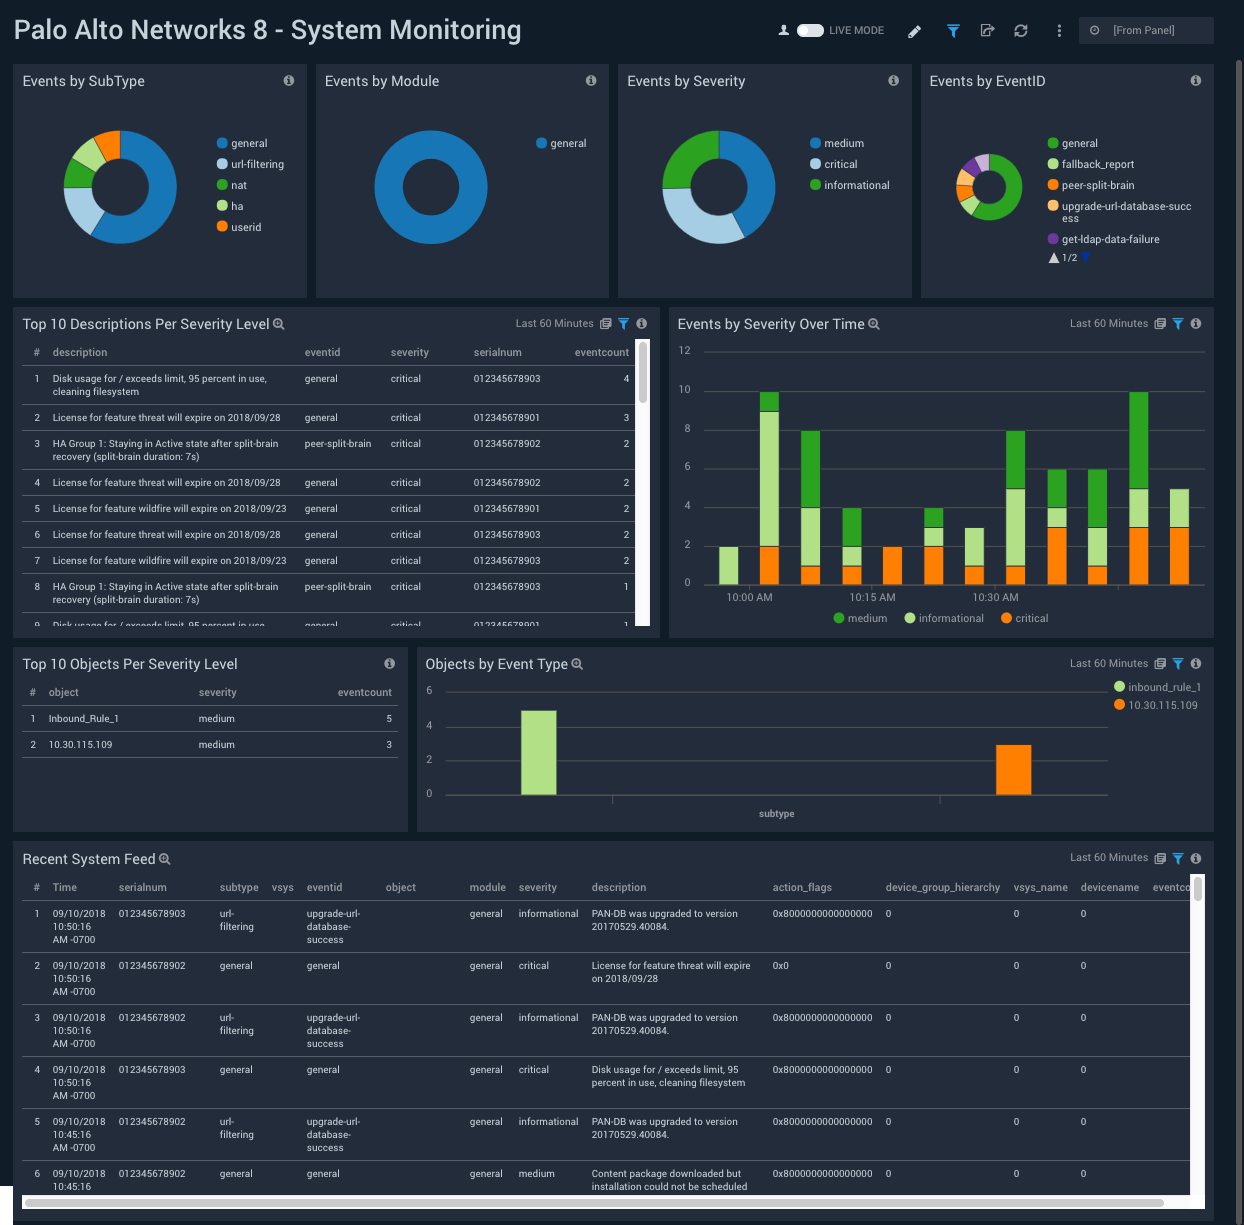
System Monitoring
Description: See breakdowns of events by subtype, module, severity, and EventID; objects by severity level and event type; and recent logs to the system feed.
Use case: Use this dashboard to identify system issues like hardware failures, HA failures, link down status, dropped connections with external devices, firmware / software upgrades, password change notifications, log in/log off, administrator name or password change, any configuration change, and other minor events.
Threat Overview
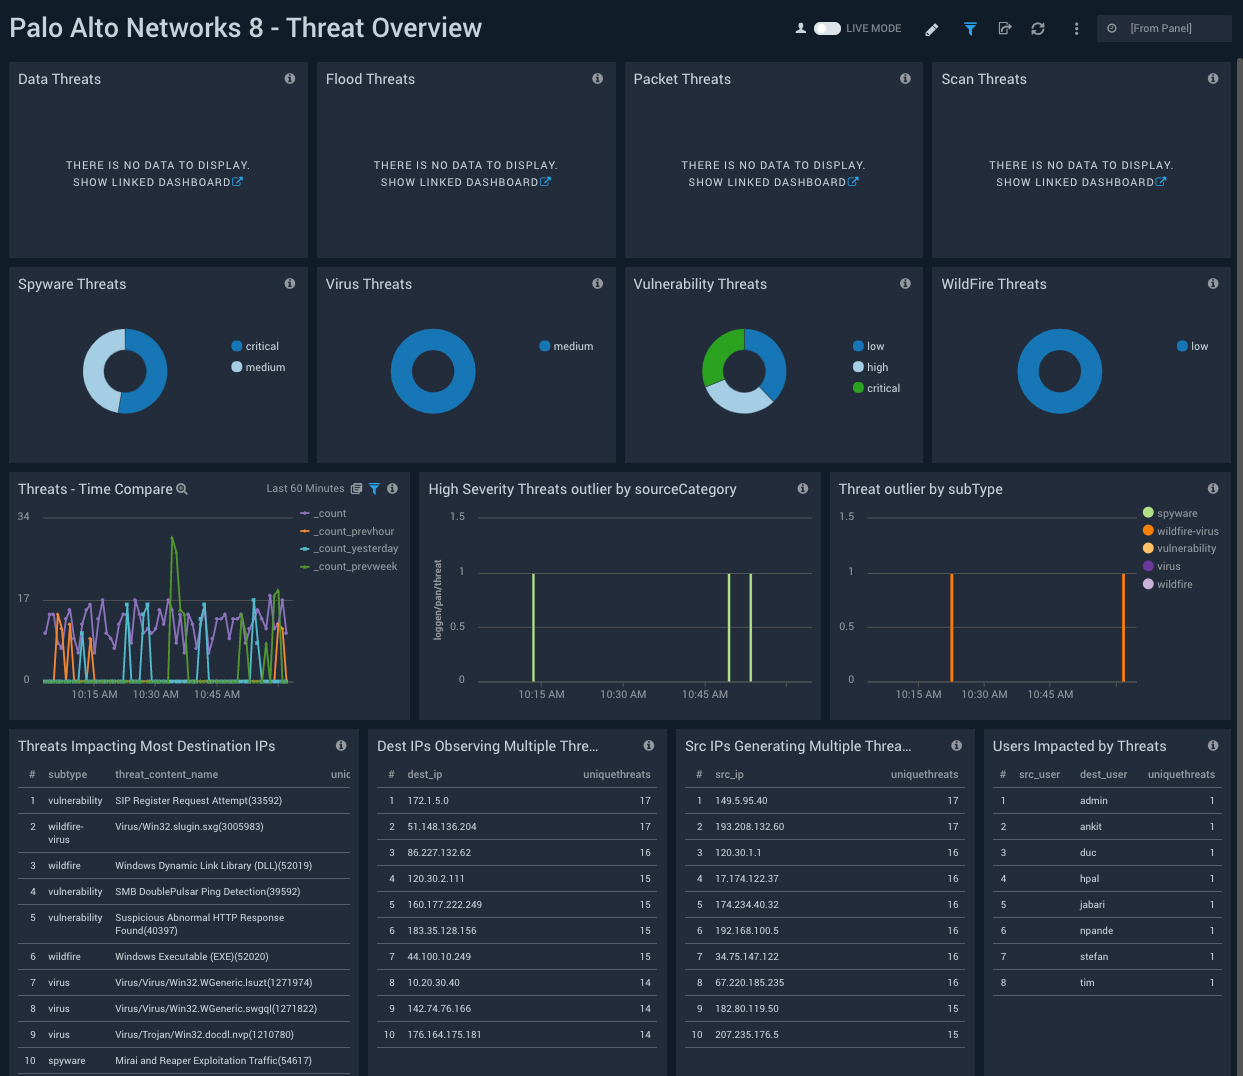
Description: See breakdowns of each threat type by severity; threat analytics, including threat outliers and a time comparison of current threats versus threats in the previous hour, day, and previous week; threats affecting the most destination IPs; IPs generating multiple threats; and IPs observing multiple threats.
Use case: Use this dashboard to identify threat subtypes. Based on what you learn, you can drill down for additional detail in the “Threat Analysis” dashboard. You can also use this dashboard to identify threats that affect multiple IPs, IPs affected by multiple threats, and narrow in on source IPs or users that are responsible for generating threats or are impacted by threats.

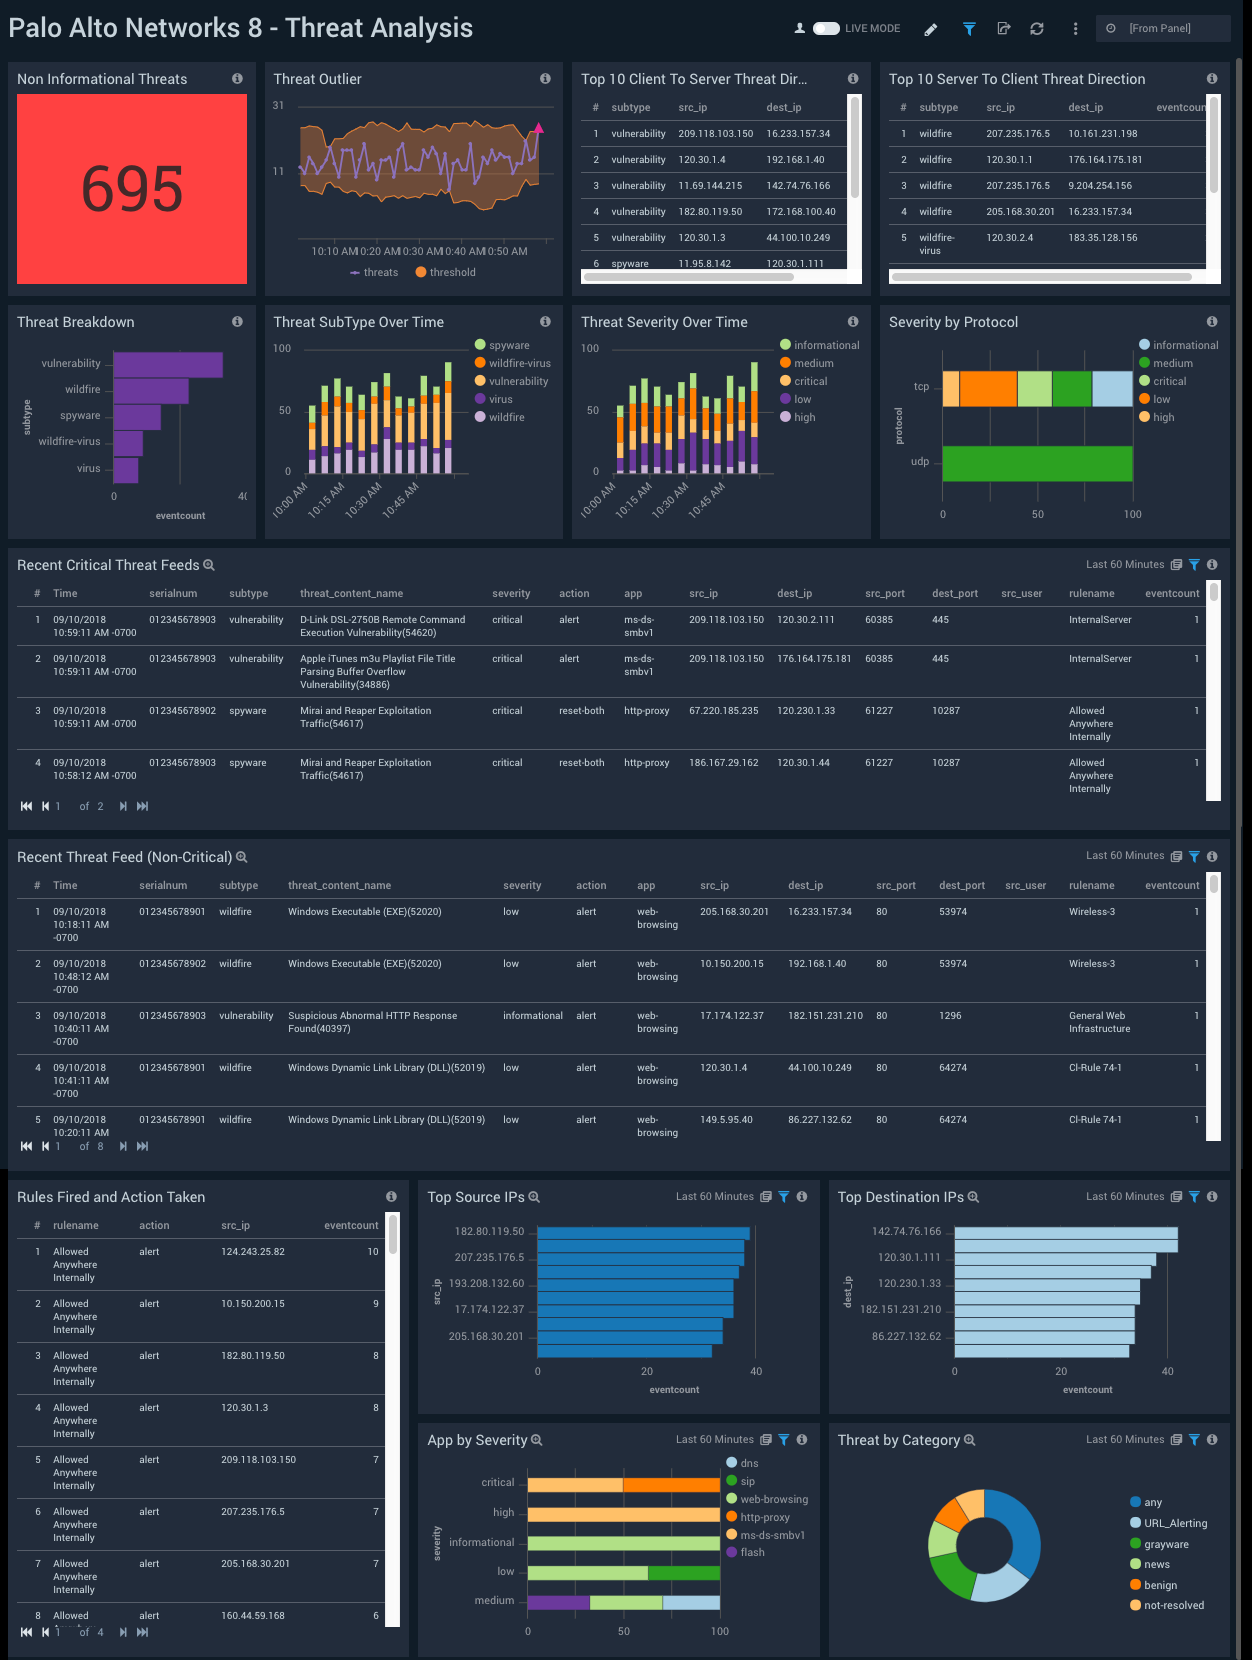
Threat Analysis
Description: See analytics and details about threats, including the count of threats whose severity is greater that “Informational”; breakdowns of threats by subtype and severity; and recent critical and non-critical threat feeds.
Use case: Use this dashboard to get detailed information on threats identified, rules fired, actions, trends, threat outliers, and threat directions.
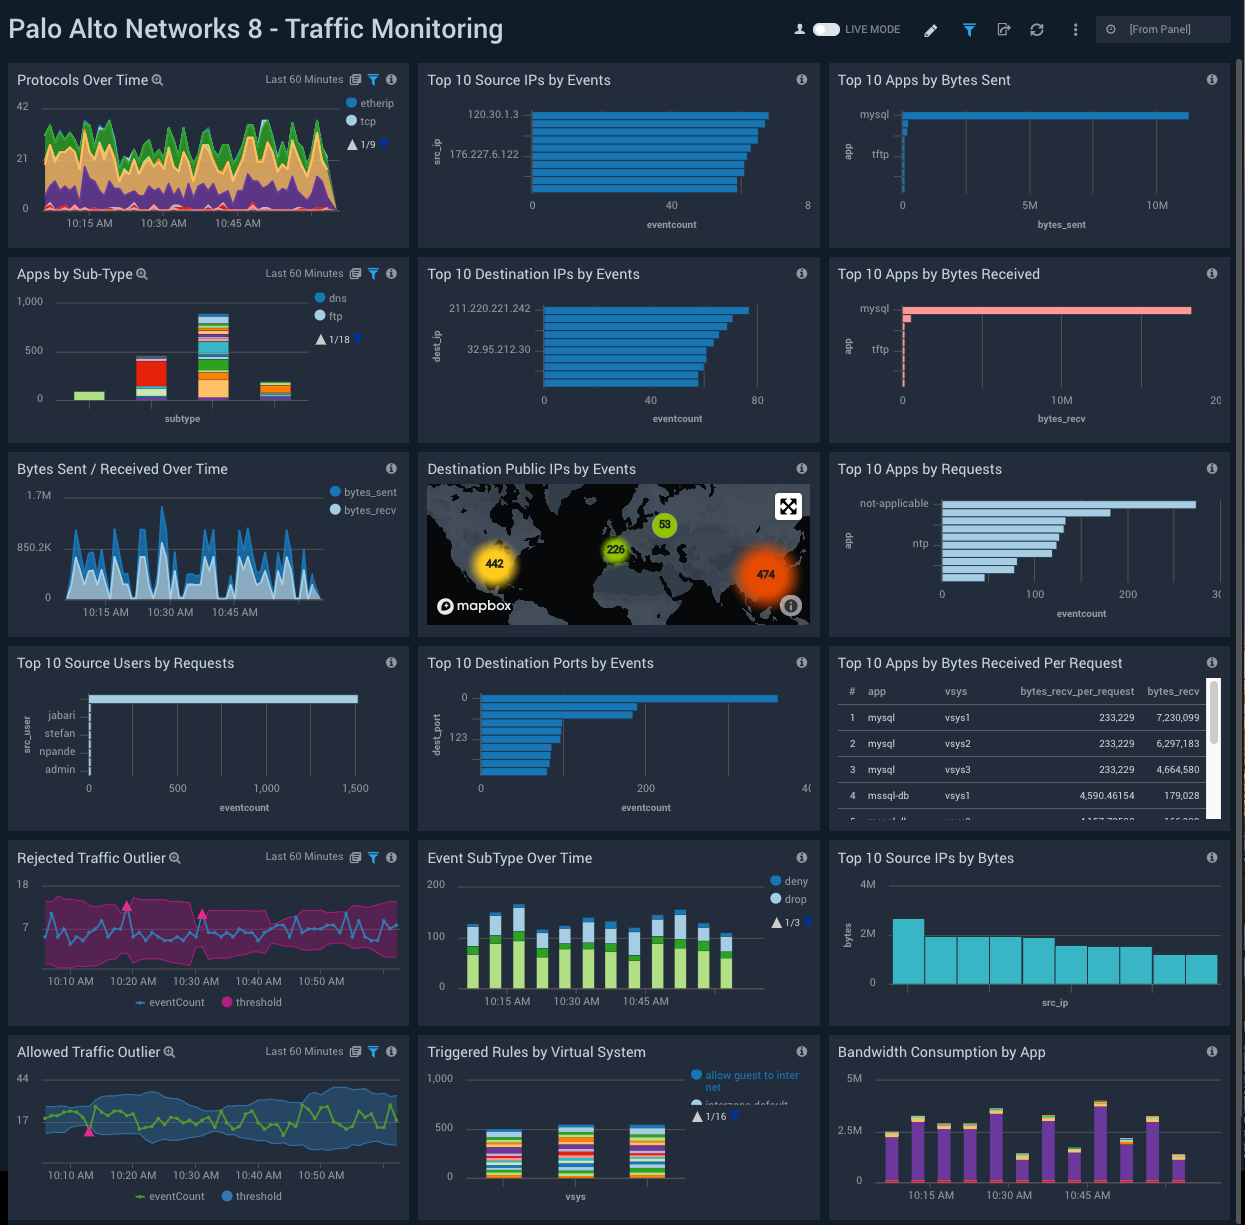
Traffic Monitoring
Description: See information about firewall traffic, including protocol usage; top source IPs, apps, destination IPs, source users, and destination ports; and outlier analysis of rejected and accepted traffic.
Use case: Use this dashboard to detect sudden changes in allowed or rejected traffic in the outlier panels. To investigate outliers, look for a corresponding change in rules configuration on the Configuration Analysis dashboard.
You can also monitor the types of content being accessed by various apps and virtual systems. You can track the bandwidth consumed by specific apps and take corrective action as necessary. Using the geolocation map, you can track source and destination locations and determine whether a location is expected, and block it, as appropriate.
Traffic Insight - File Activity
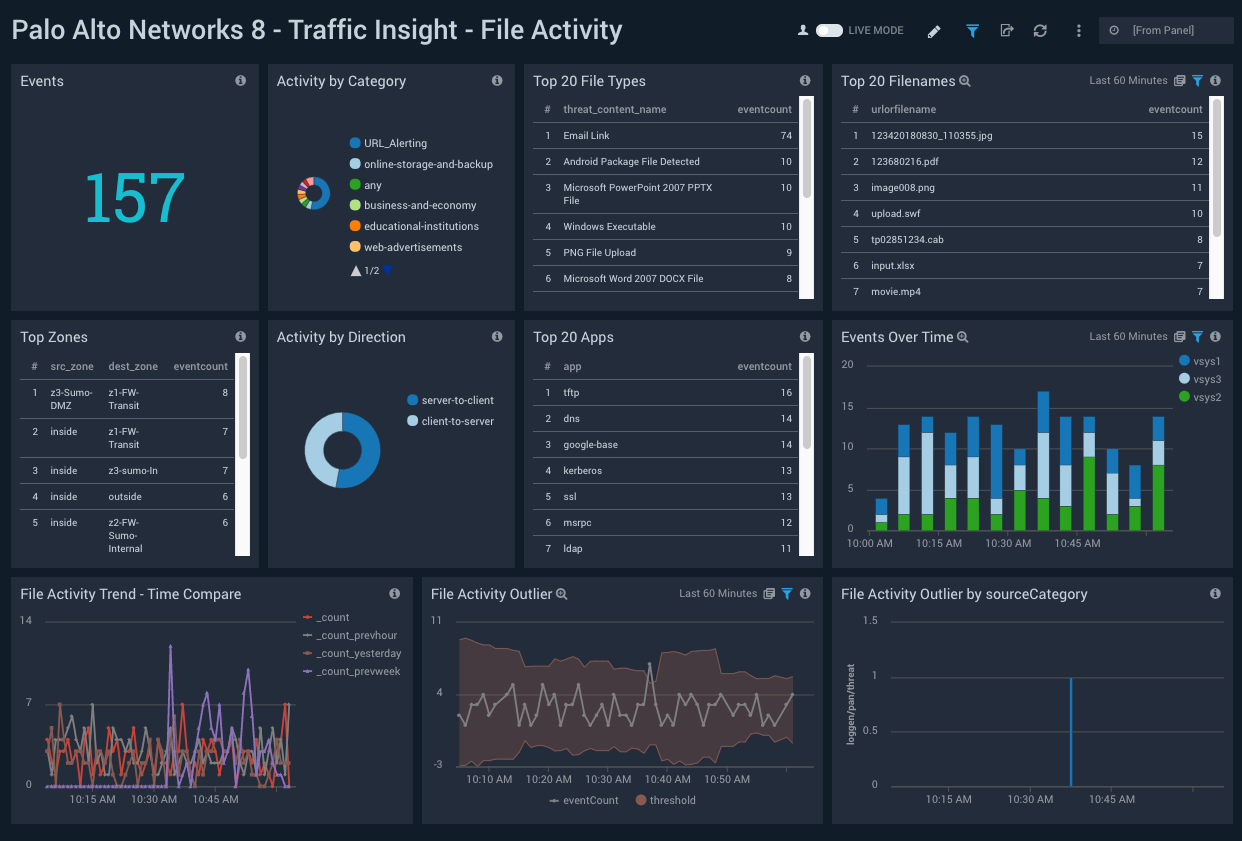
Description: See information about firewall requests that involved file uploads or downloads, including upload/download event counts; top file types, file names, and apps; and time comparison and outlier analysis of download and upload traffic.
Use case: Use this dashboard to monitor end users’ file upload and download activities. You can track suspicious file types being uploaded or downloaded through various apps. It also provides insight into sudden changes in activities though outliers. You can compare the current activity trend with the the previous hour, the same time yesterday, and the same time last week with the time compare panel.
Traffic Insight - Web Activity
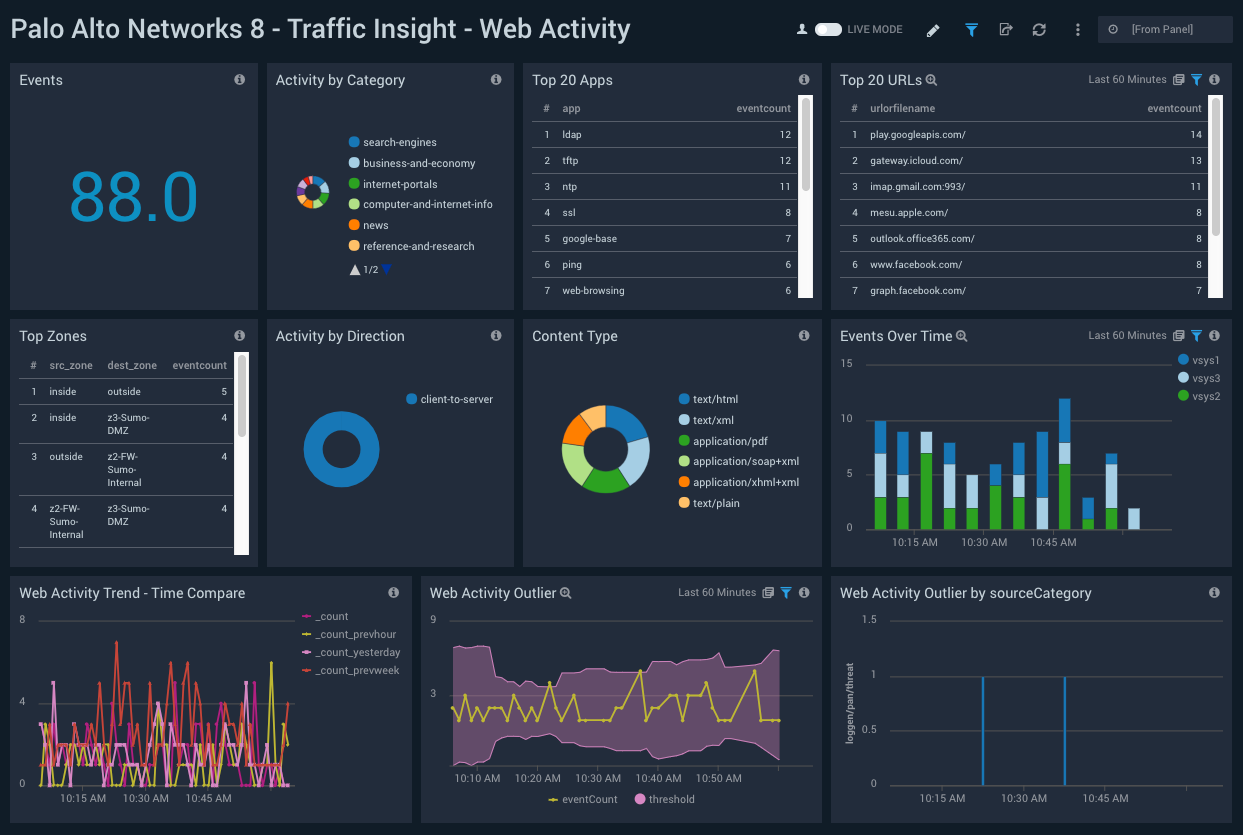
Description: See information about firewall requests that involved web browsing activities, including event count; top content types, apps, and URLs; and time comparison and outlier analysis of web browsing activity.
Use case: Use this dashboard to monitor end users’ file web browsing activities. You can track URLs and the content being browsed using various apps. It also provides insight into sudden changes in activities though outliers. You can compare the current activity trend with the the previous hour, the same time yesterday, and the same time last week with the time compare panel.
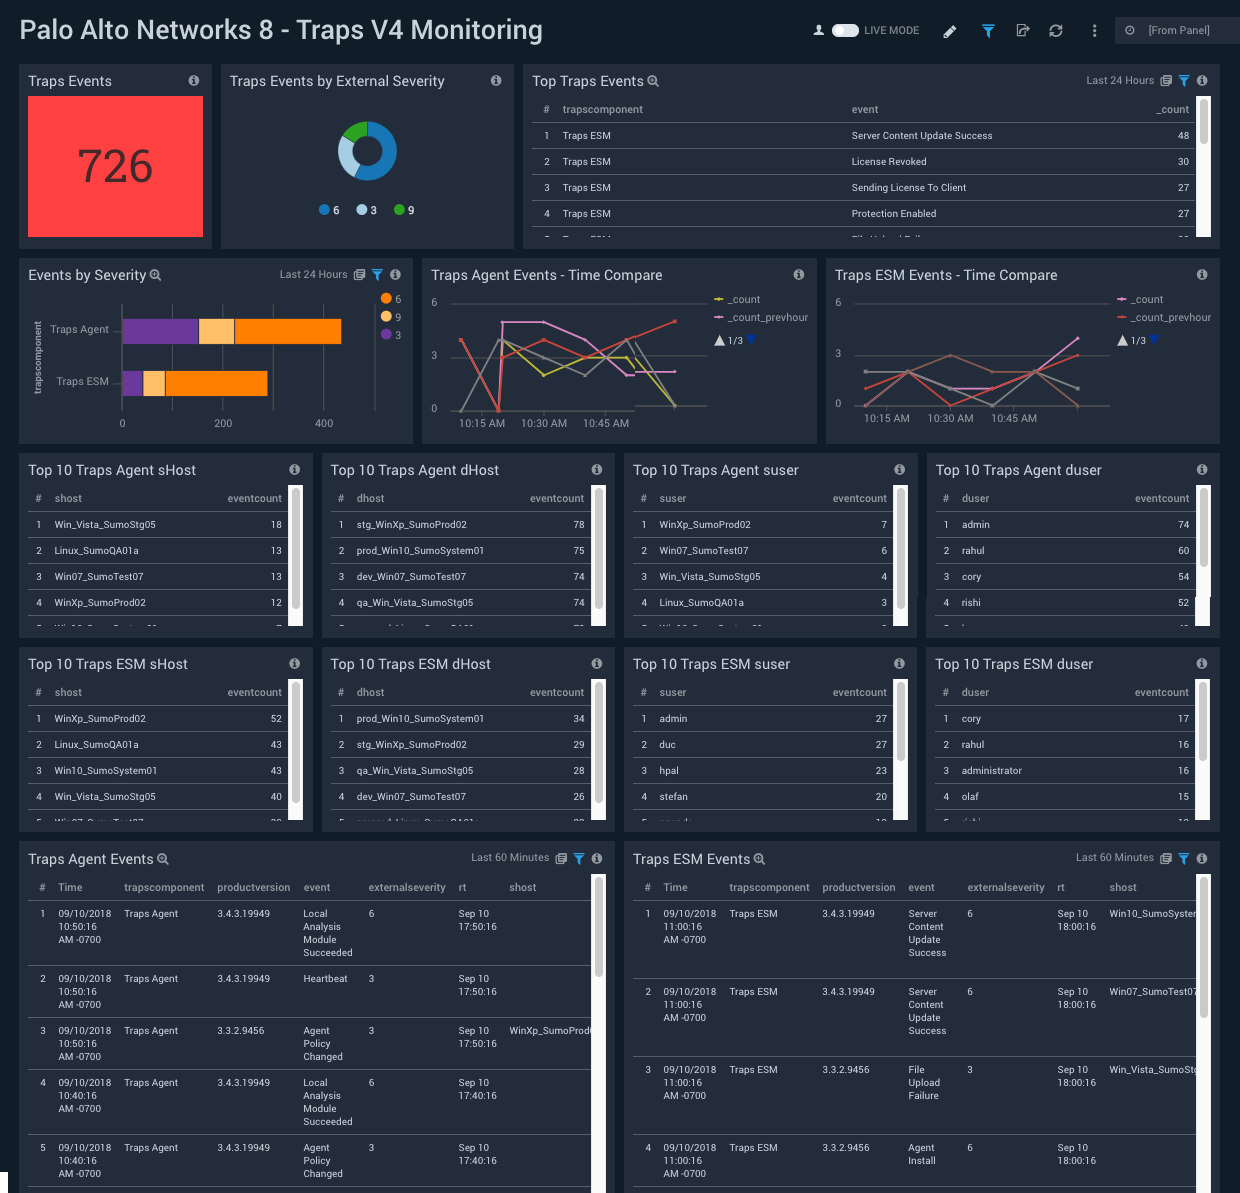
Traps V4 Monitoring
Description: See information about trap events, including a count of trap events, a breakdown of trap events by severity, and a breakdown by Traps ESM and Traps Agent.
Use case: Use this dashboard to identify how end points have been attacked. You can monitor ransomware threats and new exploits. You can also track agent installs/uninstalls, upgrades, service statuses, access violations, and prevention events.
