Sumo Logic App for Zscaler Web Security

The Zscaler Web Security App collects logs from Zscaler with Nanolog Streaming Service (NSS) to populate pre-configured searches and Dashboards. The dashboards provide easy-to-access visual insights into web traffic behaviors, security, user browsing activities, and risk.
Log Types
The Sumo Logic App for Zscaler uses NSS feed output web logs, as documented here.
Collect Logs for the Zscaler Web Security App
Zscaler uses a virtual machine, Nanolog Streaming Service (NSS), to stream logs from the Zscaler service and deliver them to Sumo Logic installed collector via Syslog.
To collect logs for Zscaler, perform these steps, detailed in the following sections:
- Configure Sumo Logic Installed Collector and Syslog Source.
- Configure Zscaler NSS.
- Connect the Zscaler NSS feed to Sumo Logic.
Step 1: Configure Sumo Logic Installed Collector and Syslog Source
To collect logs for Zscaler Web Security, do the following in Sumo Logic:
- Configure an Installed Collector.
- Configure a Syslog Source. For protocol, use TCP.
Note the Port number, as you will need this to configure Zscaler NSS. \
Also, when you configure the Syslog Source, we recommend that you use the Source Category security_zscaler.
Step 2: Configure Zscaler NSS
Zscaler offers a virtual appliance, called Nanolog Streaming Service (NSS) to stream web logs to external SIEM via syslog. NSS is maintained and distributed by Zscaler as an Open Virtual Application (OVA).
To stream logs to the Sumo Logic Syslog Source, perform steps A, B, and C detailed in the “NSS Configuration Guide” at: https://support.zscaler.com/hc/en-us...guration-Guide.
Step 3: Connect the Zscaler NSS Feed to Sumo Logic
Once you have configured the Zscaler NSS, now add a feed to send logs to the Sumo Logic syslog endpoint using the following steps.
Log into your Zscaler NSS system.
Go to Administration > Settings > Nanolog Streaming Service.
From the NSS Feeds tab, click Add.
In the Add NSS Feed dialog:
- Feed Name. Enter a name for your NSS feed.
- NSS Server. Select None.
- SIEM IP Address. Enter the Sumo Logic Installed Collector IP address.
- Log Type. Select Web Log.
- Feed Output Type. QRadar LEEF is the default.
- NSS Type. NSS for Web is the default.
- Status. Select Enabled.
- SIEM TCP Port. Enter the Sumo Logic Syslog Source TCP port number.
- Feed Escape Character. Leave this field blank.
- Feed Output Format. The LEEF format is displayed.
- User Obfuscation. Select Disabled.
- Duplicate Logs. Disabled by default.
- Timezone. Set to GMT by default.
Click Save.
(Optional) Configure the Zscaler NSS Feeds to Sumo Logic in JSON format
Once you have configured the Zscaler NSS, now add a feed to send logs in JSON format to the Sumo Logic syslog endpoint using the following steps.
- g into your Zscaler NSS system.
- Go to Administration > Settings > Nanolog Streaming Service.
- From the NSS Feeds tab, click Add.
- In the Add NSS Feed dialog:
- Feed Name. Enter a name for your NSS feed.
- NSS Server. Select the NSS Server.
- SIEM IP Address. Enter the Sumo Logic Installed Collector IP address.
- Log Type. Select Web Log.
- Feed Output Type. Custom.
- NSS Type. NSS for Web is the default.
- Status. Select Enabled.
- SIEM TCP Port. Enter the Sumo Logic Syslog Source TCP port number.
- Feed Escape Character. Leave this field blank.
- Feed Output Format. Select Custom and paste the following:
\{ "sourcetype" : "zscalernss-web", "event" : \{"datetime":"%d{yy}-%02d{mth}-%02d{dd} %02d{hh}:%02d{mm}:%02d{ss}","reason":"%s{reason}","event_id":"%d{recordid}","protocol":"%s{proto}","action":"%s{action}","transactionsize":"%d{totalsize}","responsesize":"%d{respsize}","requestsize":"%d{reqsize}","urlcategory":"%s{urlcat}","serverip":"%s{sip}","clienttranstime":"%d{ctime}","requestmethod":"%s{reqmethod}","refererURL":"%s{ereferer}","useragent":"%s{ua}","product":"NSS","location":"%s{location}","ClientIP":"%s{cip}","status":"%s{respcode}","user":"%s{login}","url":"%s{eurl}","vendor":"Zscaler","hostname":"%s{ehost}","clientpublicIP":"%s{cintip}","threatcategory":"%s{malwarecat}","threatname":"%s{threatname}","filetype":"%s{filetype}","appname":"%s{appname}","pagerisk":"%d{riskscore}","department":"%s{dept}","urlsupercategory":"%s{urlsupercat}","appclass":"%s{appclass}","dlpengine":"%s{dlpeng}","urlclass":"%s{urlclass}","threatclass":"%s{malwareclass}","dlpdictionaries":"%s{dlpdict}","fileclass":"%s{fileclass}","bwthrottle":"%s{bwthrottle}","servertranstime":"%d{stime}","contenttype":"%s{contenttype}","unscannabletype":"%s{unscannabletype}","deviceowner":"%s{deviceowner}","devicehostname":"%s{devicehostname}"\}\}
Duplicate Logs. Disabled by default.
Timezone. Set to GMT by default.
Click Save.
In this section, add a note that if you are sending JSON format logs, utilize the ZIA app instead of web security and point to this page.
Sample Log Message
Mon Oct 02 16:21:40 UTC 2017 zscaler-nss: LEEF:1.0|Zscaler|NSS|4.1|NA|filetype=Archive Files dlpeng=NA cat=Blocked useragent=NA hostname=NA src=185.27.134.11 url=www.electrichumanproject.com/ policy=Malicious file Blocked urlsupercategory=Shopping and Auctions srcPostNAT=NA reqmethod=NA bwthrottle=NA devTimeFormat=MMM dd yyyy HH:mm:ss z referer=None srcBytes=31386 usrName=tempor@demo.com malwareclass=NA appproto=NA riskscore=0 dlpdict=NA devTime=Mon Oct 02 16:21:40 UTC 2017 recordid=69790990 dst=91.171.43.14 appname=Yandex Search role=NA malwaretype=NA appclass=Enterprise urlcategory=Sports urlclass=NA realm=EMEA dstBytes=596219 threatname=W32/Tool.IJQF-0856 fileclass=Executables Files
Sample Query
_sourceCategory = "zscaler" !"cat=Allowed"
| parse "policy=*\t" as policy, "realm=*\t" as realm
| parse "src=*\t" as src_ip, "usrName=*\t" as src_user
| count by policy,realm
| transpose row realm column policy
Installing the Zscaler Web Security App
This section provides instructions on how to install the Zscaler Web Security App, and provides examples of each of the dashboards. The App preconfigured searches and dashboards provide easy-to-access visual insights into your data.
To install the app, do the following:
Locate and install the app you need from the App Catalog. If you want to see a preview of the dashboards included with the app before installing, click Preview Dashboards.
- From the App Catalog, search for and select the app.
- Select the version of the service you're using and click Add to Library.
13 Version selection is applicable only to a few apps currently. For more information, see the Install the Apps from the Library.
- To install the app, complete the following fields.
- App Name. You can retain the existing name, or enter a name of your choice for the app.
- Data Source. Select either of these options for the data source.
- Choose Source Category, and select a source category from the list.
- Choose Enter a Custom Data Filter, and enter a custom source category beginning with an underscore. Example: (
_sourceCategory=MyCategory).
- Advanced. Select the Location in Library (the default is the Personal folder in the library), or click New Folder to add a new folder.
- Click Add to Library.
Once an app is installed, it will appear in your Personal folder, or other folder that you specified. From here, you can share it with your organization.
Panels will start to fill automatically. It's important to note that each panel slowly fills with data matching the time range query and received since the panel was created. Results won't immediately be available, but with a bit of time, you'll see full graphs and maps.
Viewing ZWA Dashboards
Overview
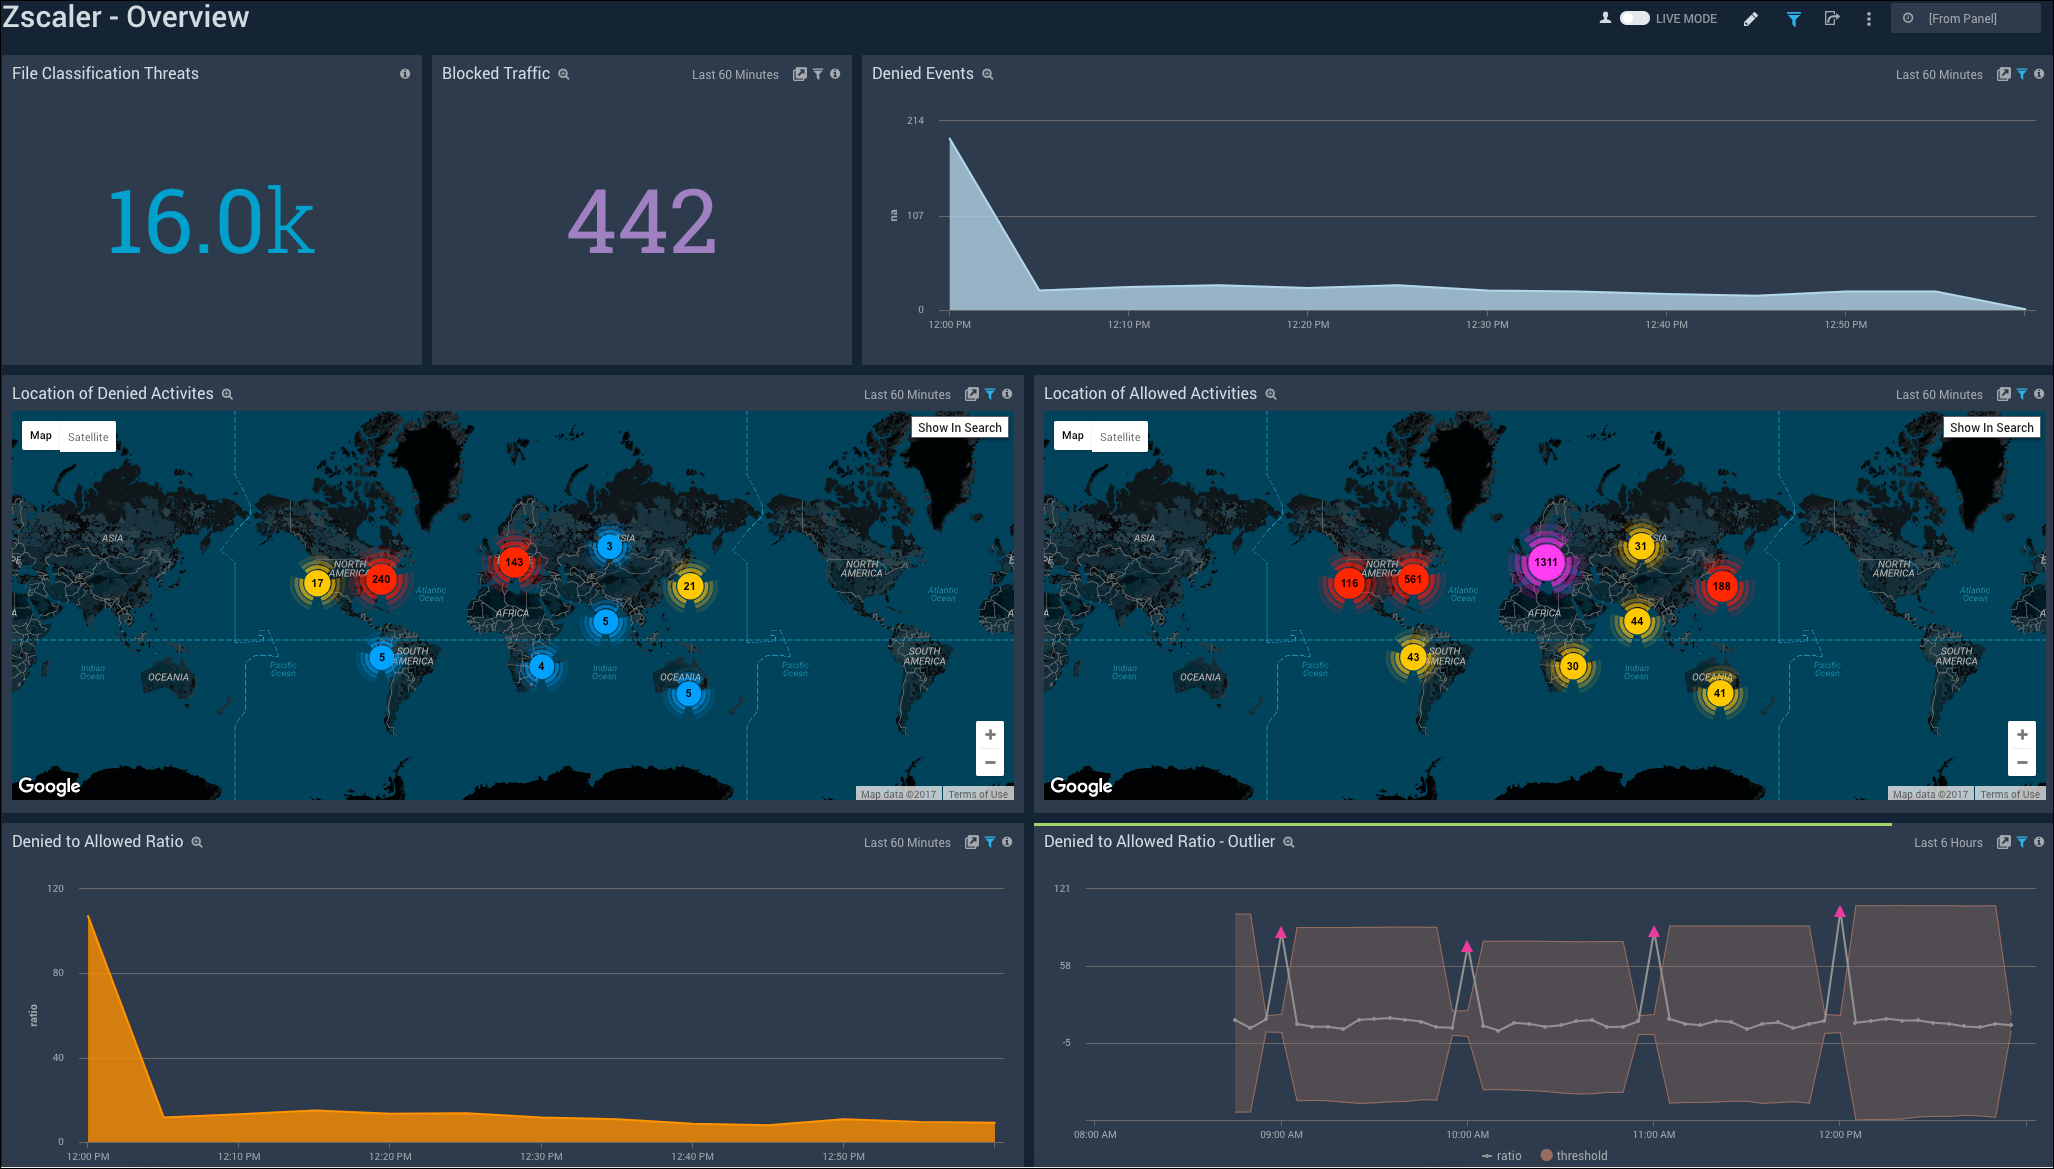
The Zscaler - Overview Dashboard provides general information of the Zscaler Web Gateway logs, including Panels that drill-down into the other Zscaler Dashboards. The Overview Dashboard gives a good starting point for detecting anomalies in blocked traffic and geographic hotspots for allowed and blocked traffic.

File Classification Threats. Displays the number of file classification threats in a single value chart for the last six hours.
Blocked Traffic. Provides the number of blocked traffic events in a single value chart for the last hour.
Denied Events. Shows the number of denied events in an area chart on a timeline for the last hour.
Location of Denied Activities. Performs a geo lookup operation to display the number and location of IP addresses of denied activities on a map of the world for the last hour.
Location of Allowed Activities. Performs a geo lookup operation to display the number and location of IP addresses of allowed activities on a map of the world for the last hour.
Denied to Allowed Ratio. Displays the ratio of denied to allowed events in an area chart on a timeline for the last hour.
Denied to Allowed Ratio - Outlier. Shows the ratio of denied to allowed events in an outlier chart on a timeline for the last six hours.
Behavior
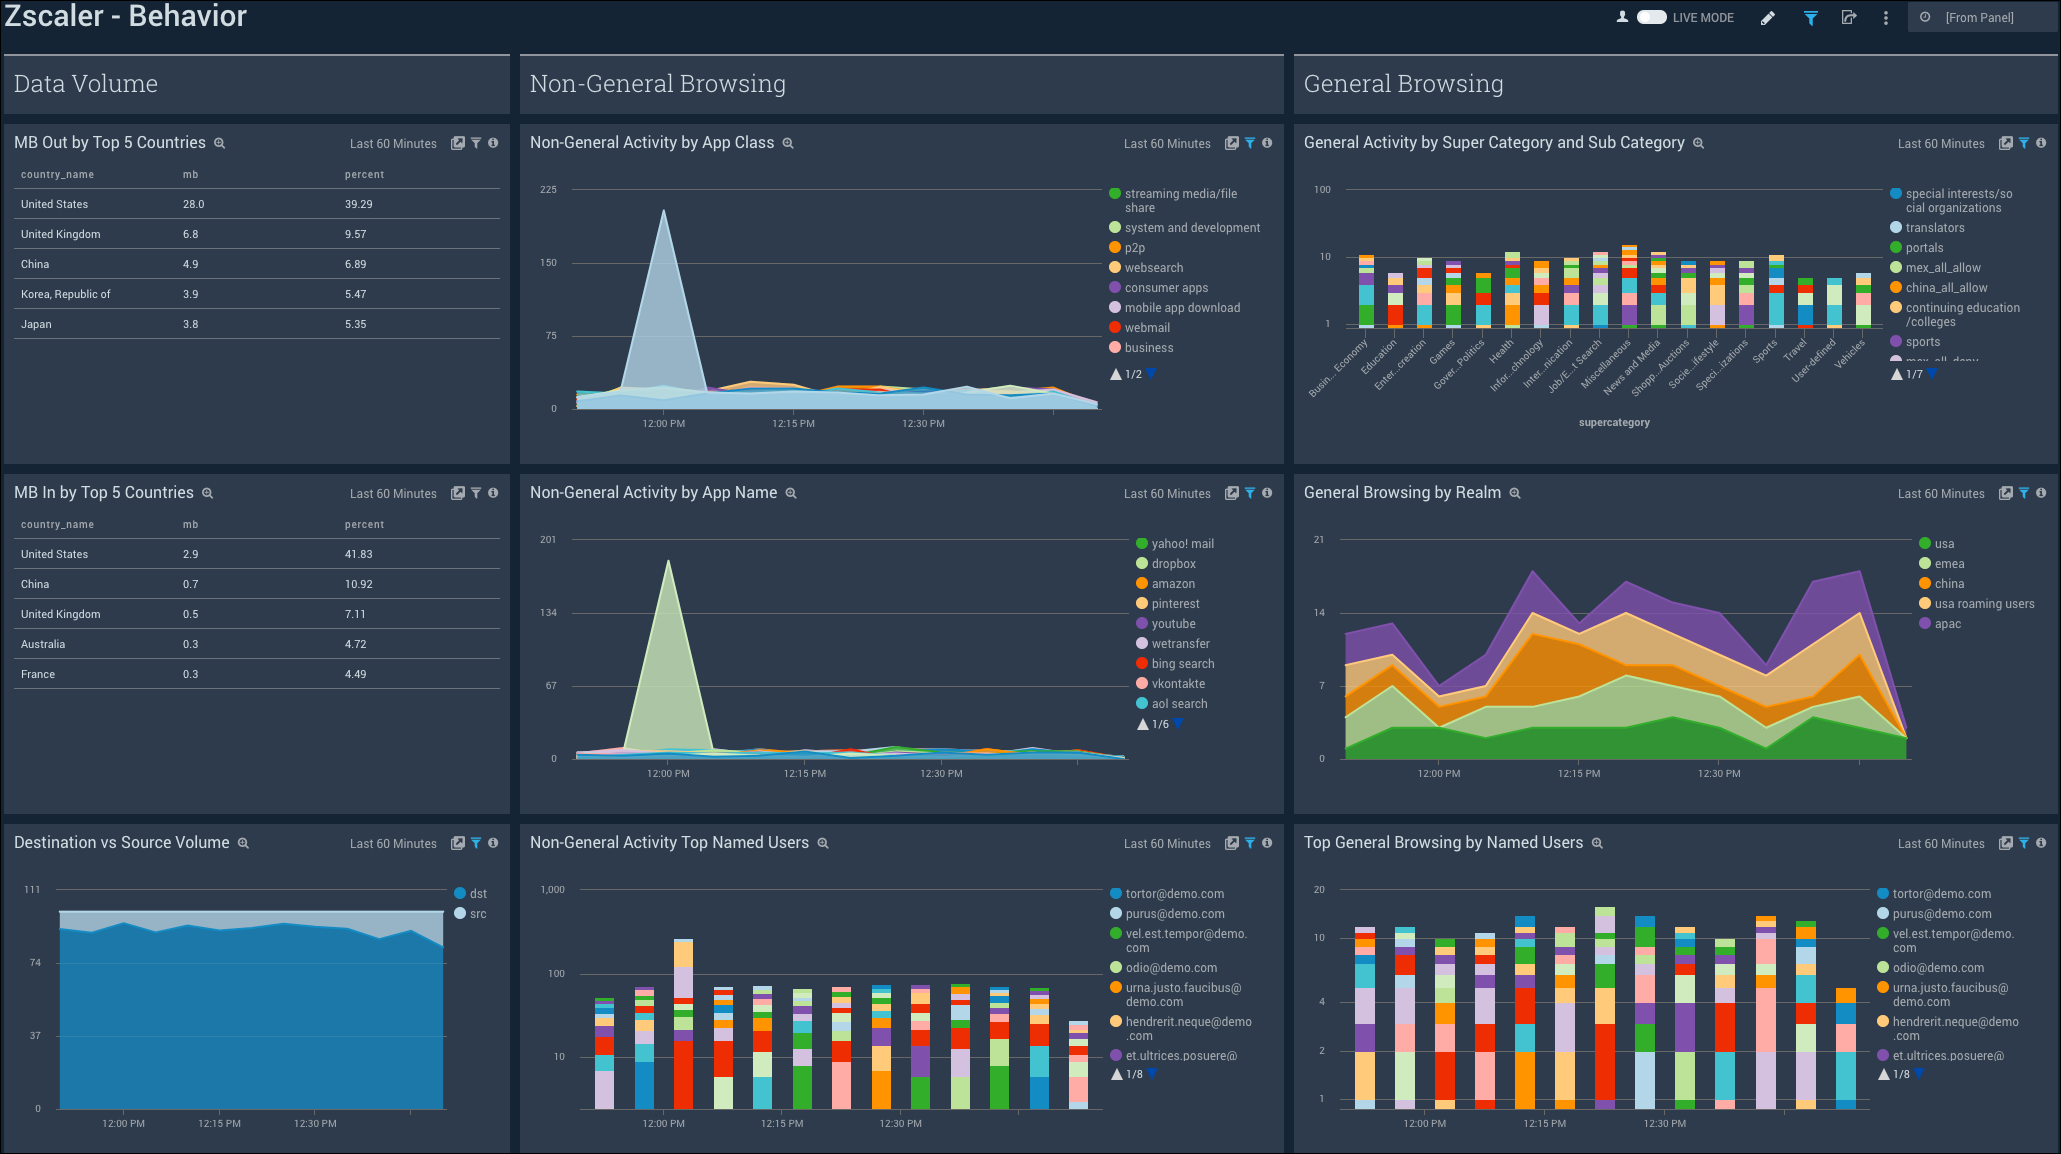
The Zscaler - Behavior Dashboard focuses on allowed traffic behaviors, showing trends and deviations by users, content types accessed, content categories, super categories, and bandwidth trends.

Data Volume
MB Out by Top 5 Countries. Displays the details of MB out by top five countries in a table chart including country name, MB count, and percent usage for the last hour.
MB In by Top 5 Countries. Shows the details of MB in by top five countries in a table chart including country name, MB count, and percent usage for the last hour.
Destination vs Source Volume. Provides information on the volume of destination vs source in an area chart on a timeline for the last hour.
Non-General Browsing
Non-General Activity by App Class. Displays activity by app class in a stacked area chart on a timeline for the last hour.
Non-General Activity by App Name. Shows activity by app name in a stacked area chart on a timeline for the last hour.
Non-General Activity by Top Named Users. Provides activity by top named users in a stacked column chart on a timeline for the last hour.
General Browsing
General Activity by Super Category and Sub Category. Displays details about activity by super category and sub category in a stacked column chart for the last hour.
General Browsing by Realm. Shows details of browsing by realm in a stacked area chart on a timeline for the last hour.
Top General Browsing by Named Users. Provides details of browsing by named users in a stacked column chart on a timeline for the last hour.
Blocked Traffic
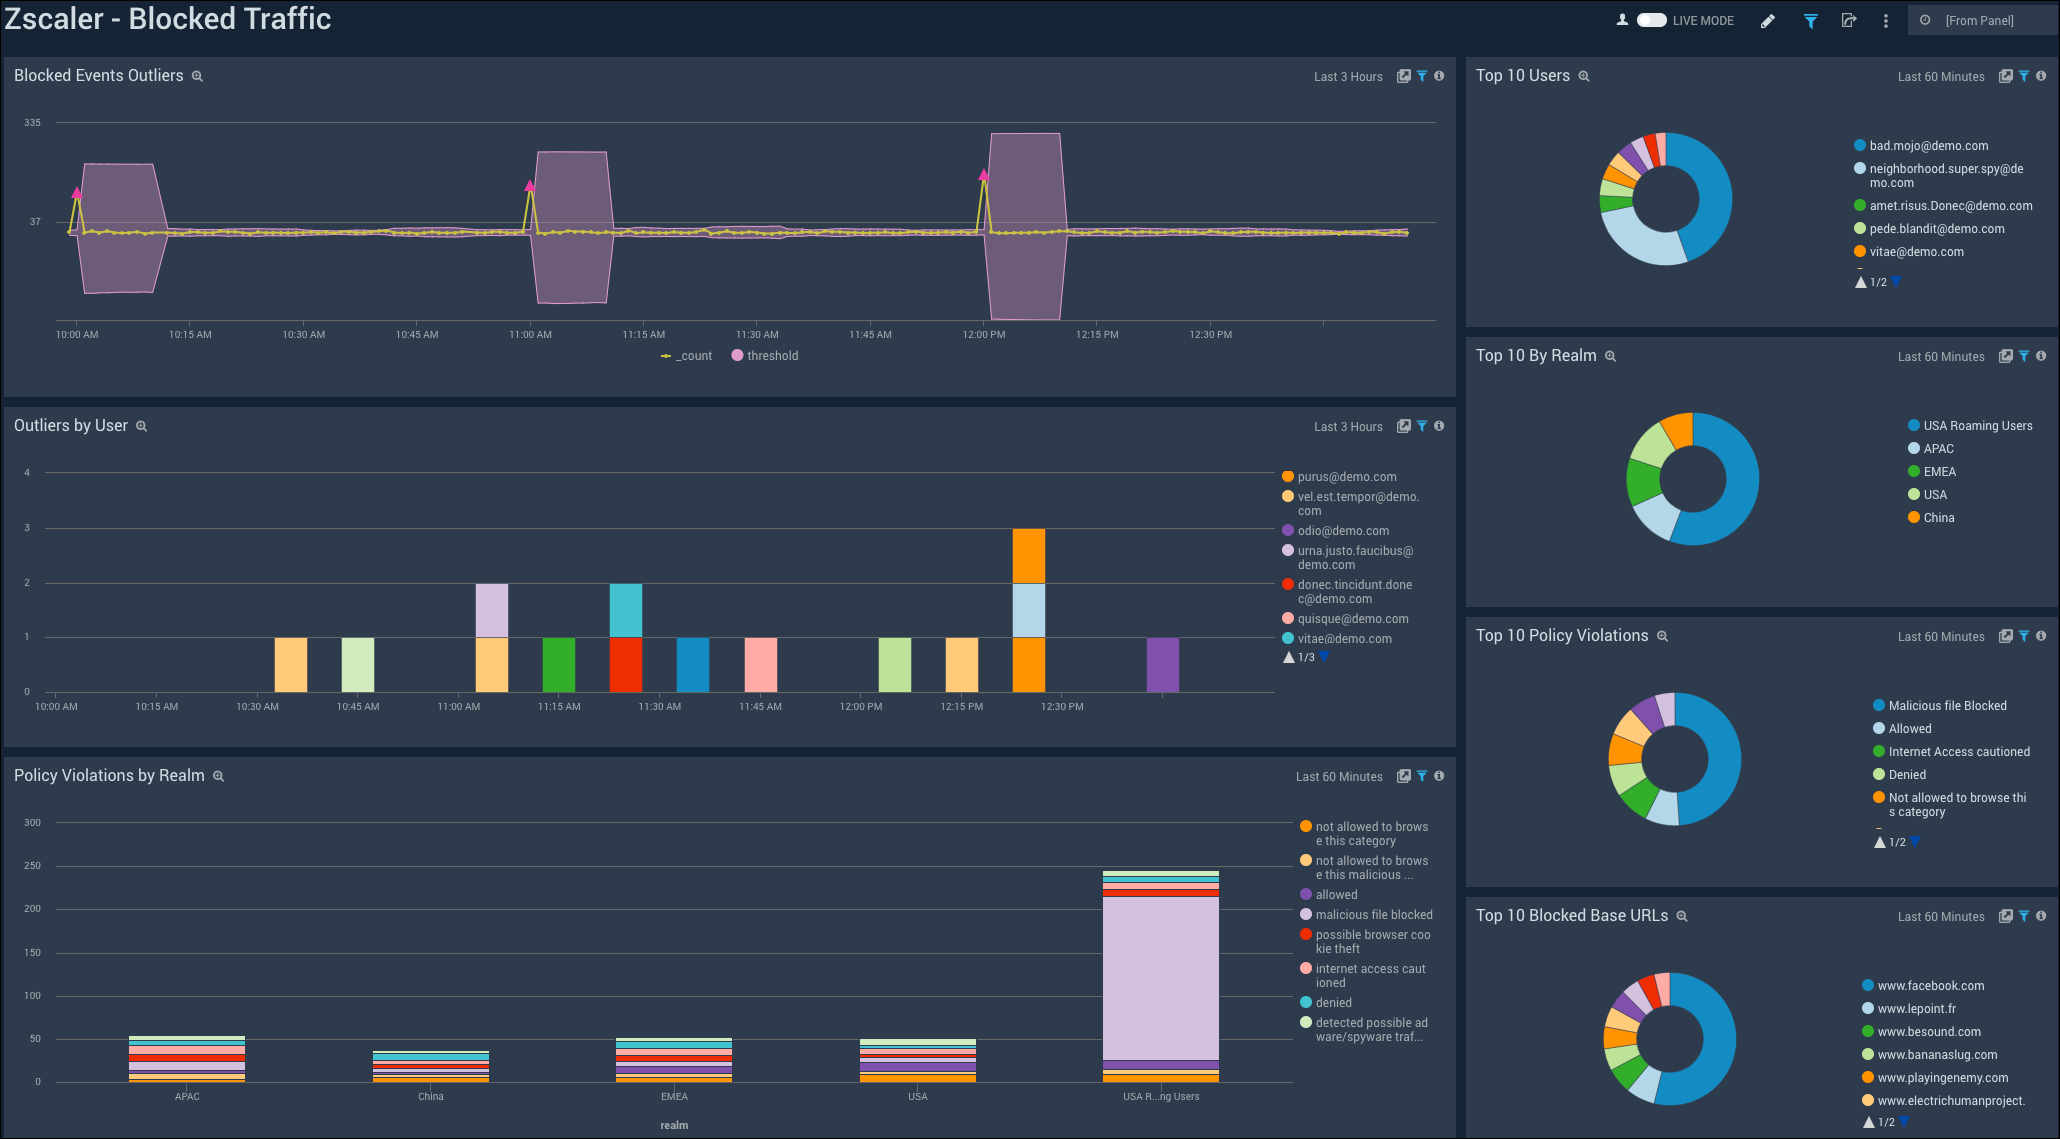
The Zscaler - Blocked Traffic Dashboard illustrates outliers in both blocked traffic peaks and multi-dimensional outliers for blocked activity specific to user.

Blocked Events Outlier. Displays blocked event outliers in an outlier chart on a timeline for the last three hours.
Outliers by User. Displays outliers by user in a column chart on a timeline for the last three hours.
Policy Violations by Realm. Shows policy violations by realm in a stacked column chart for the last hour.
Top 10 Users. Displays the top 10 users with the most activity in a pie chart for the last hour.
Top 10 Realms. Shows the top 10 realms with the most activity in a pie chart for the last hour.
Top 10 Policy Violations. Provides the top 10 policy violations in a pie chart for the last hour.
Top 10 Blocked Base URLs. Displays the top 10 blocked base URLs with the most activity in a pie chart for the last hour.
File Classification Activity
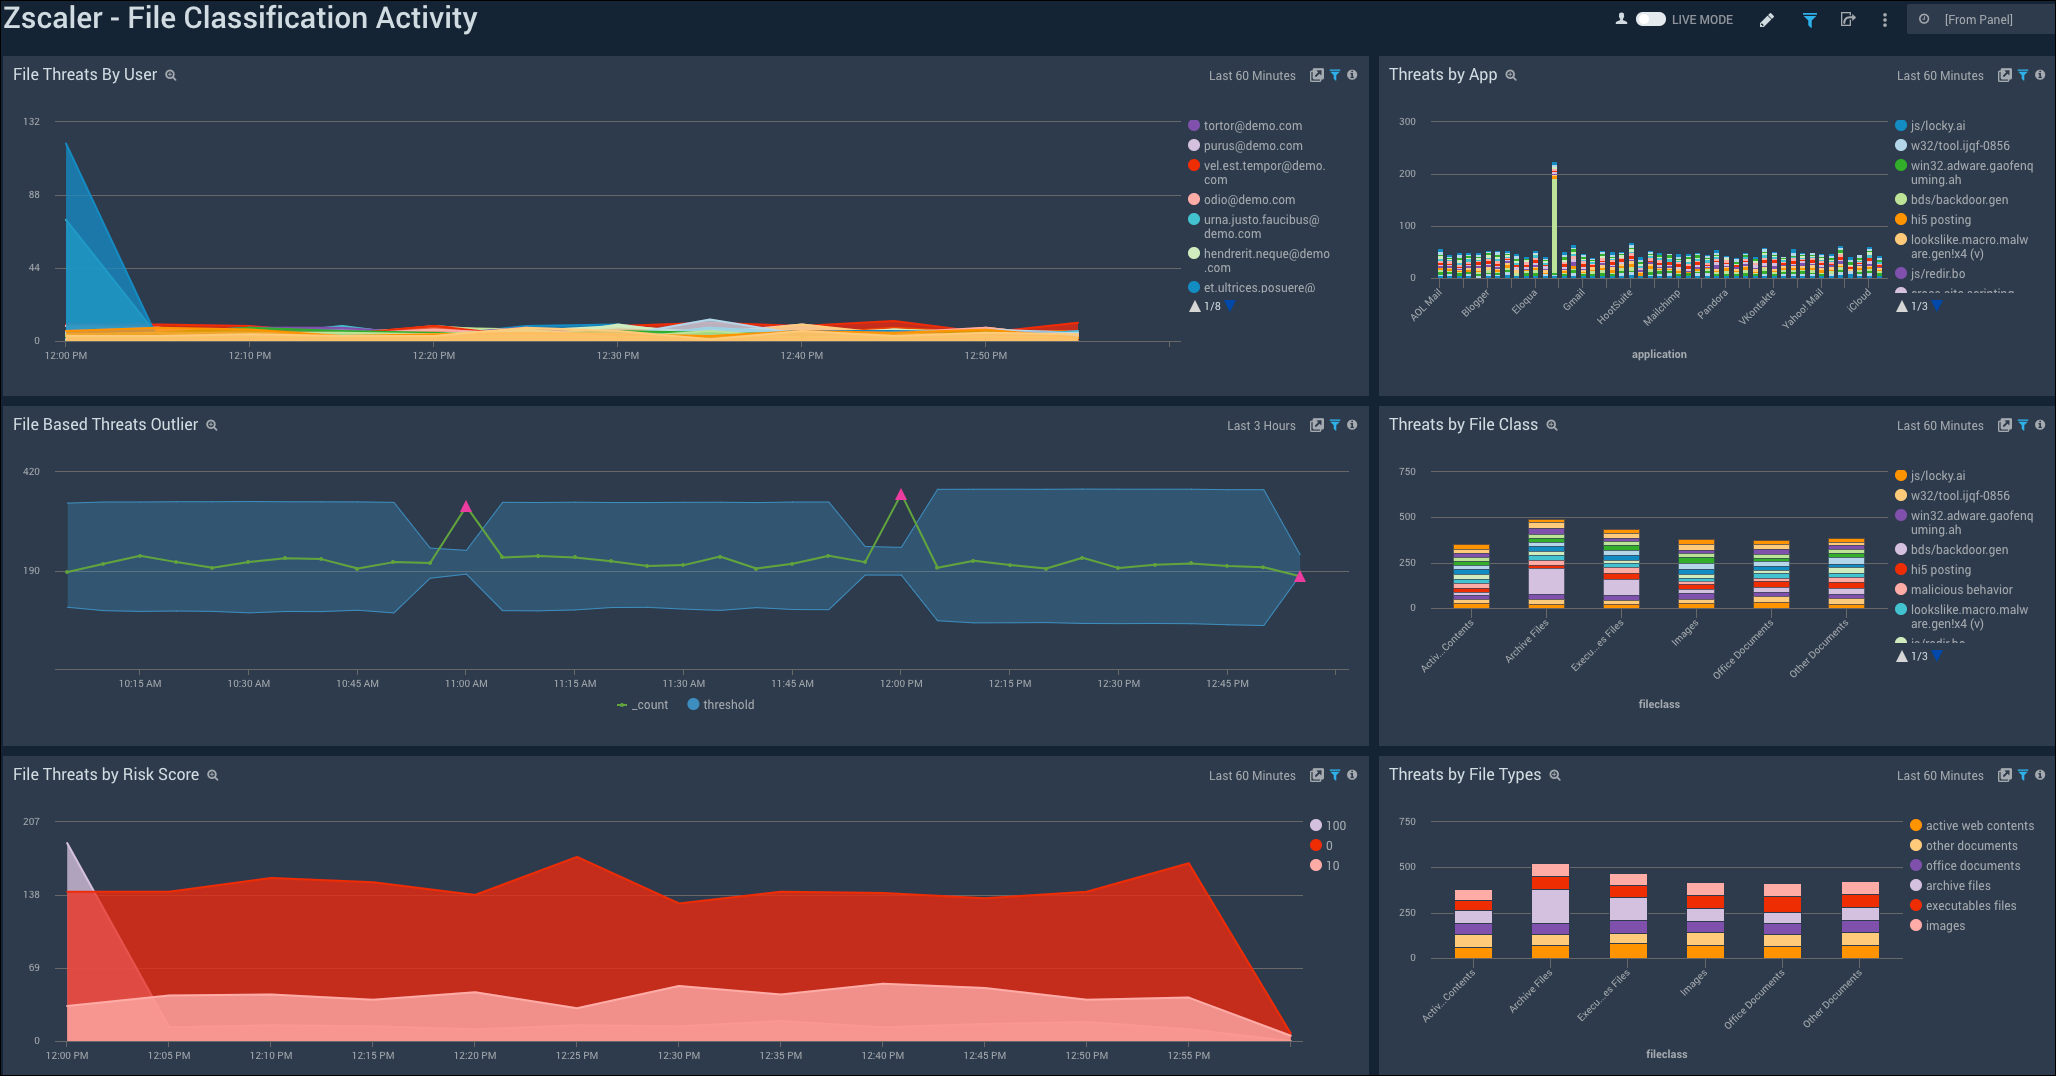
The Zscaler - File Classification Activity Dashboard focuses on file-based threats by users, threat name, file types, and subtypes for a overarching view of blocked files across the Zscaler environment.

File Threats by User. Displays file threats by user in a stacked area chart on a timeline for the last hour.
File Based Threats Outlier. Shows file-based outlier threat events on an outlier chart on a timeline for the last three hours.
File Threats by Risk Score. Provides file threats by risk score in a stacked area chart on a timeline for the last hour.
Threats by App. Details threats by app in a stacked column chart for the last hour.
Threats by File Class. Shows threats by file class in a stacked column chart for the last hour.
Threats by File Types. Details threats classified by file types in file classes in a stacked column chart for the last hour.

