Enterprise Audit - Cloud SIEM
The Enterprise Audit - Cloud SIEM app gives you visibility into what’s going on in Cloud SIEM Enterprise. The app dashboards present high-level and detailed views into the Records that were created, the Signals that have fired, and the Insights generated by CSE. You can also get insight in CSE rules, including rule management activity, and which rules have fired.
Log types
The Enterprise Audit - Cloud SIEM App relies on data that is already available in Sumo Logic, so you don’t need to configure data collection.
CSE Records
CSE Records are stored in the following Sumo Logic partitions:
- sec_record_audit
- sec_record_authentication
- sec_record_email
- sec_record_endpoint
- sec_record_failure
- sec_record_network
- sec_record_notification
CSE Signals
CSE Signals are stored in the following partition:
- sec_signal
CSE Insights
CSE Insight activity is written to these Audit Event Index partitions:
- sumologic_audit_events — User actions performed on Insights
- sumologic_system_events — System actions performed on Insights are logged
Logs written to either of the partitions above are assigned the source category cseinsight. Note that the Audit Event Index contains logs for a variety of Sumo Logic subsystems, so when searching either partition for Insights, include the source category in your search scope.
Install the App
- From the App Catalog, search for and select the app.
- Select the version of the service you're using and click Add to Library. Version selection is applicable only to a few apps currently. For more information, see the Install Apps from the Library.
- To install the app, complete the following fields.
- App Name. You can retain the existing name, or enter a name of your choice for the app.
- Advanced. Select the Location in Library (the default is the Personal folder in the library), or click New Folder to add a new folder.
- Click Add to Library.
Once an app is installed, it will appear in your Personal folder, or other folder that you specified. From here, you can share it with your organization.
Panels will start to fill automatically. It's important to note that each panel slowly fills with data matching the time range query and received since the panel was created. Results won't immediately be available, but with a bit of time, you'll see full graphs and maps.
View App Dashboards
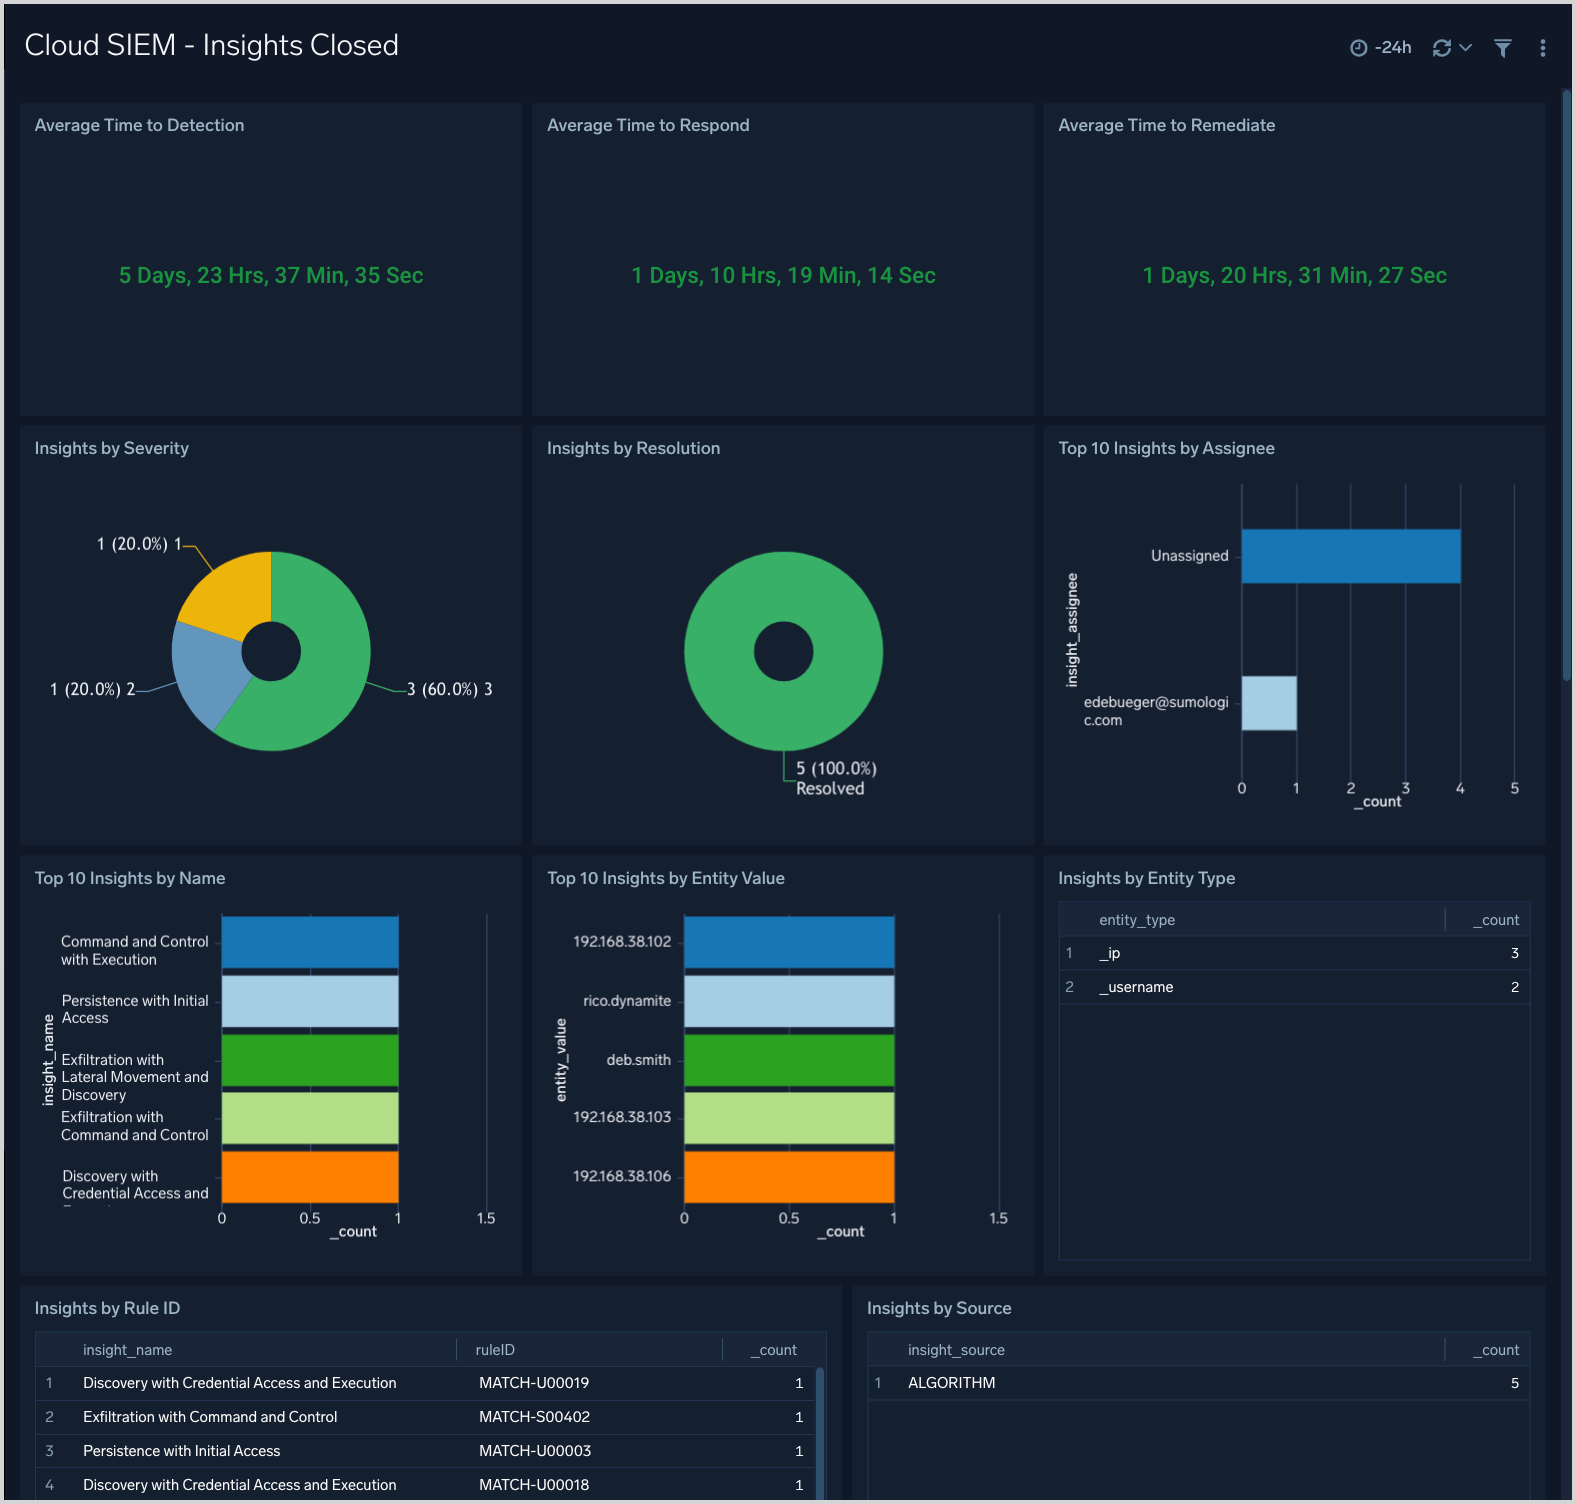
Insights Closed
This dashboard displays metrics on closed Insights, including breakdowns by severity, resolution status, assignee, Entity type, Rule ID and more.
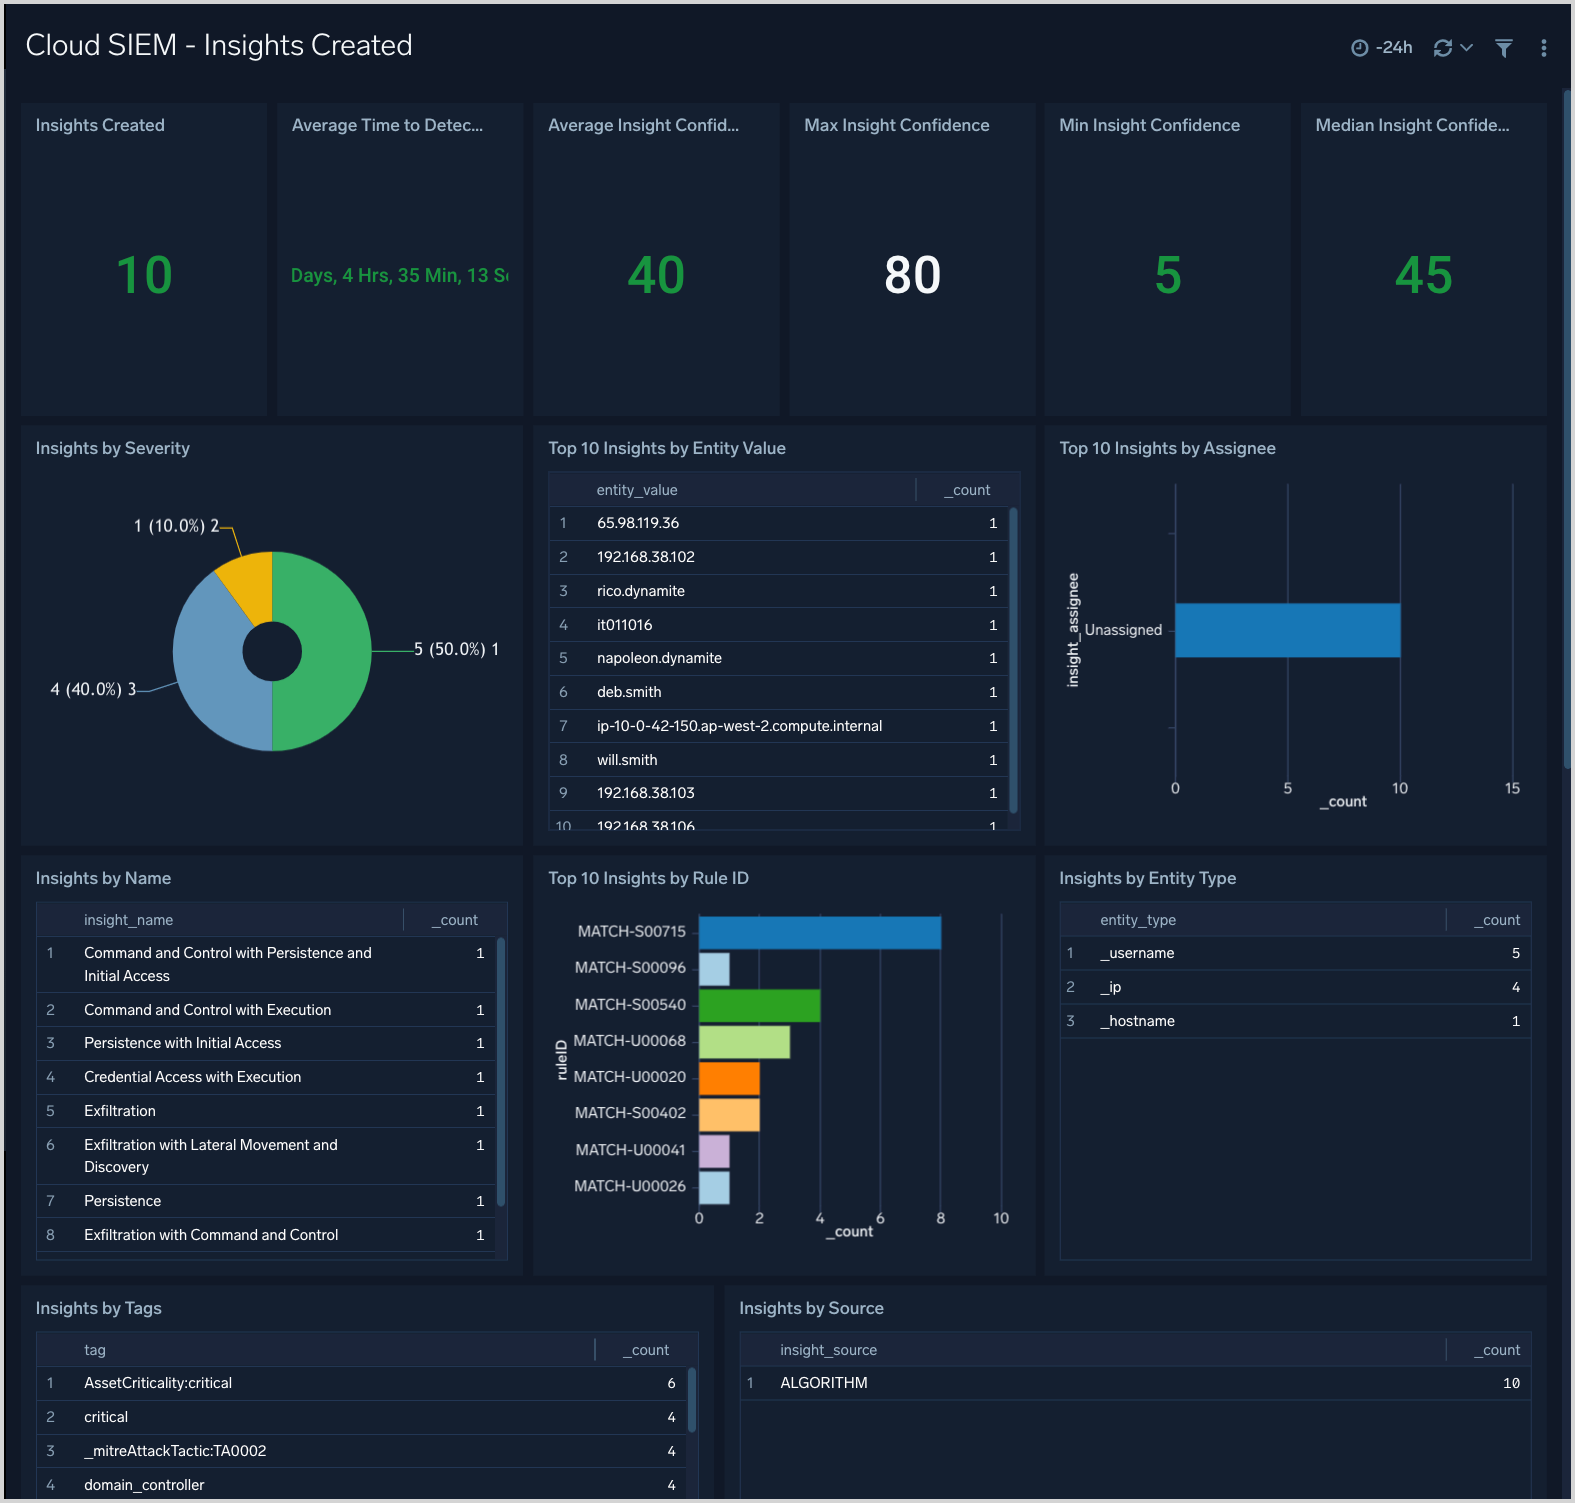
Insights Created
This dashboard presents metrics about Insight creation in your environment. You can see information like how many insights have been created, average time to detection, and Insight Confidence statistics. There are breakdowns of Insights created by severity, primary Entity, rule ID, Entity type, and more.
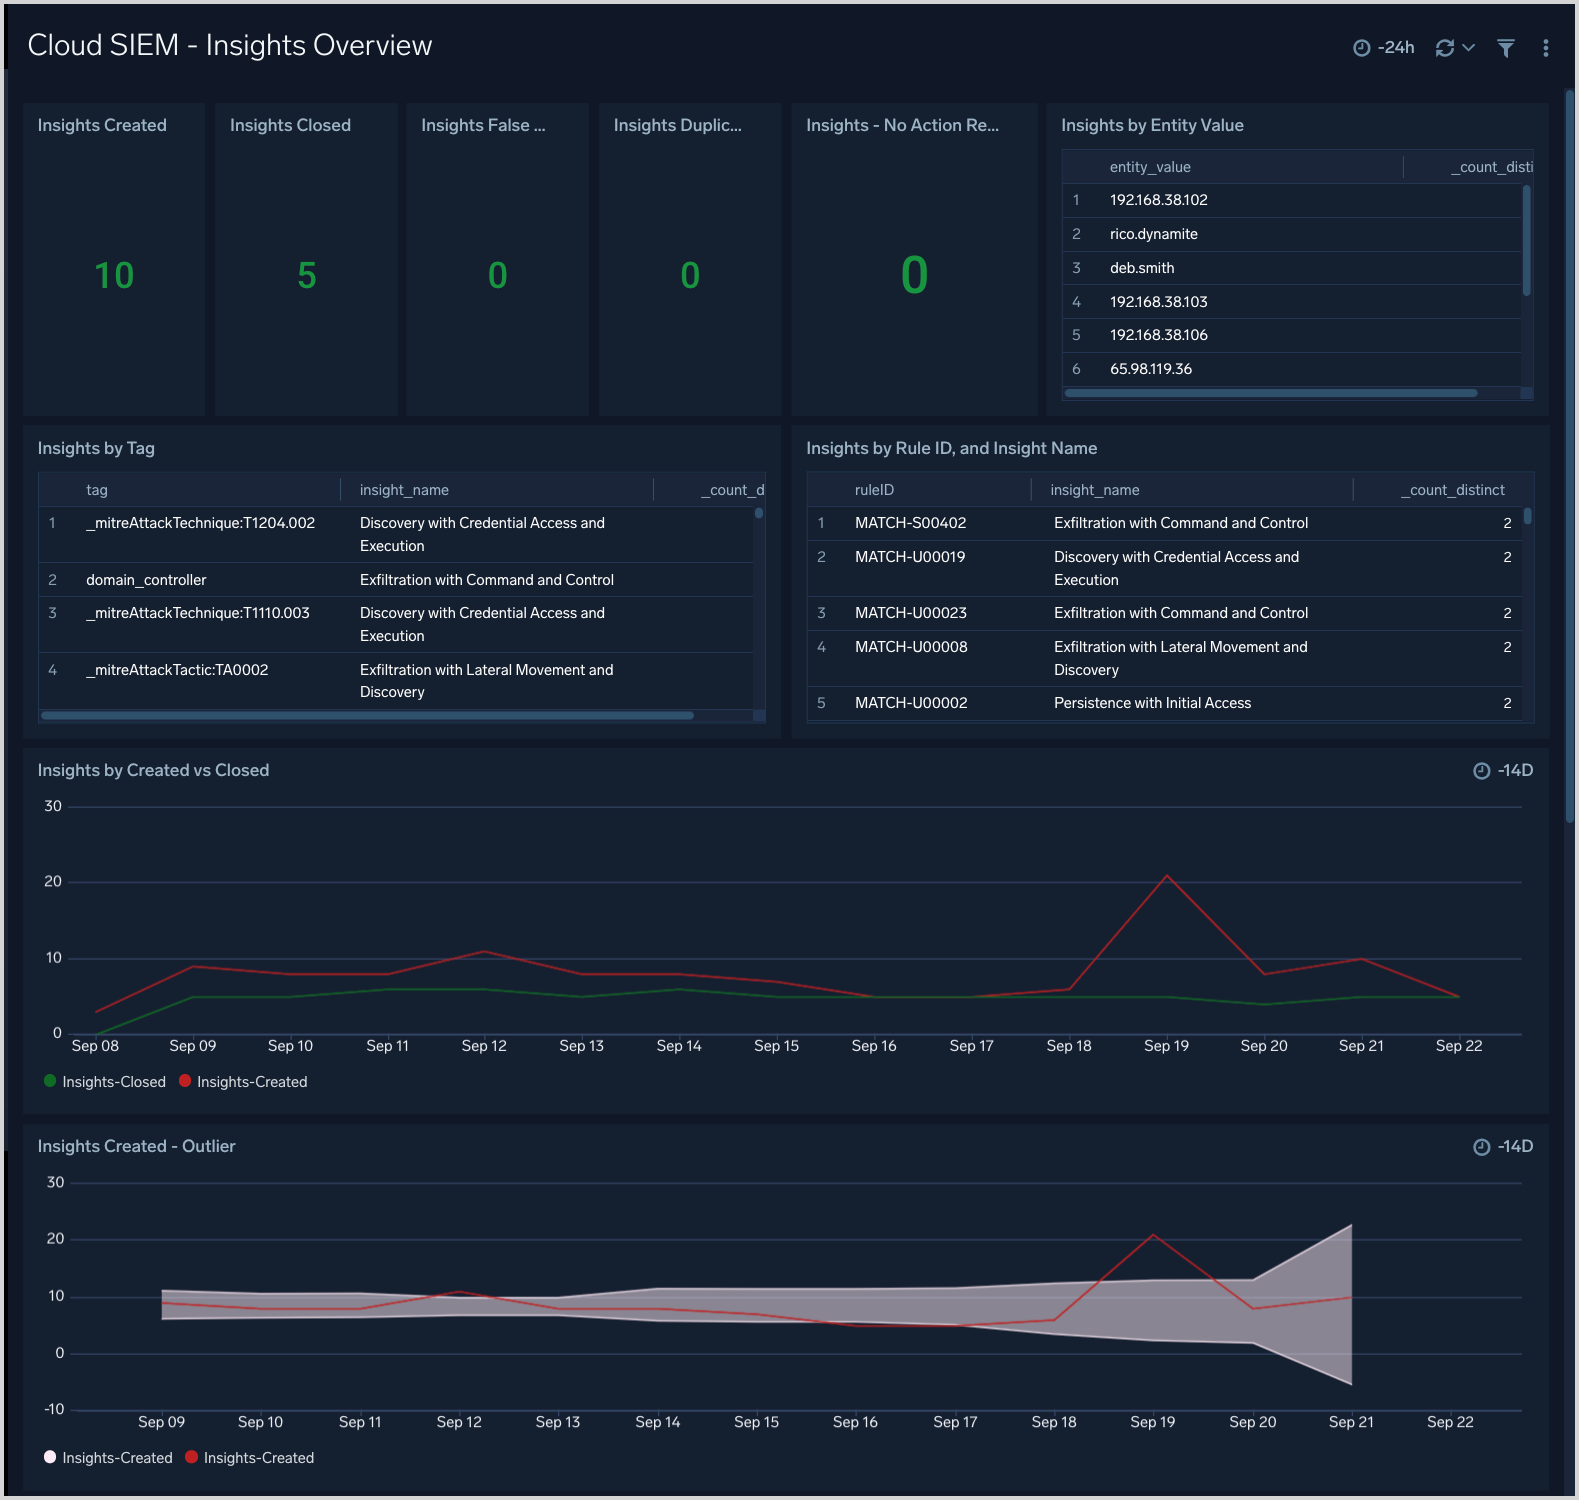
Insights Overview
This dashboard displays a high level view of Insight activity in your environment. You can see counts of Insights created and closed over time, and the top Insights by Confidence Level.
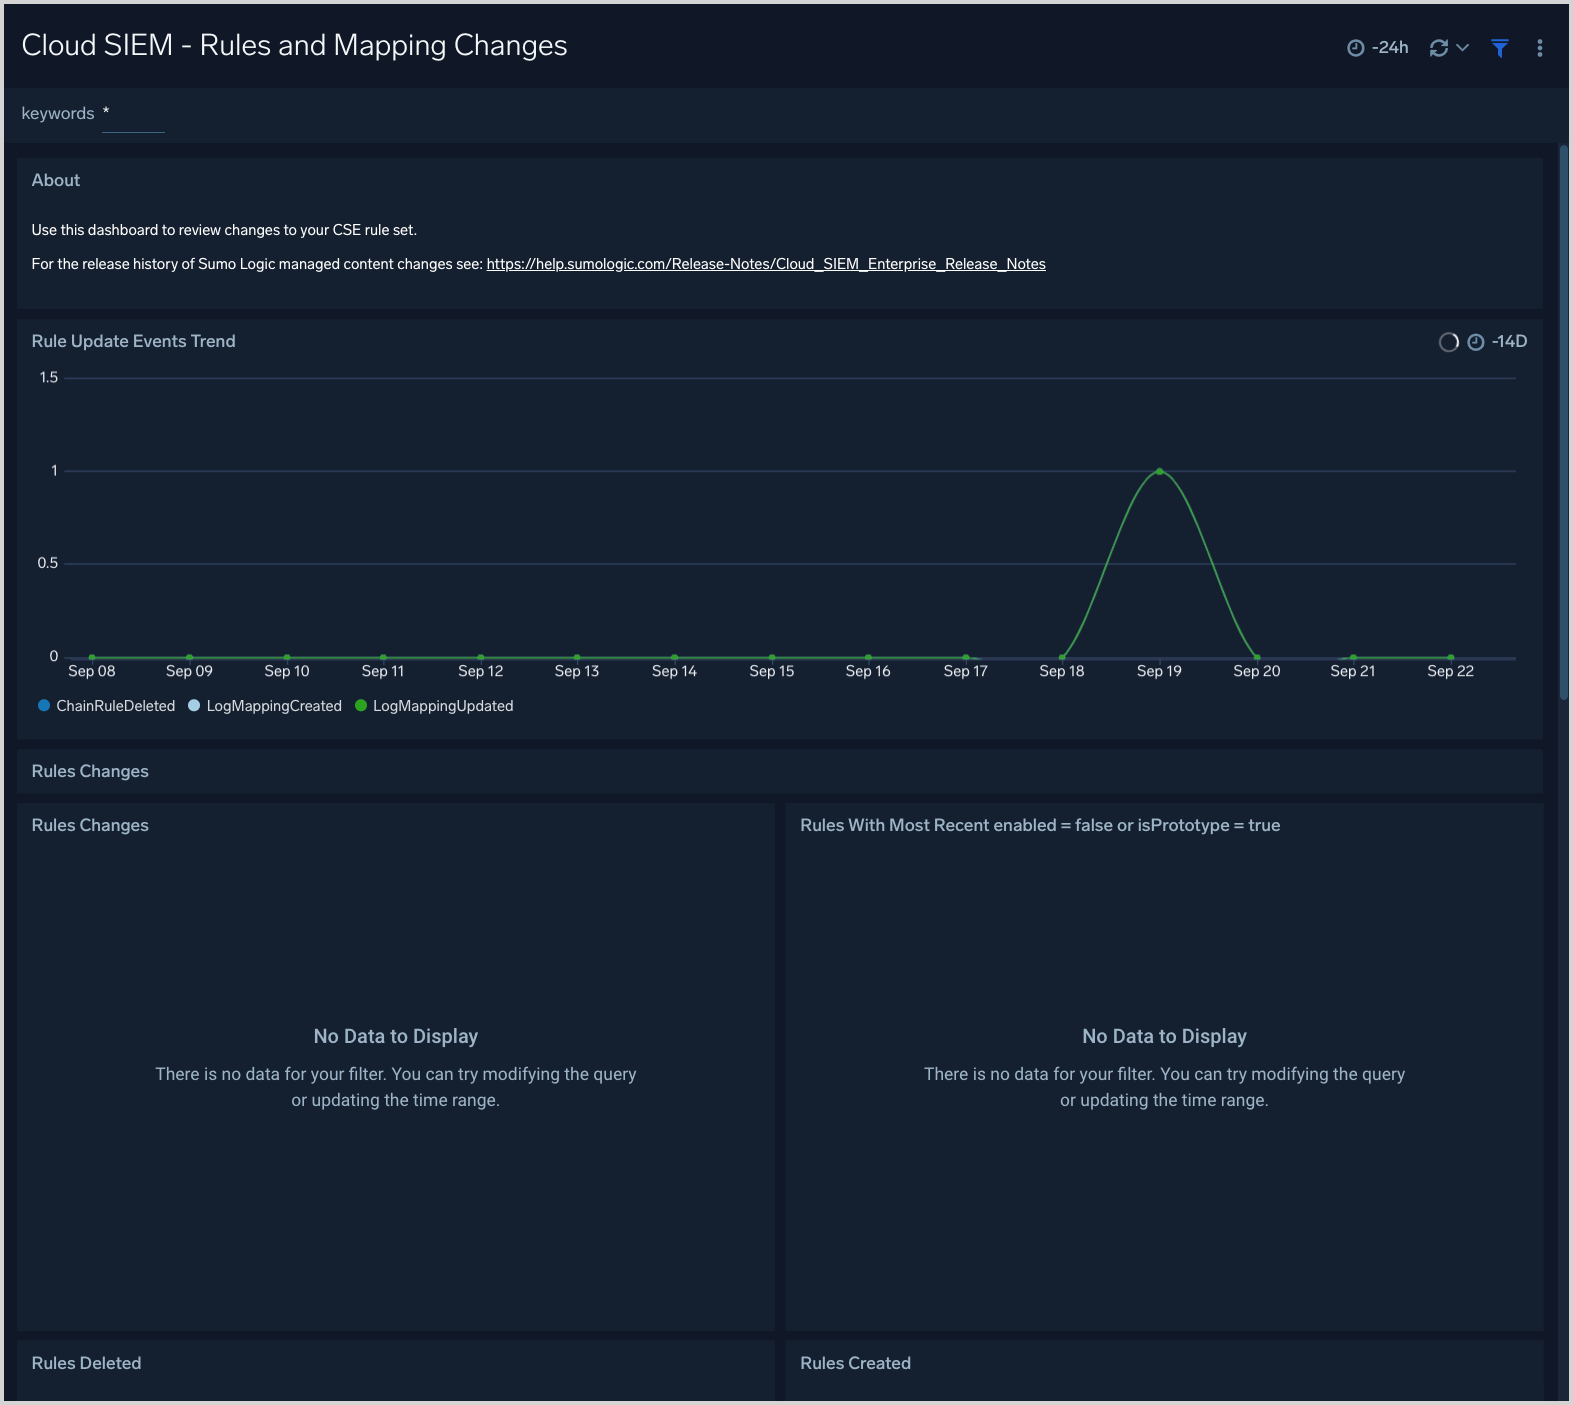
Rules and Mapping Changes
This dashboard is useful for monitoring rule management activities. It has information about CSE rules, including content management activities like rule creation, modification, and deletion. You can also see more detailed information about rule management events, such as the associated user, and the rule’s enablement and prototype status.
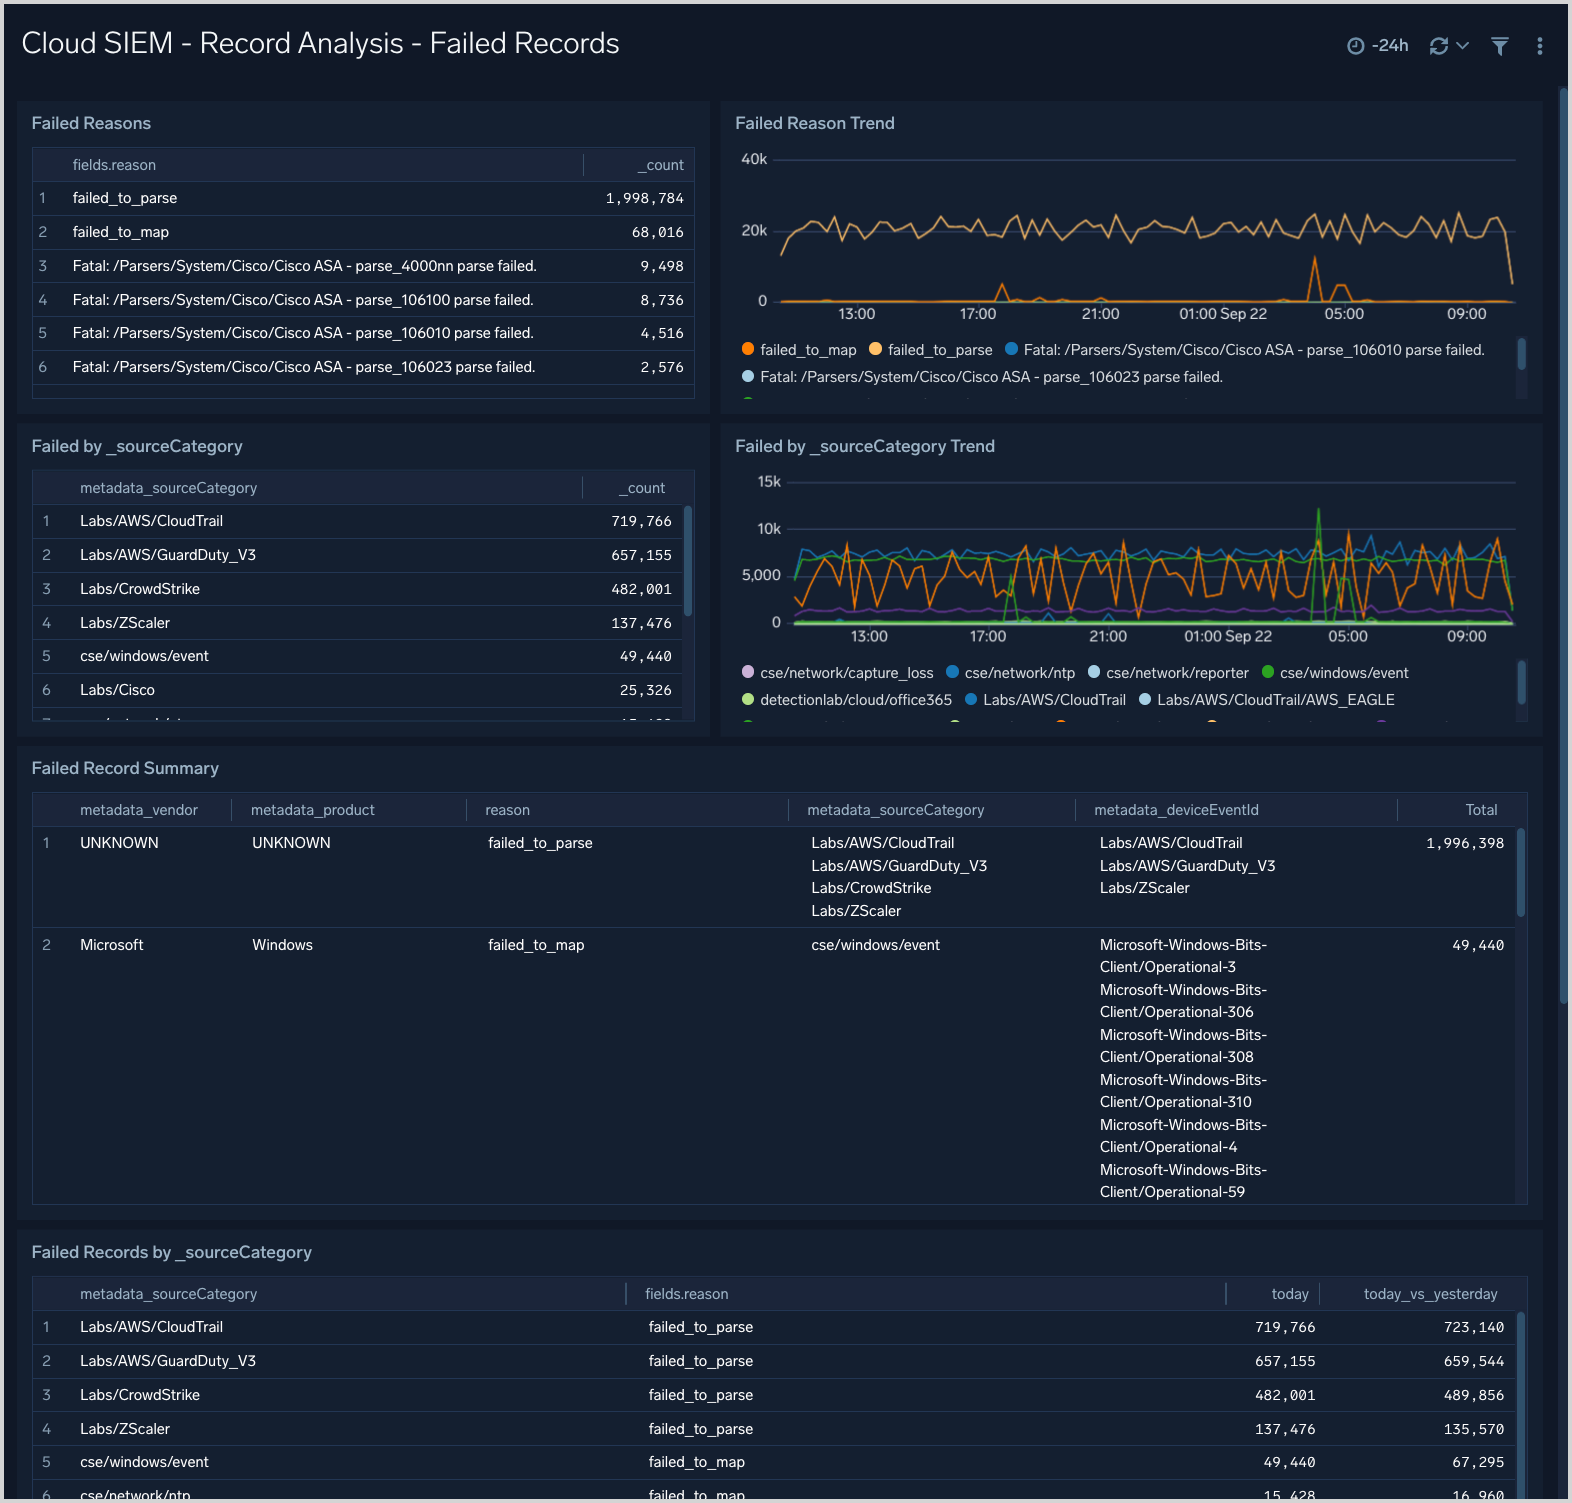
Record Analysis Failed Records
This dashboard is useful for understanding if you have messages or data sources for which CSE is unable to create normalized Records.
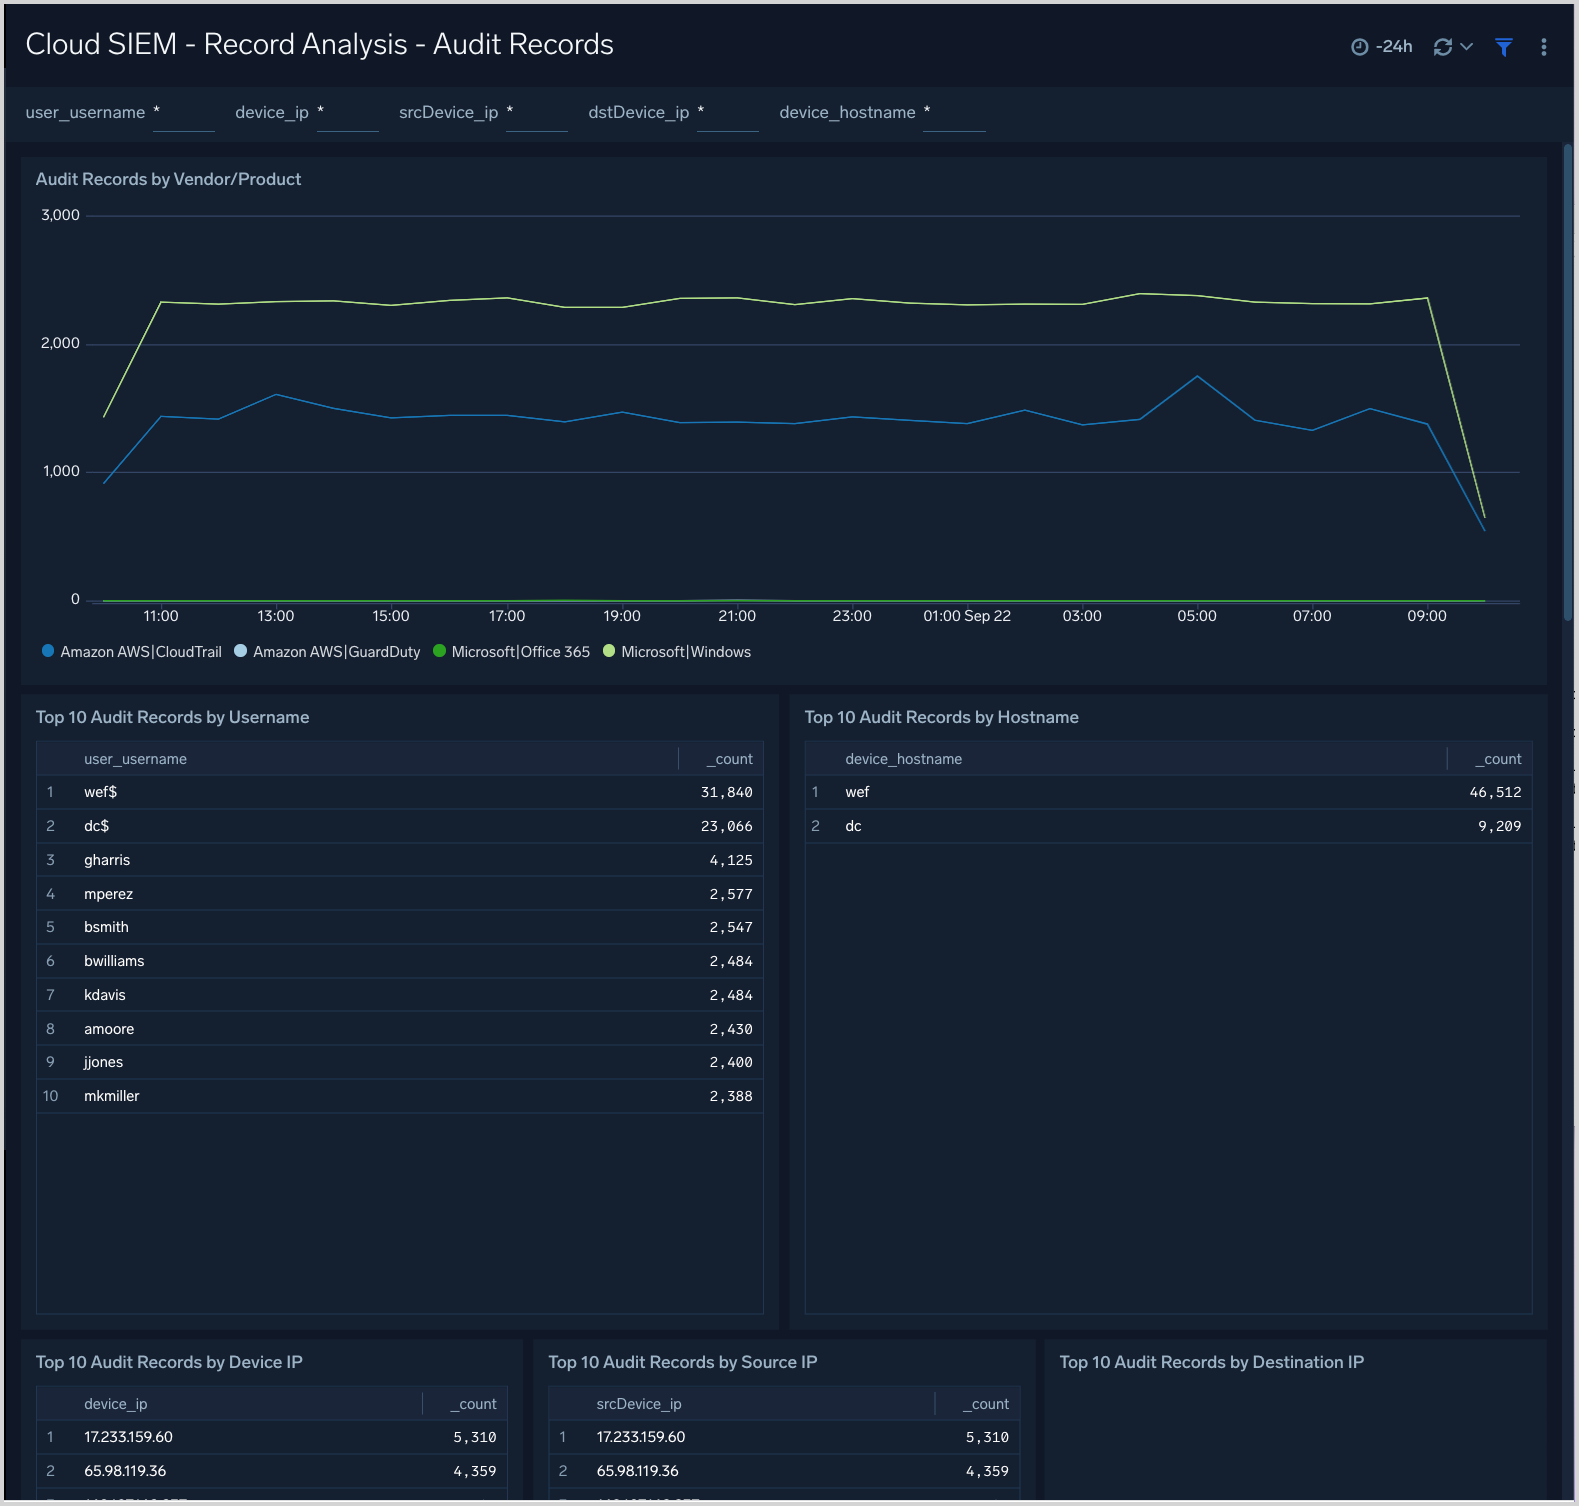
Record Analysis Audit Records
This dashboard displays metrics about Records created by CSE of the type Audit. Typically, this Record type is used for log sources that leave a basic audit trail.
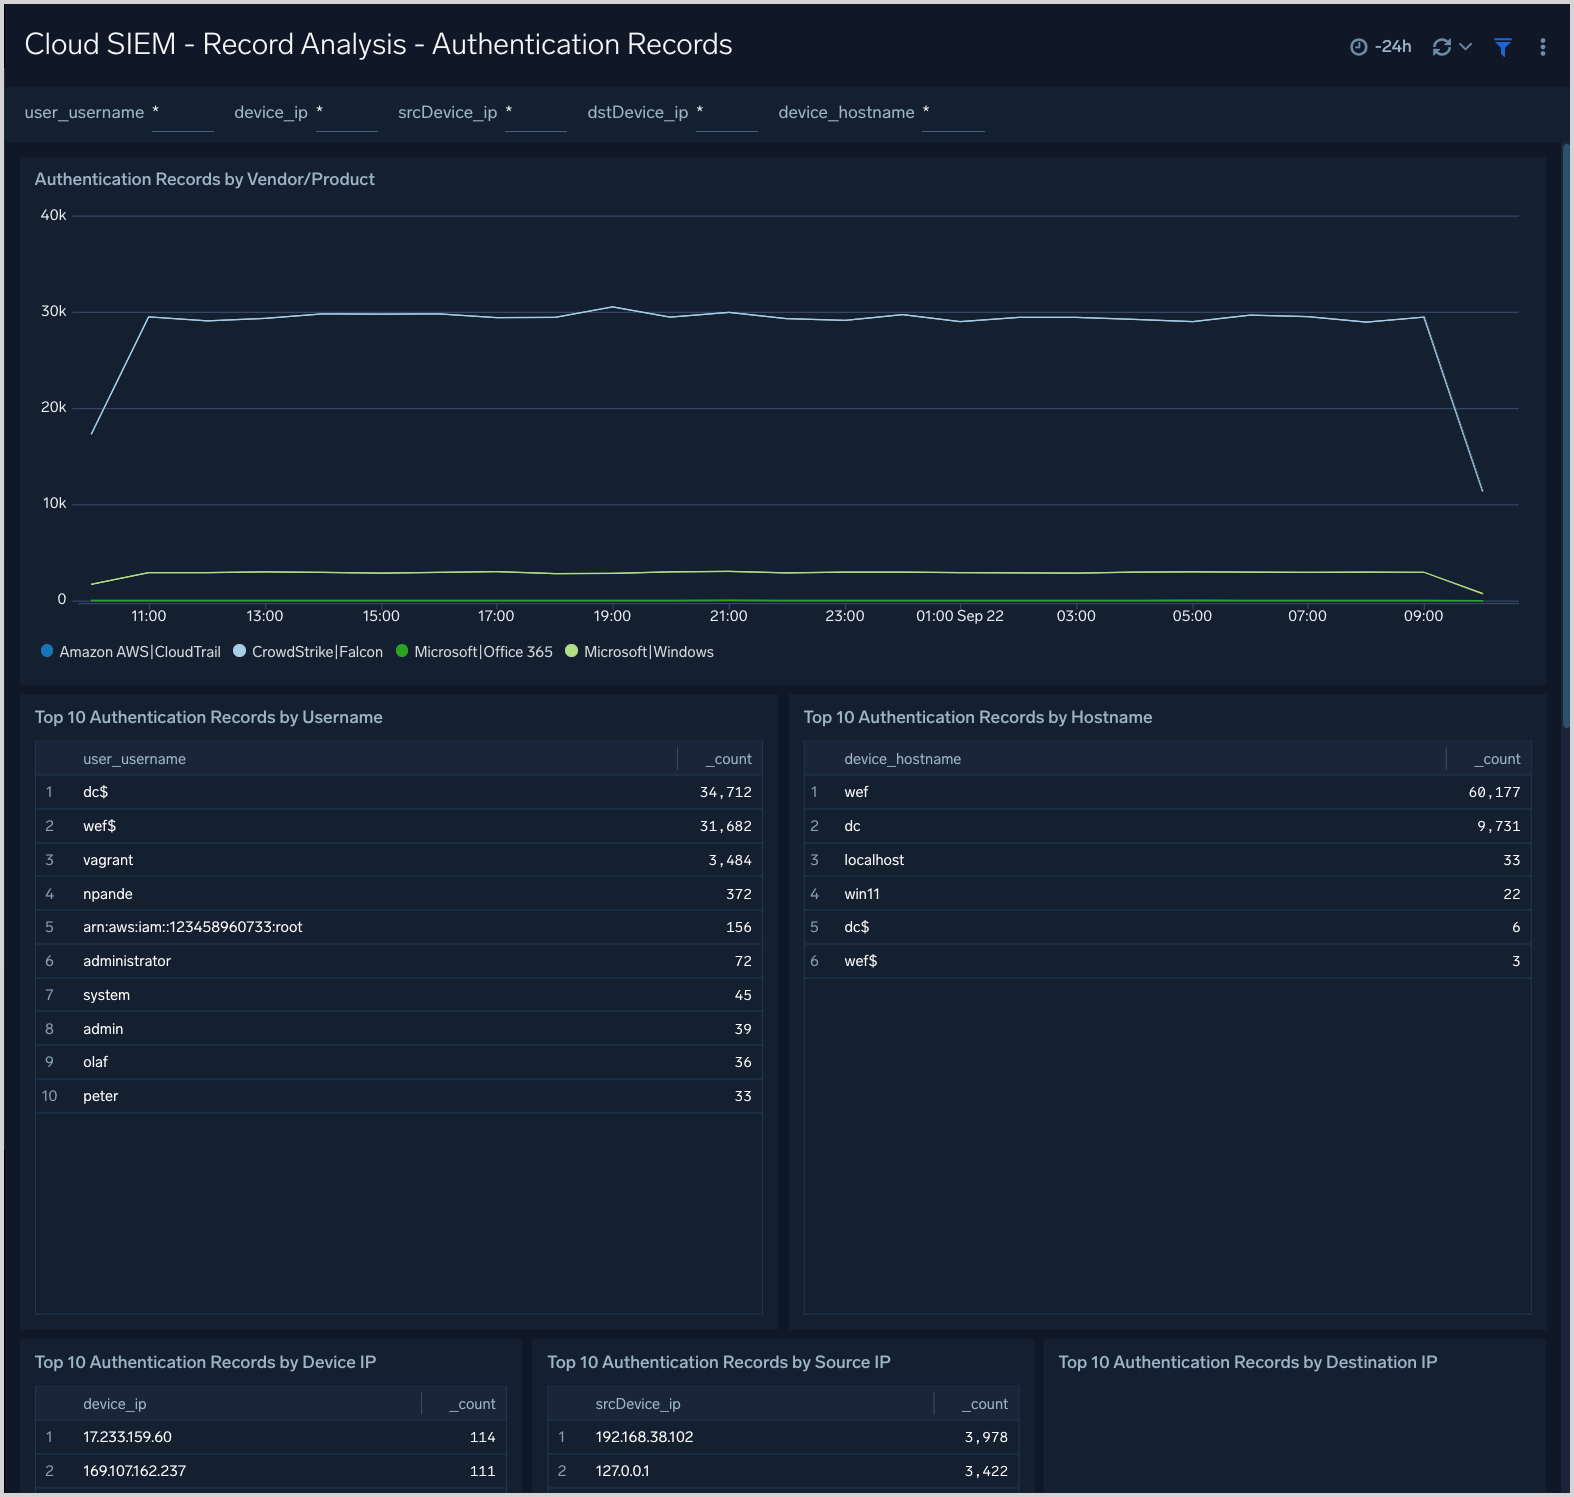
Record Analysis Authentication Records
This dashboard displays metrics about Records created by CSE of the type Authentication. Typically, this Record type is used for log sources that report successful or unsuccessful authentication events.
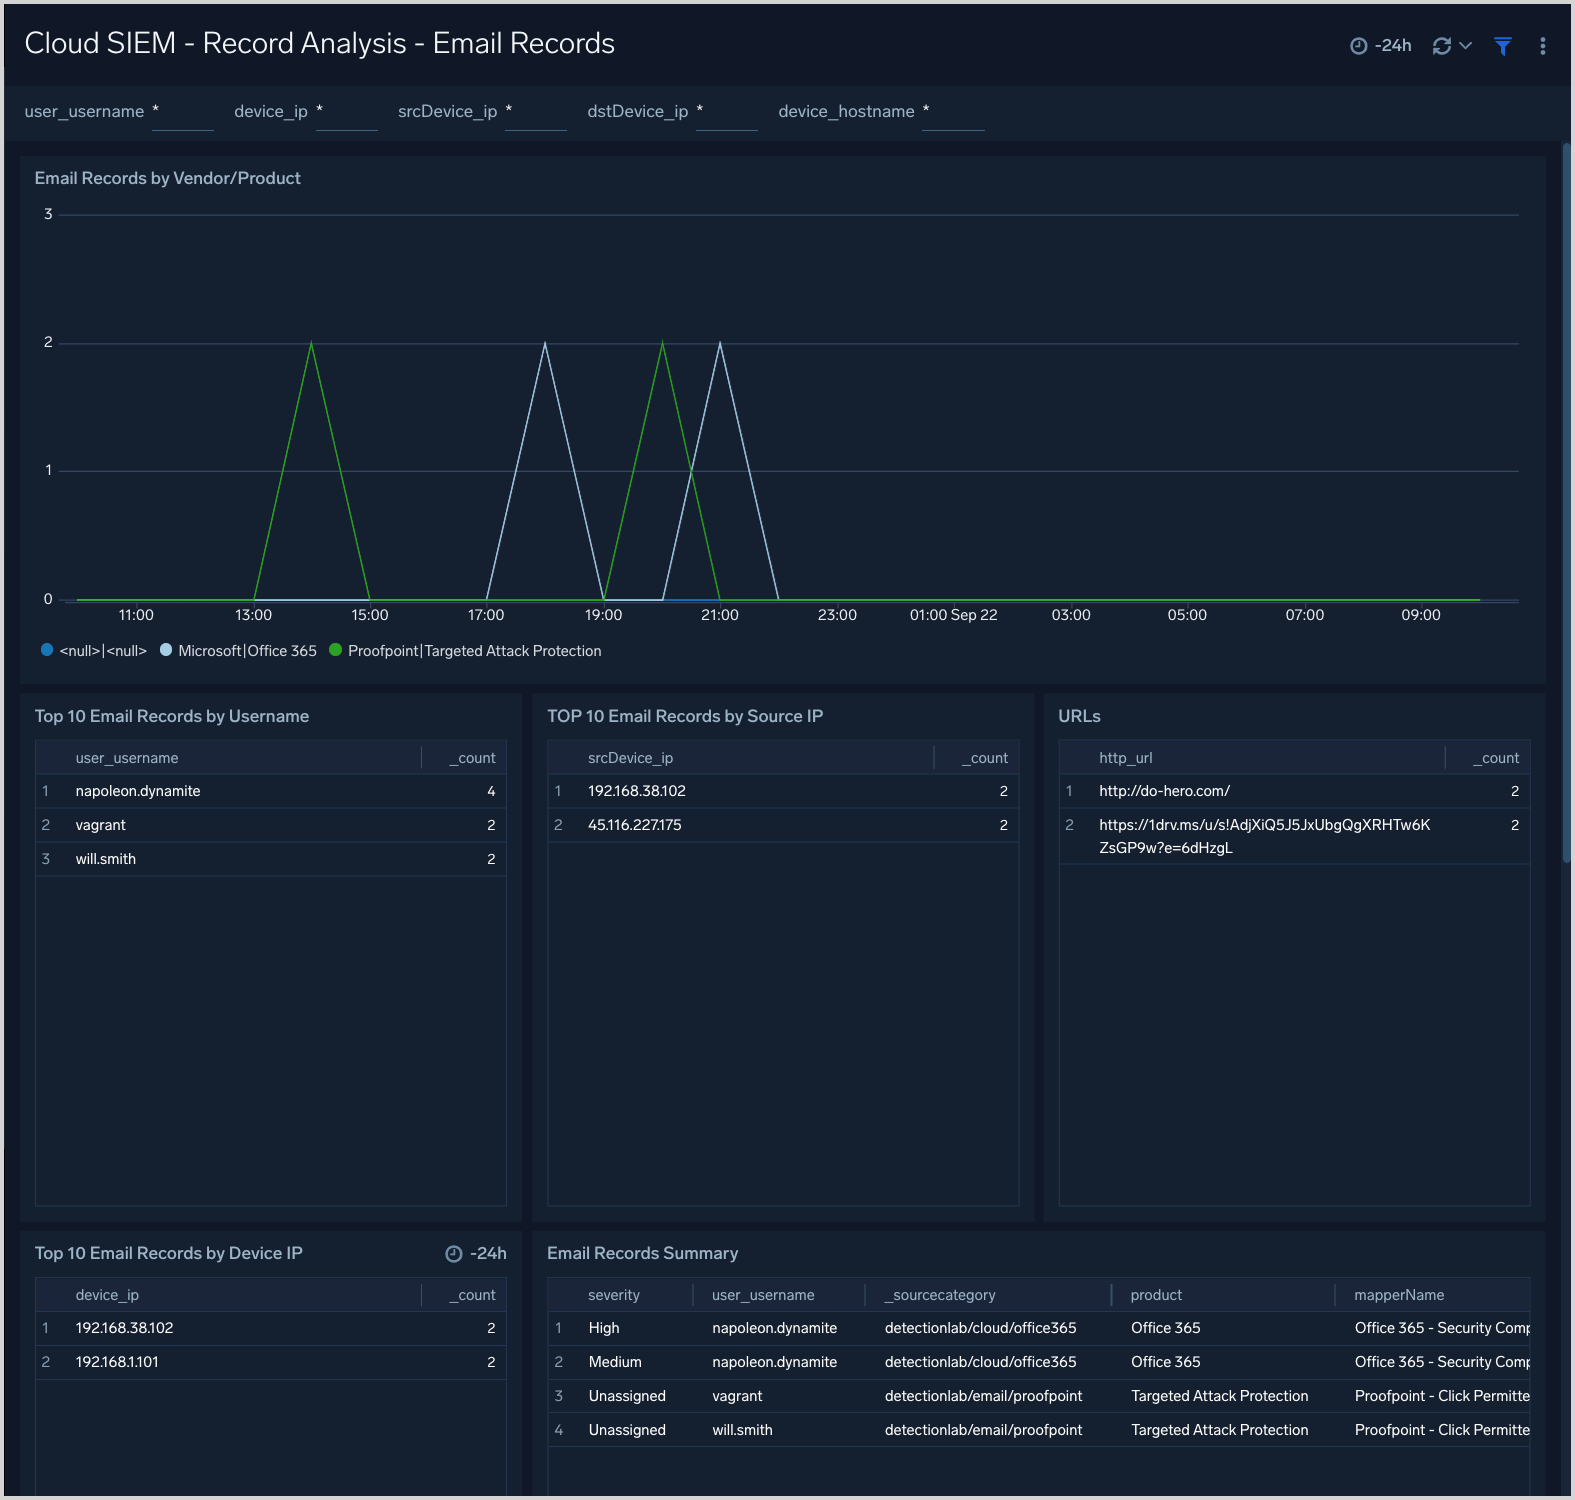
Record Analysis Email Records
This dashboard displays metrics about Records created by CSE of the type Email. Typically, this Record type is used for log sources containing email information such as email protection applications and services.
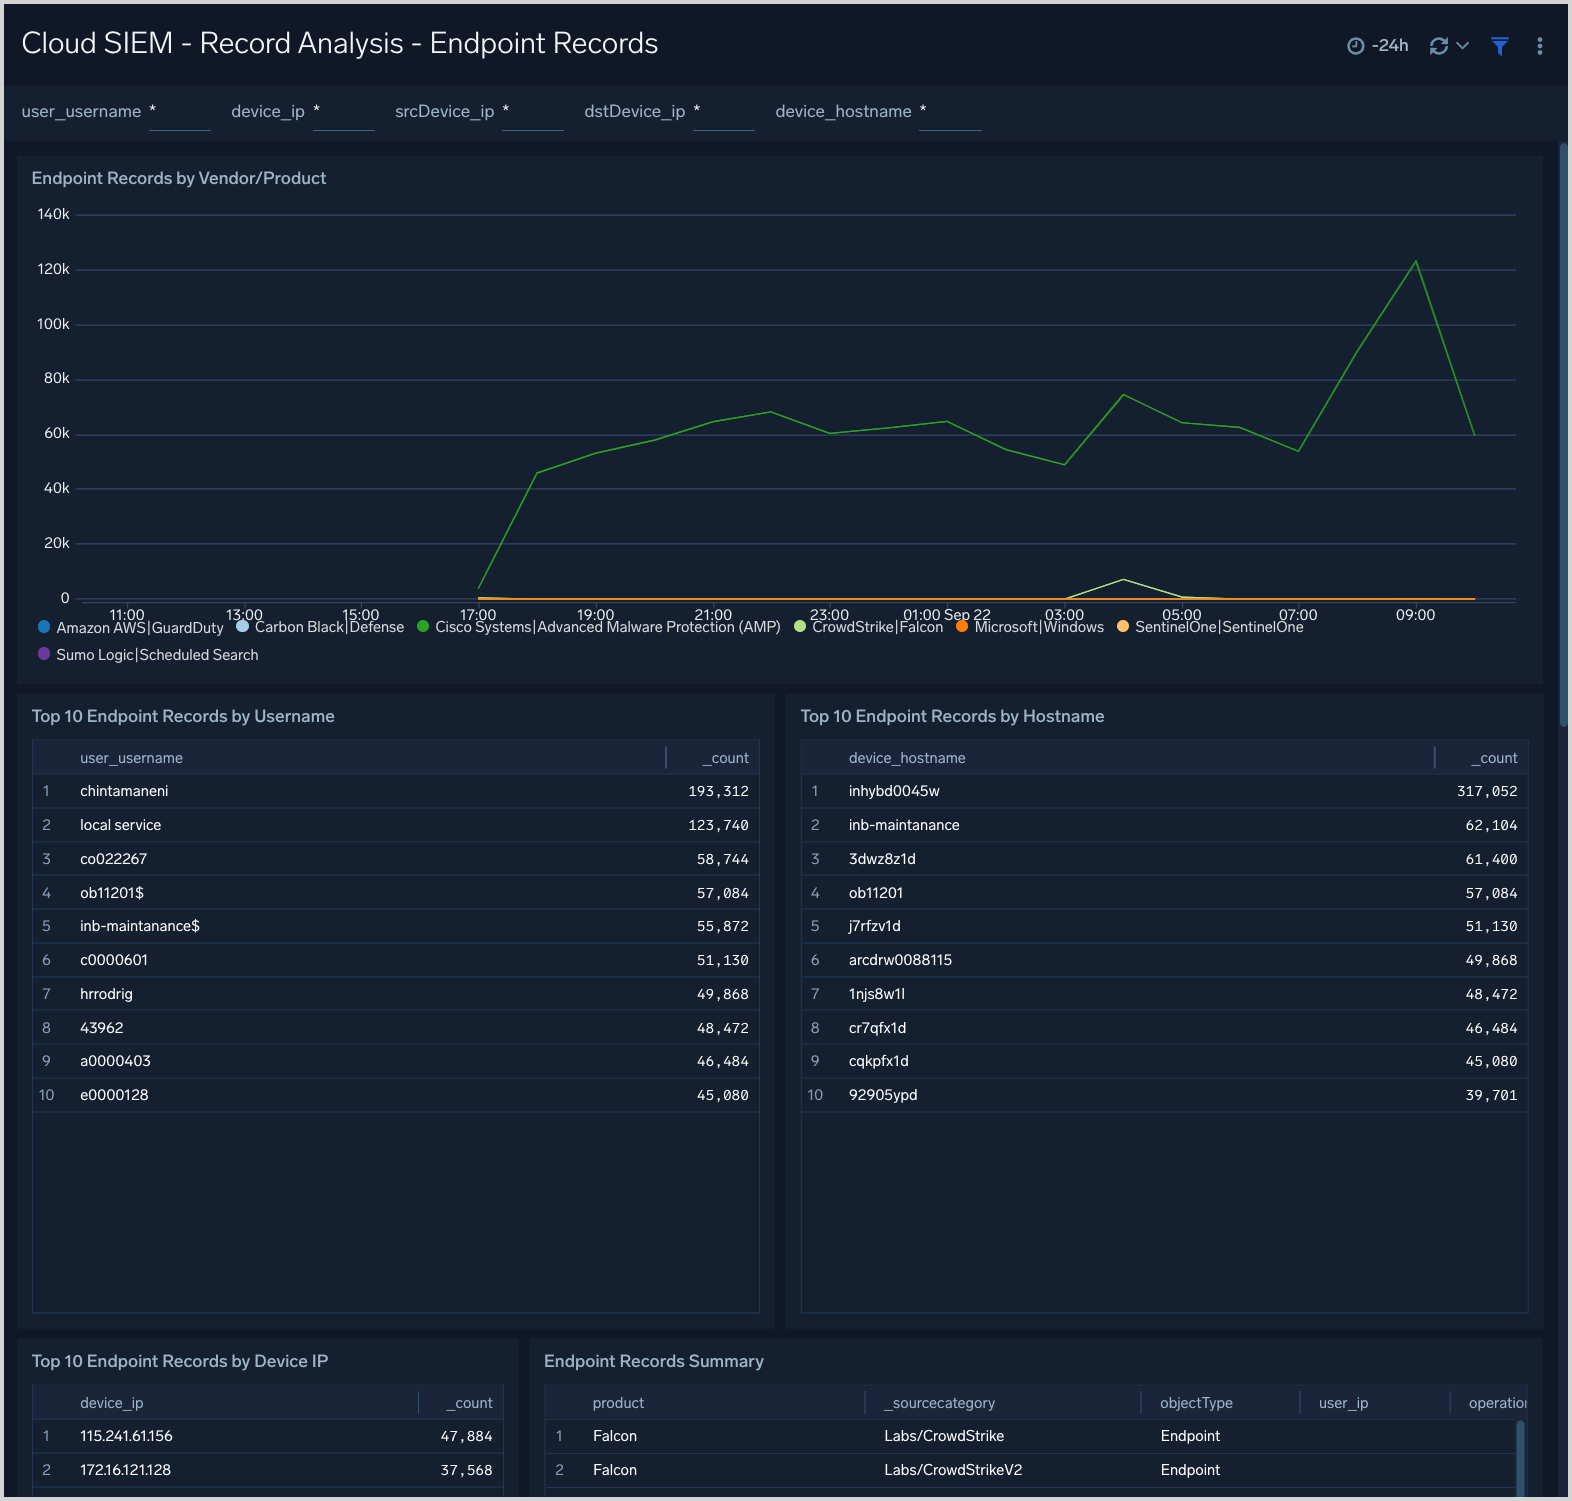
Record Analysis Endpoint Records
This dashboard displays metrics about Records created by CSE of the type Endpoint. Typically, this Record type is used for messages from endpoint security services.
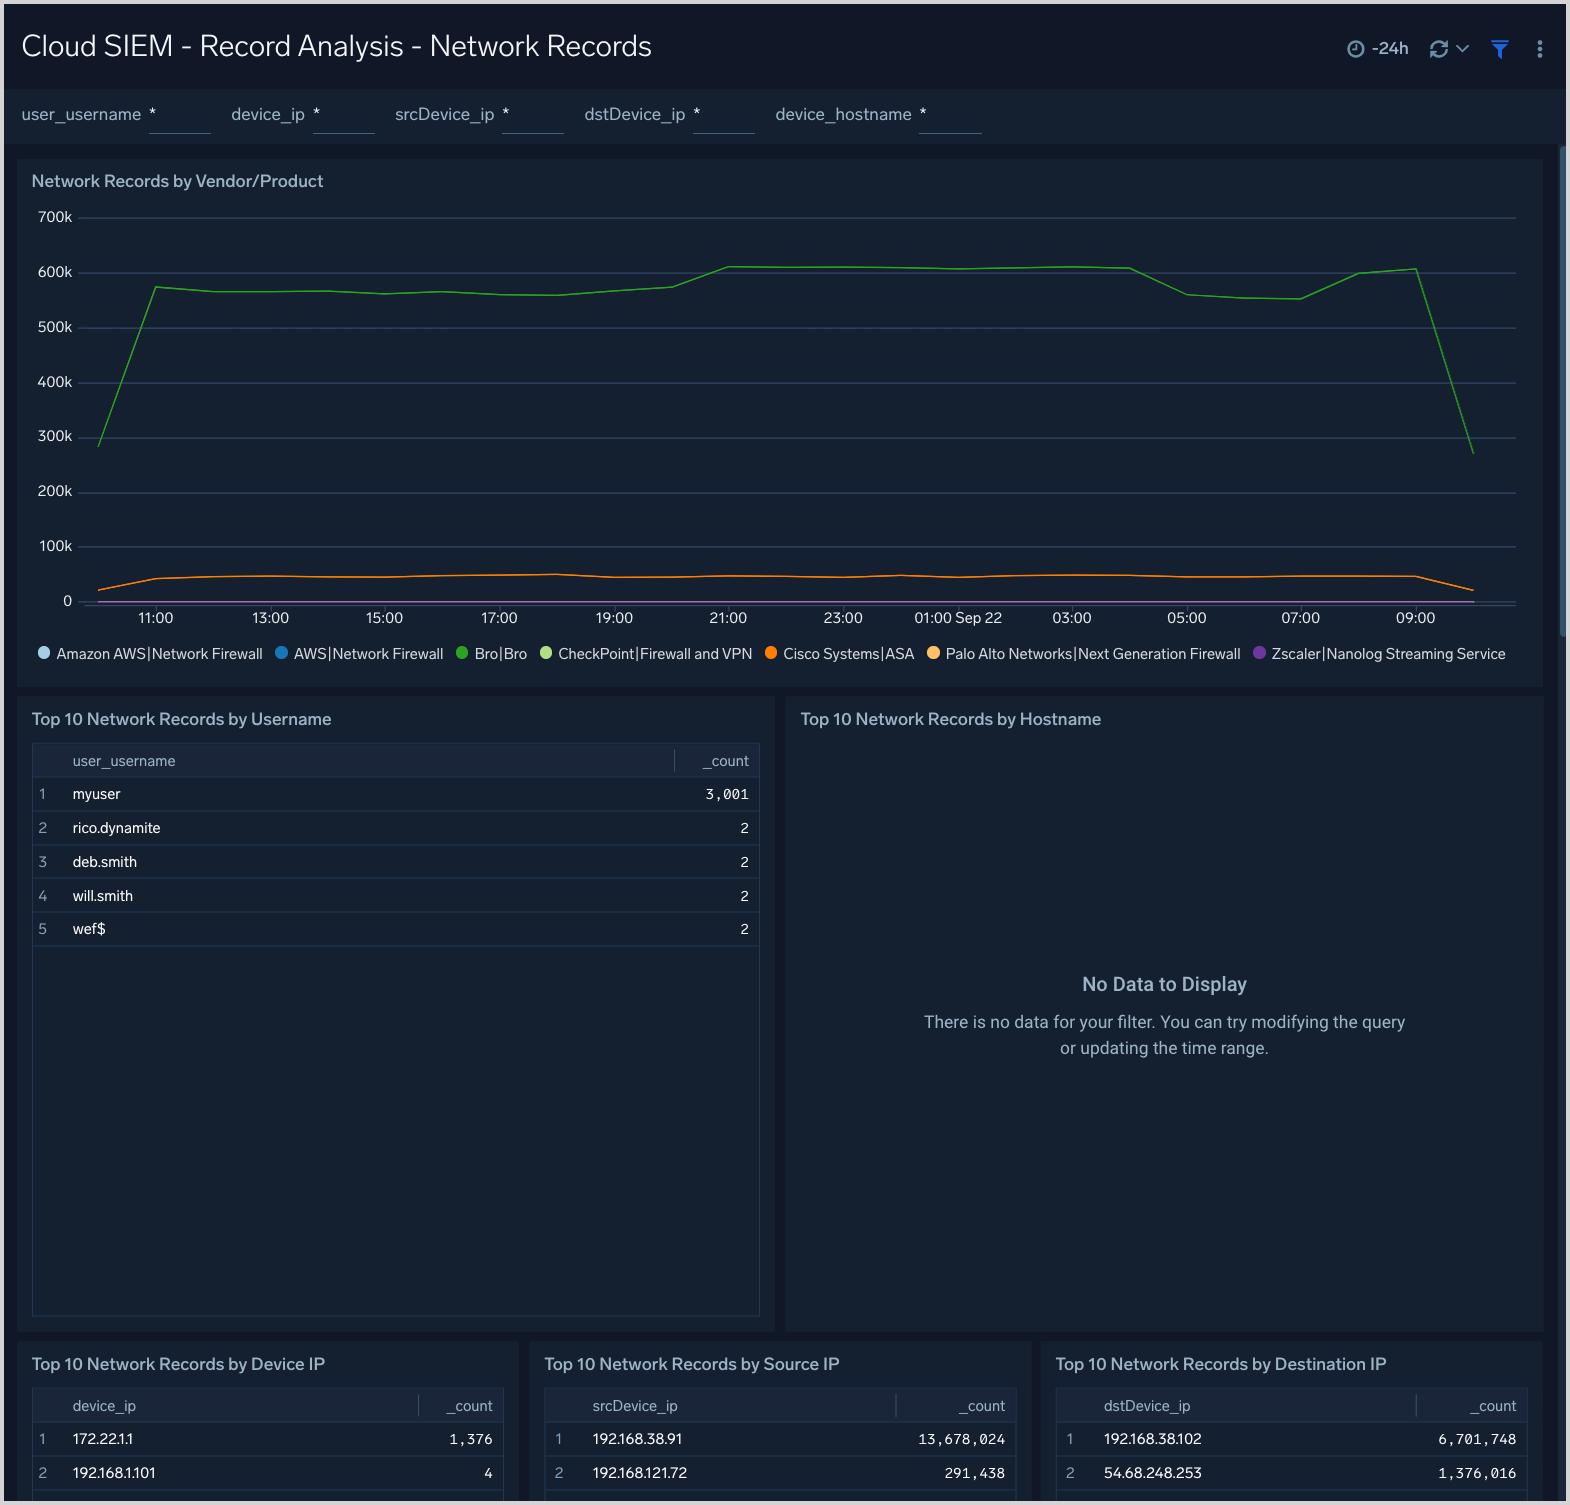
Record Analysis Network Records
This dashboard displays metrics about Records created by CSE of the type Network. Typically, this Record type is used for messages from log sources that describe network events.
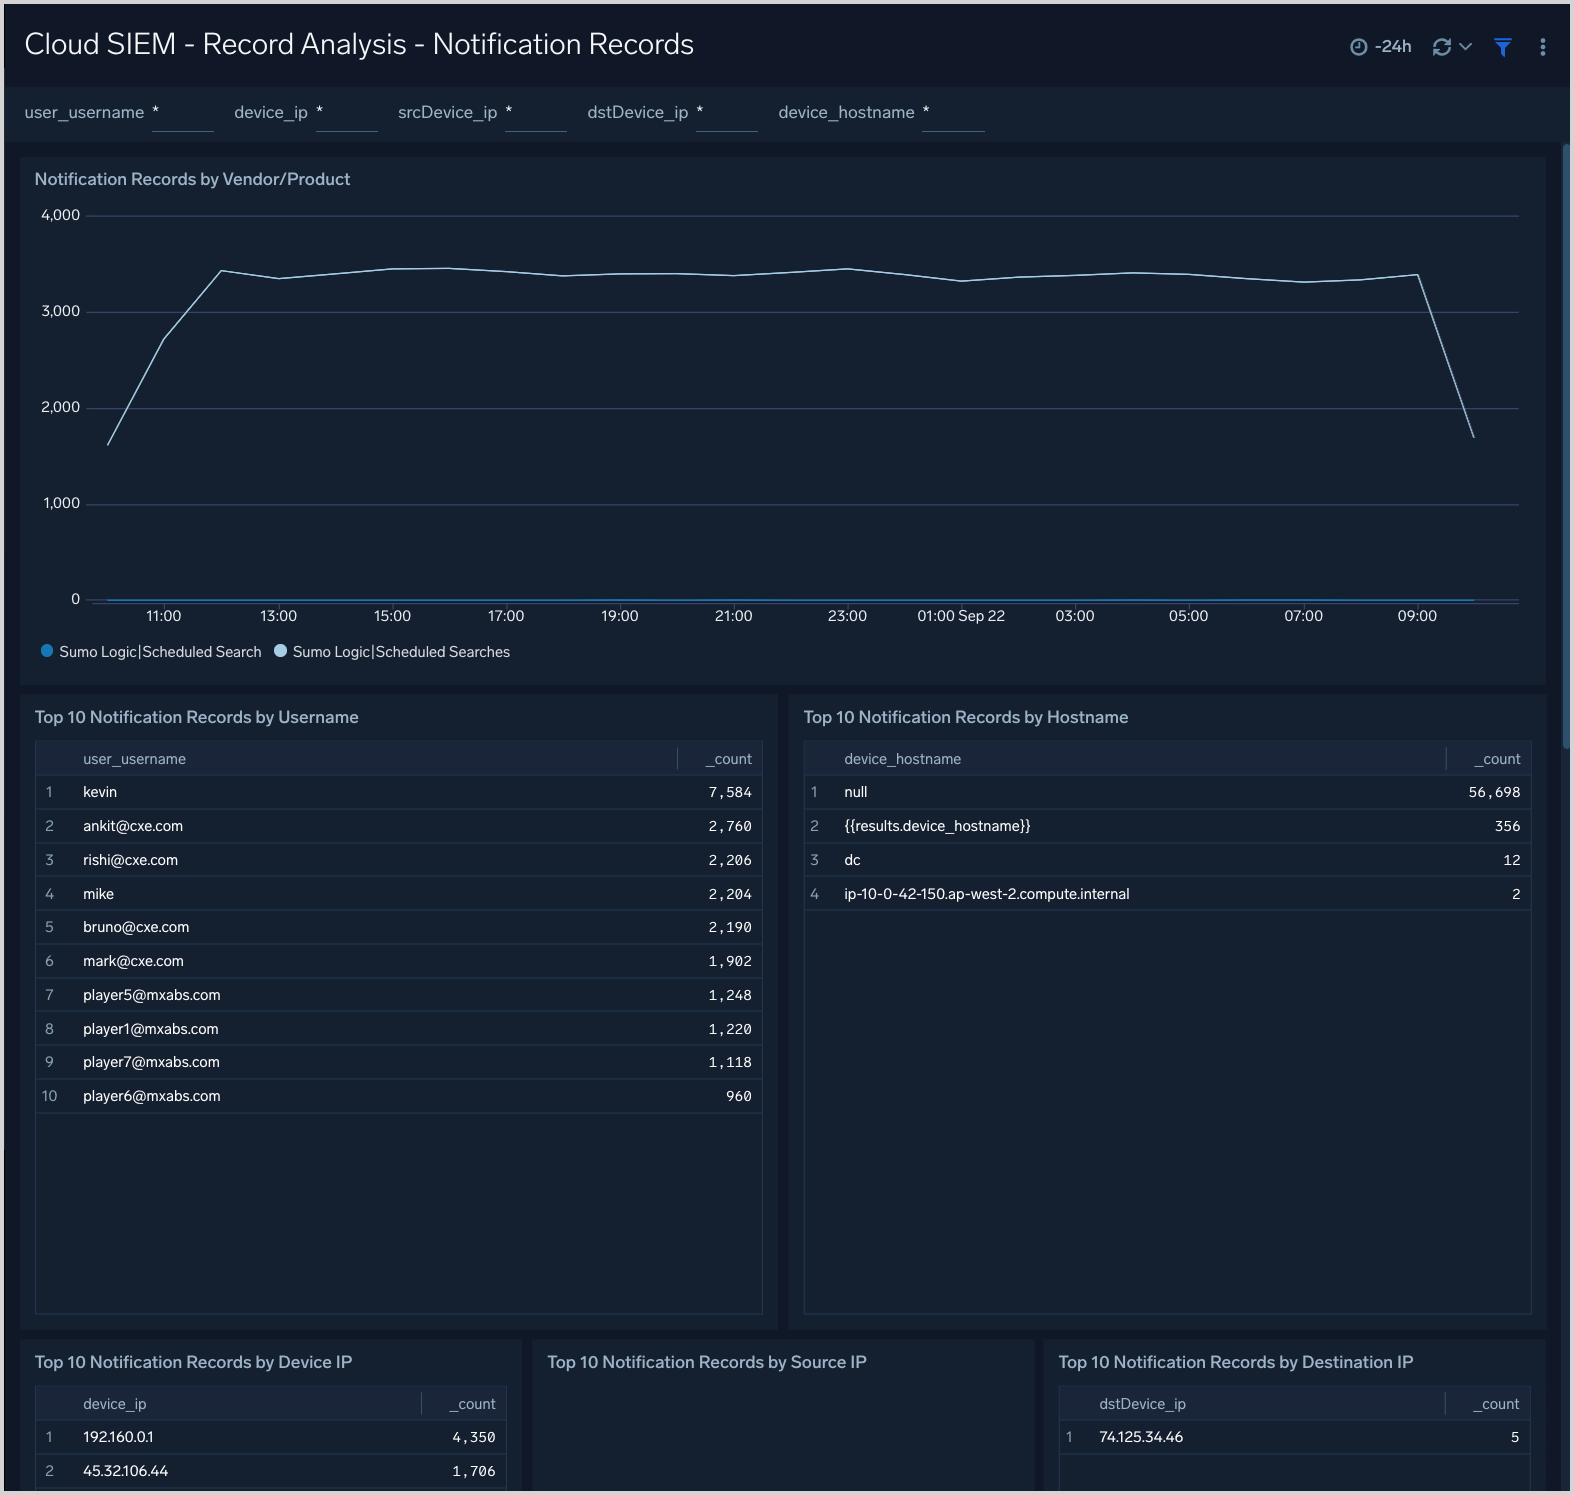
Record Analysis Notification Records
This dashboard displays metrics about Records created by CSE of the type Notification. Typically, this Record type is used for messages from services that issue notifications or alerts, like threat detection and response systems.
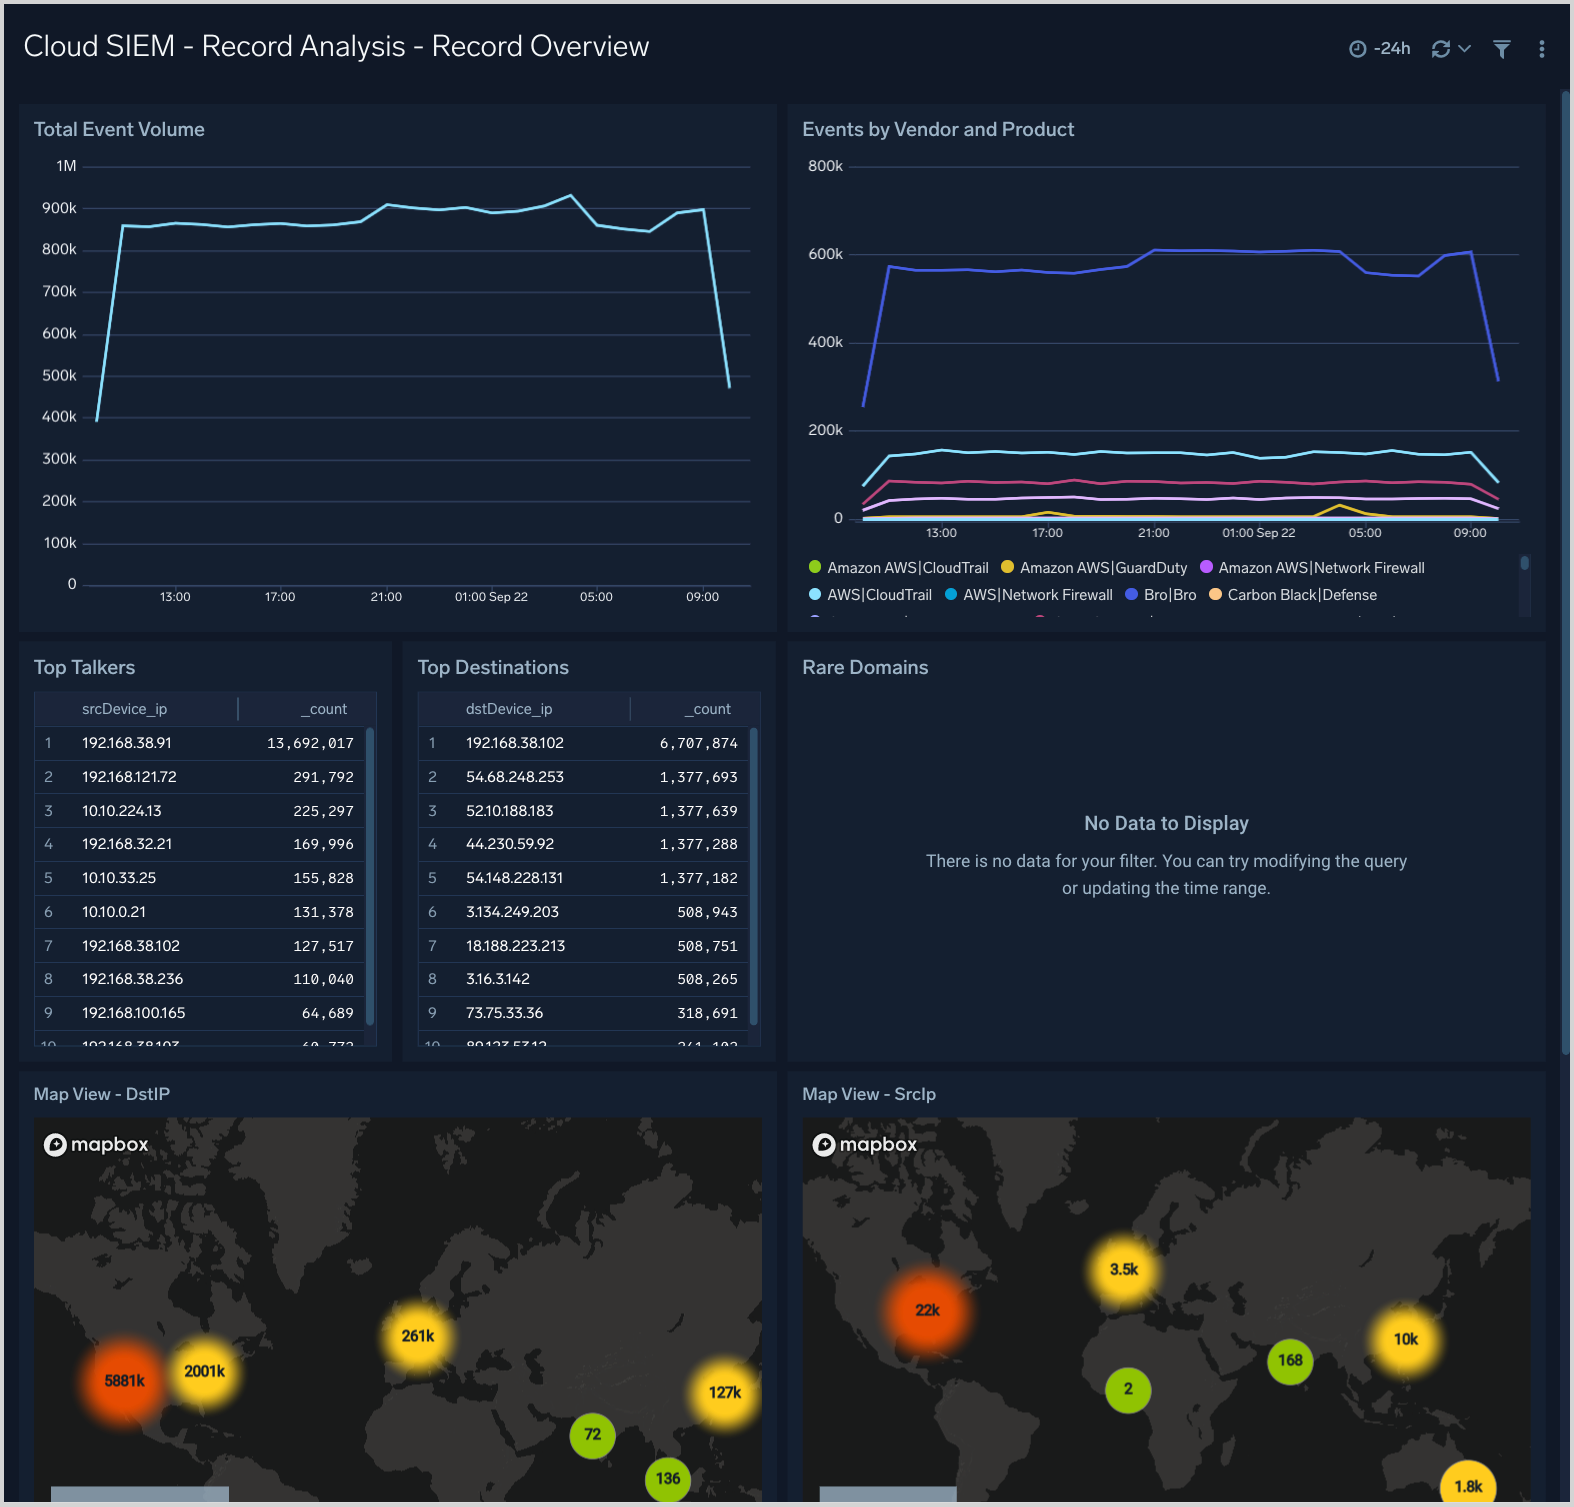
Record Analysis Record Overview
This dashboard provides an overview of CSE Records by source, destination, volume, and vendor and product.
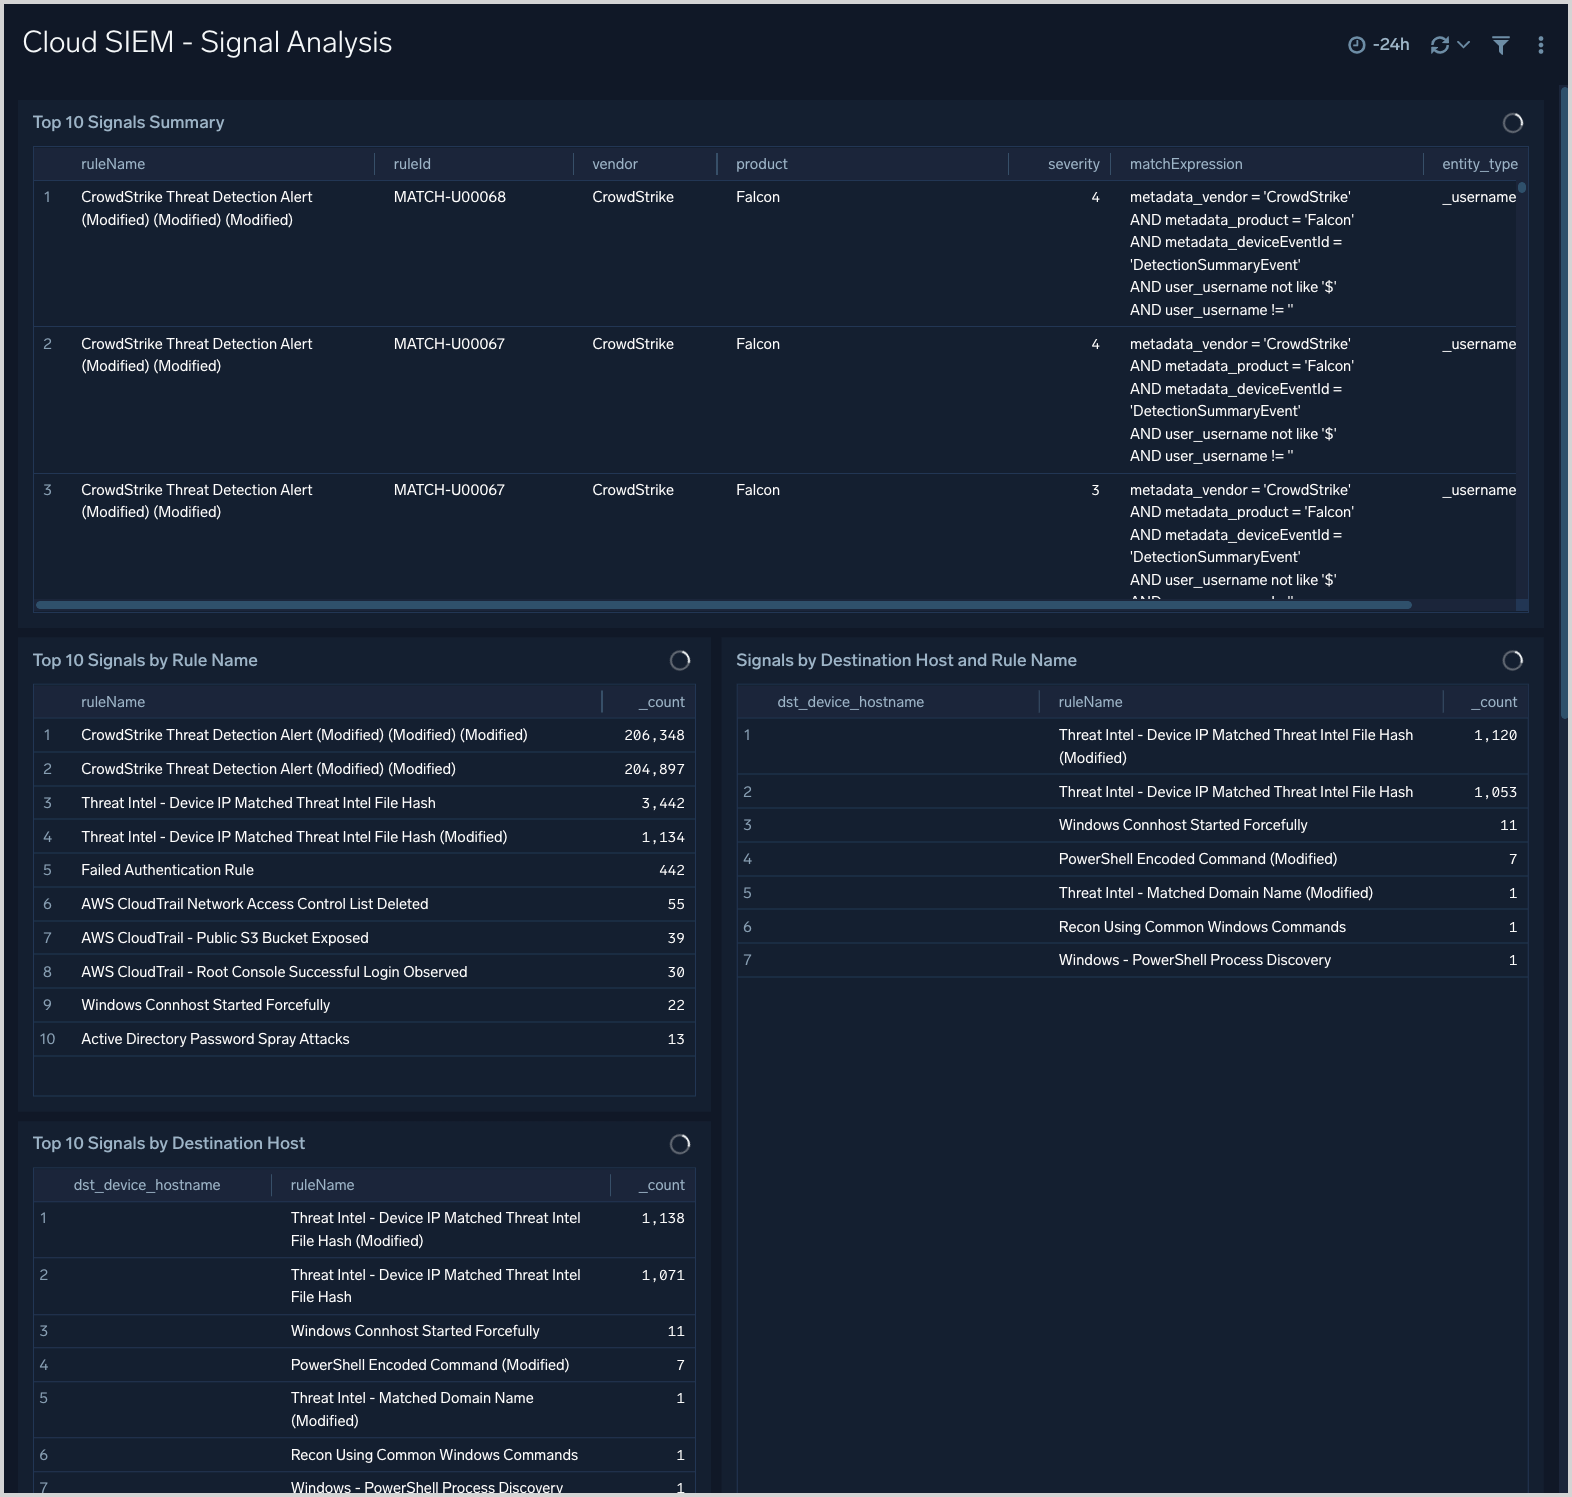
Signal Analysis
This dashboard presents metrics about Signals that have been fired, including breakdowns by rule, host, and IP address.
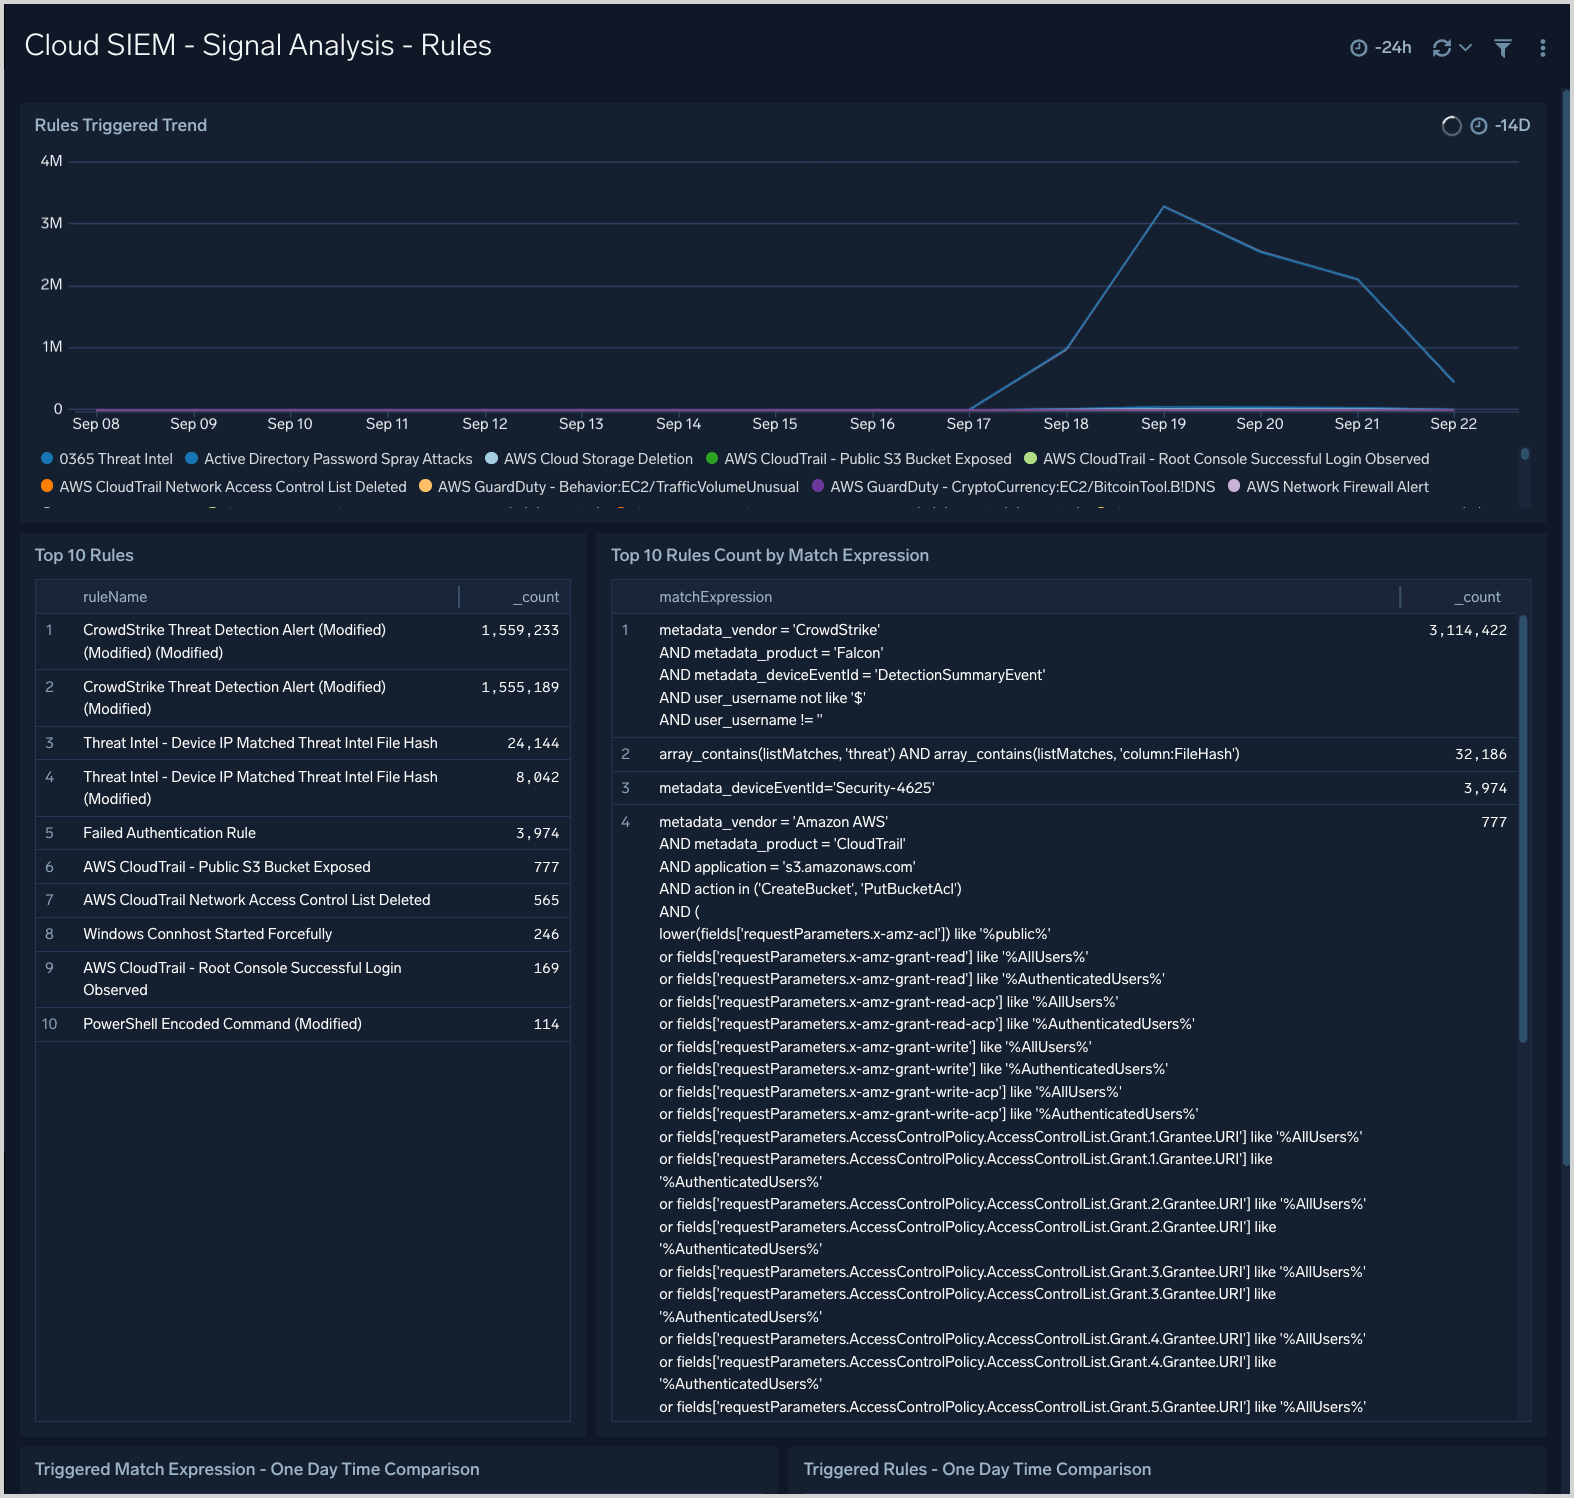
Signal Analysis Rules
This dashboard provides trend analysis of triggered rules, rules by match expression and top rules triggered.
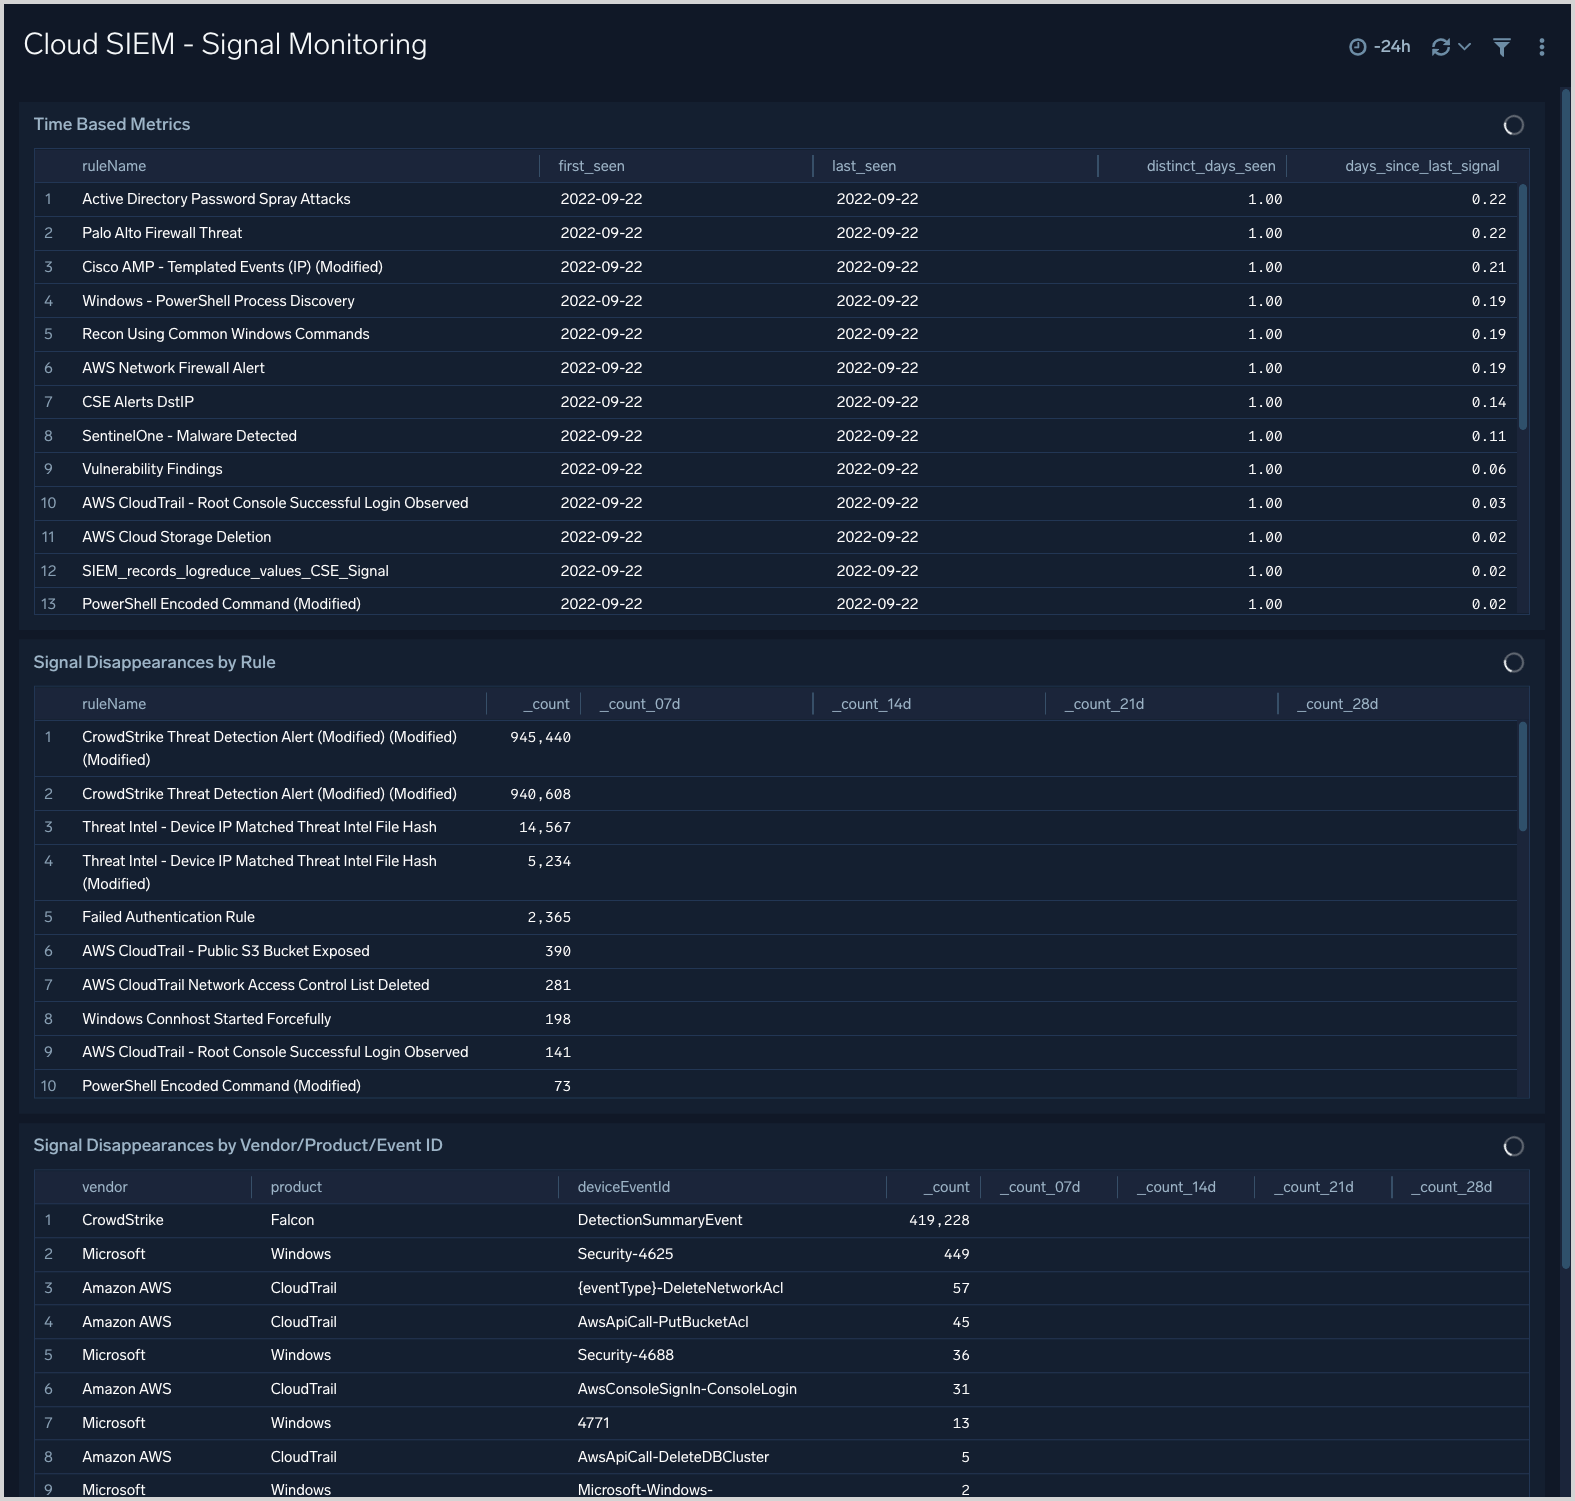
Signal Monitoring
This dashboard provides times-based metrics for CSE Signals, and Signal disappearance metrics.
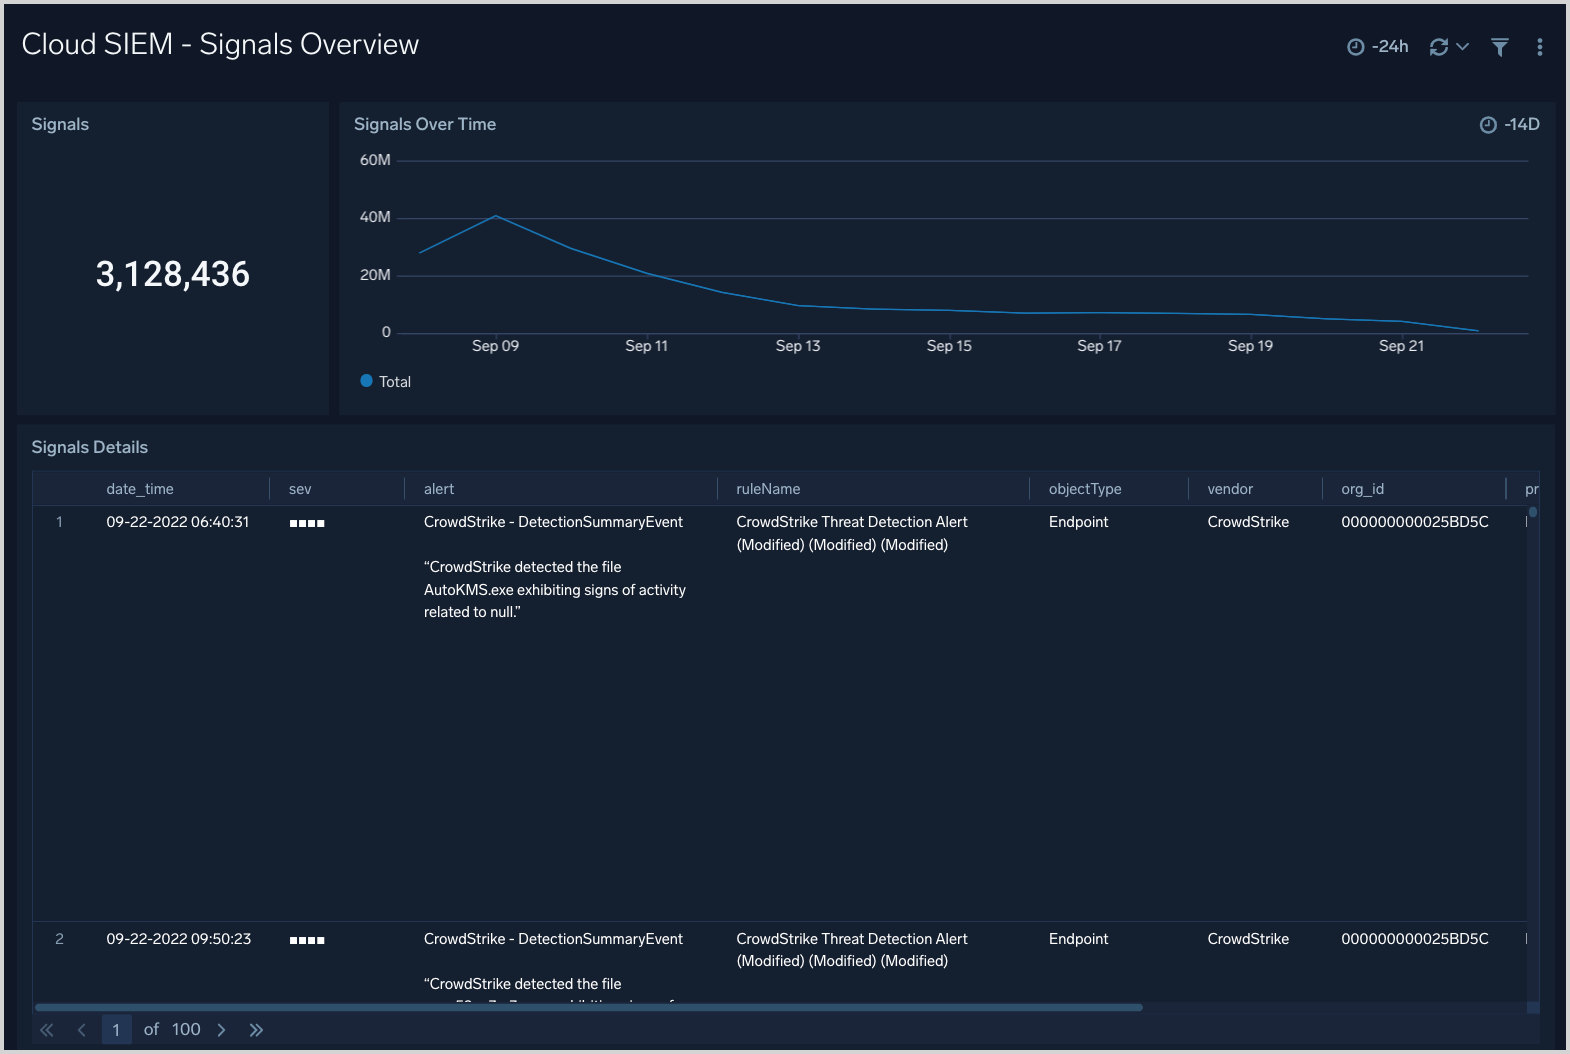
Signals Overview
This dashboard provides an overview of Signal activity, including Signal count over time, and a table of summary information for generated Signals.
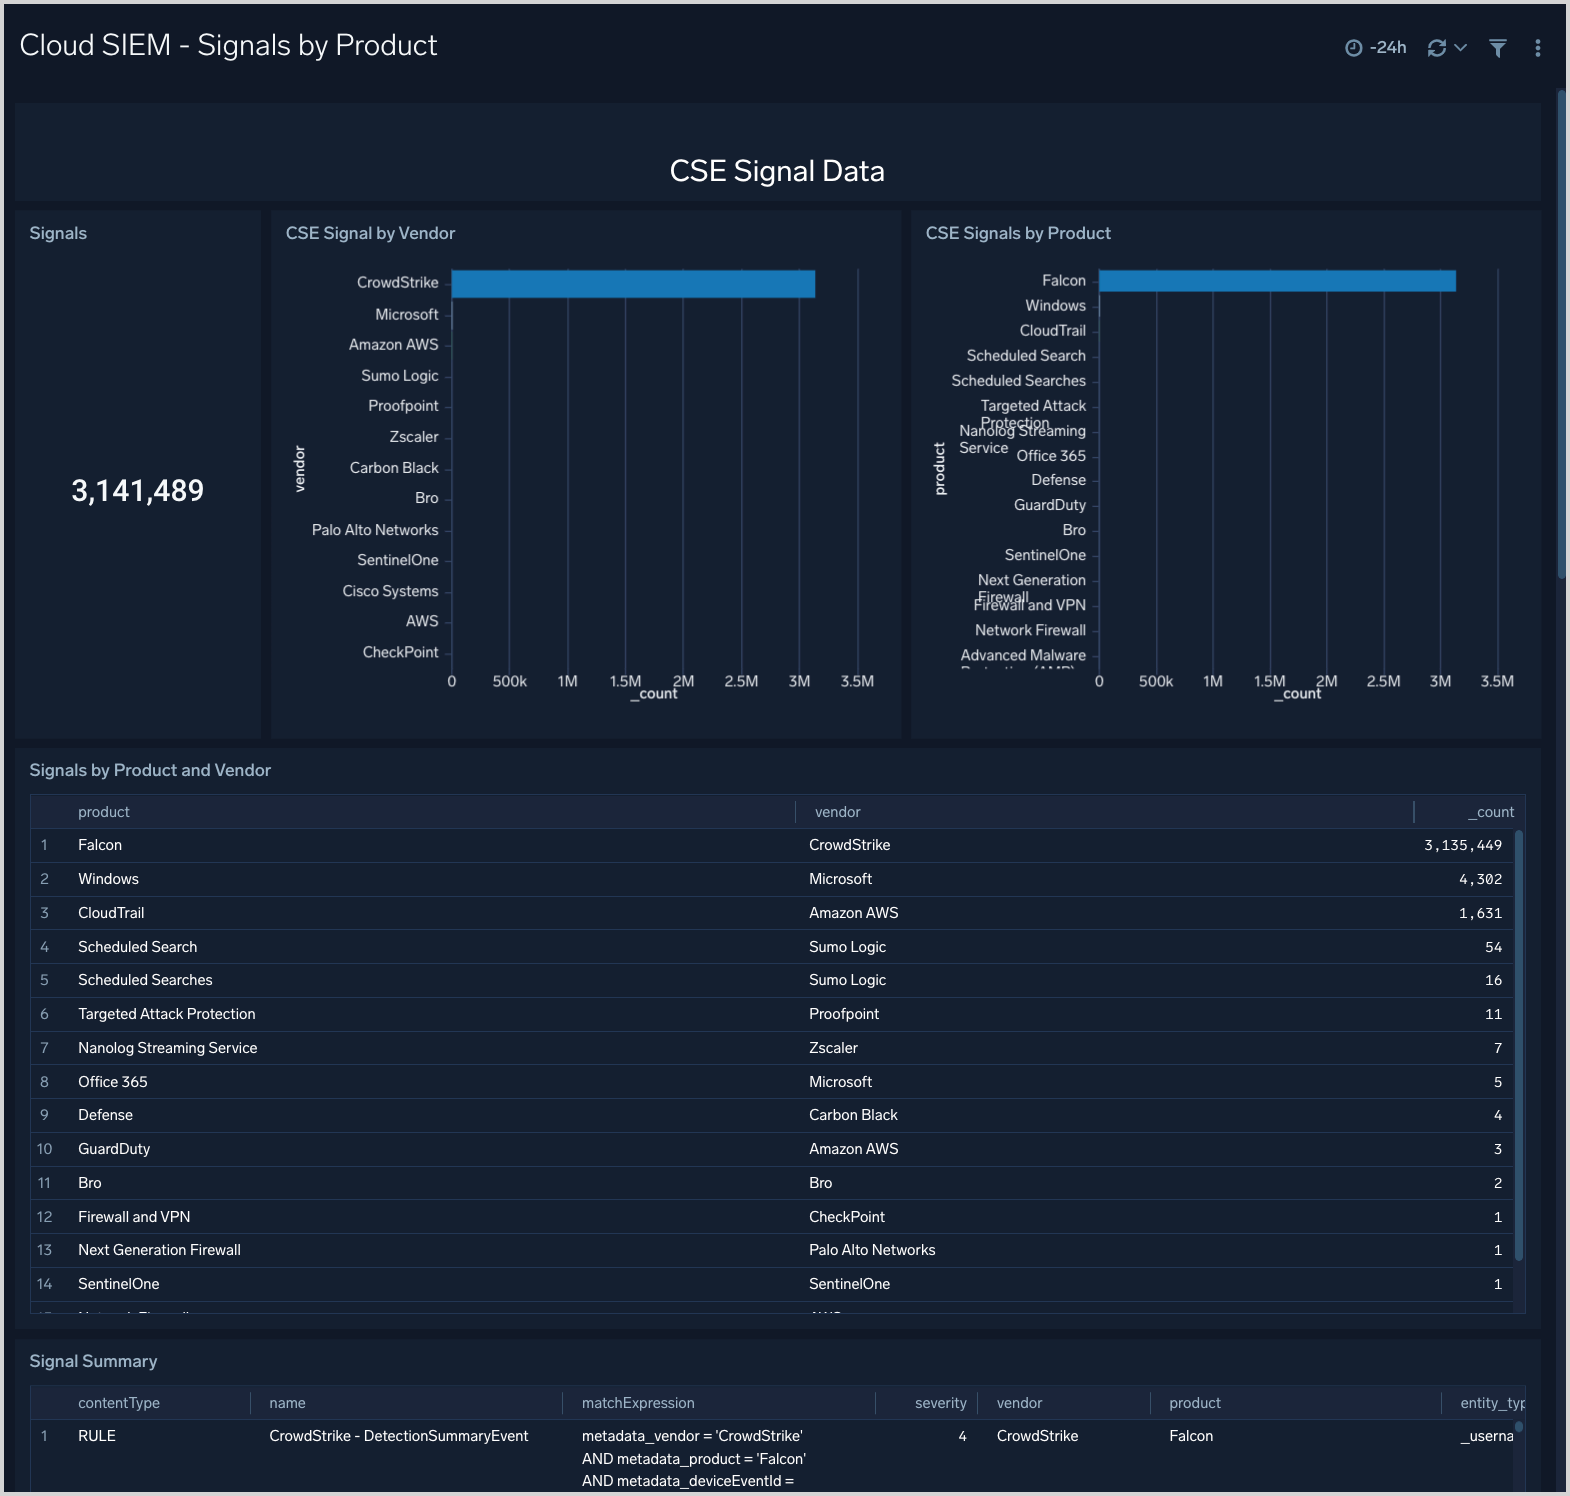
 static/img/integrations/sumo-apps/signals-by-product.png
Signals by Product
This dashboard shows breakdowns of Signal by product and vendor.
