Diagnose with the Observability Solution
After you have identified an issue using the available monitoring tools, the next step is to diagnose the issue and narrow down your investigation to specific services. The Observability Solution offers the following features to diagnose application issues.
Connect the dots with Entity Inspector
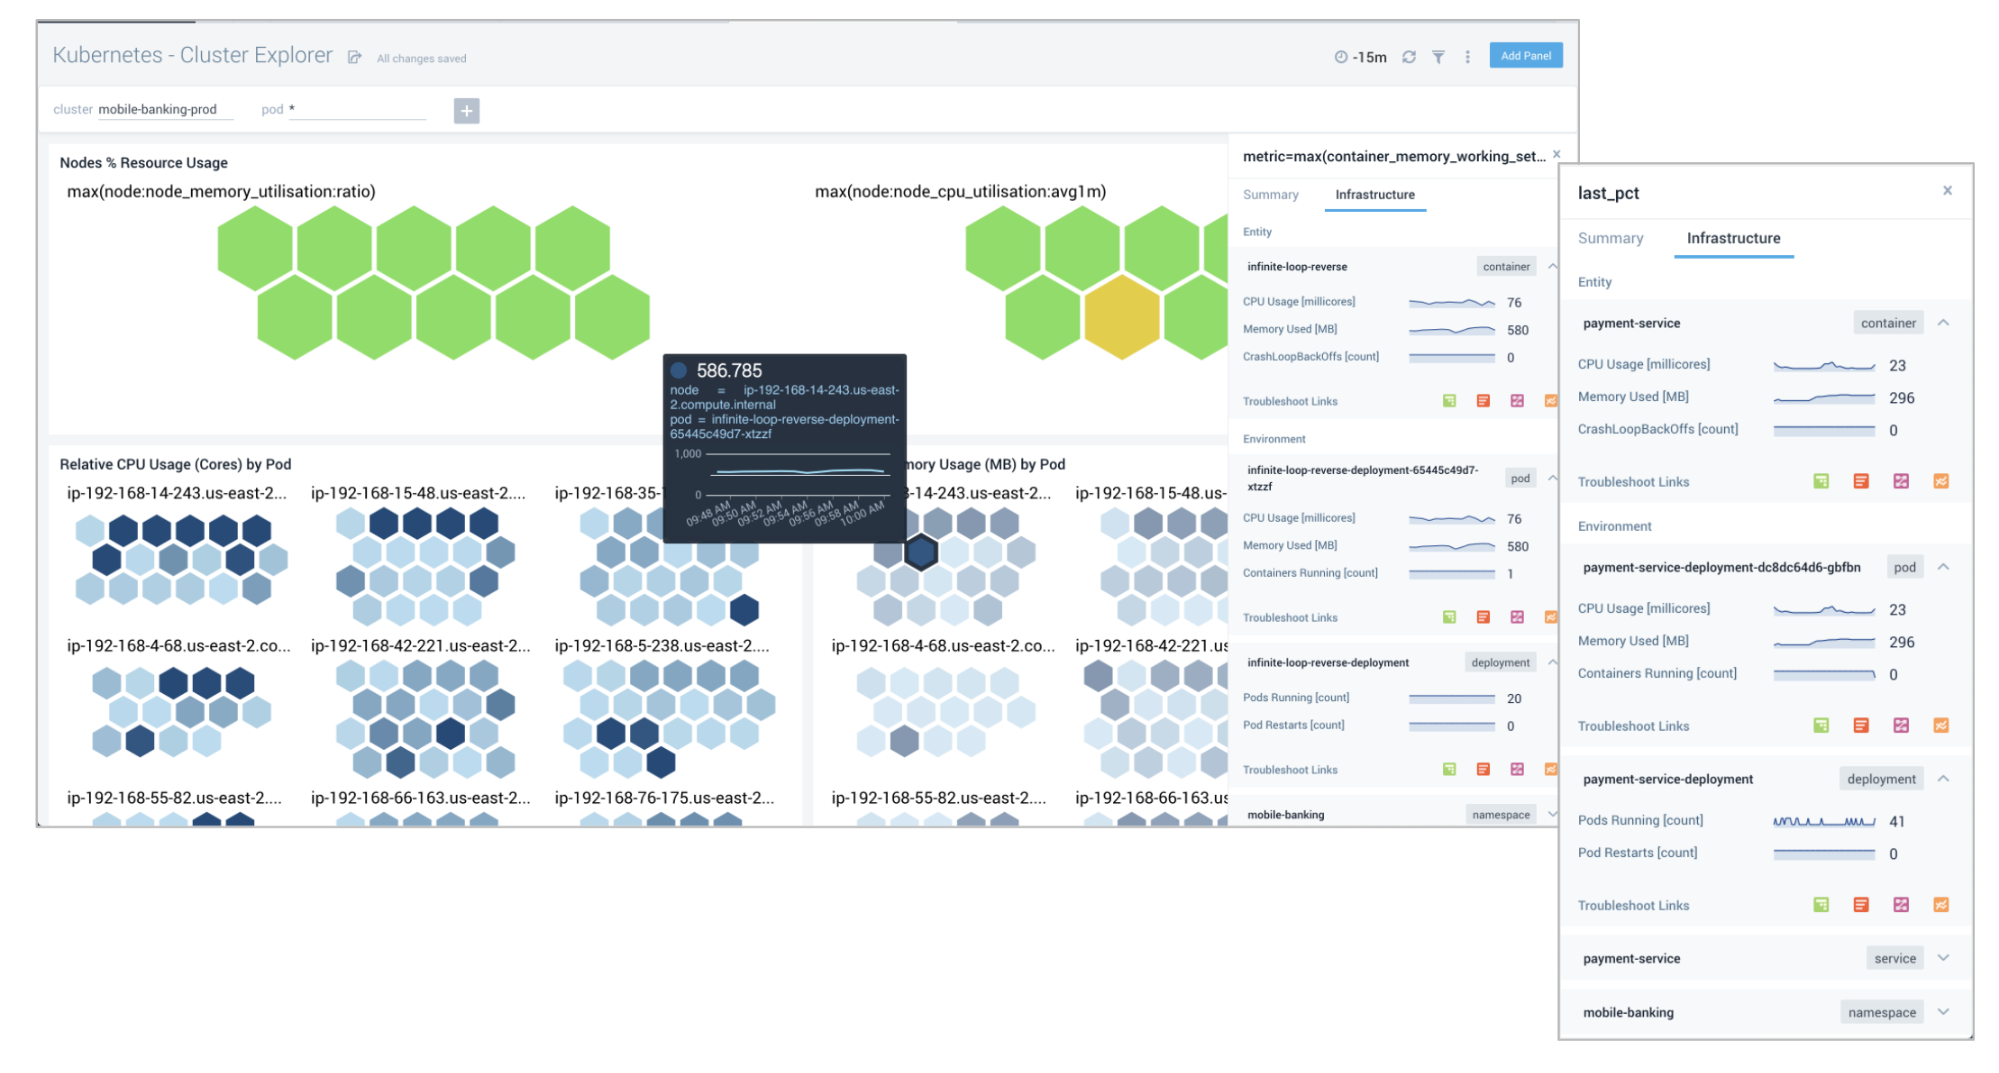
You can use Entity Inspector to connect the dots between your various data streams of logs, metrics, and traces. Using the guided experience, you can start from an alert and drill down to the root cause quickly.

Understand the journey of your transactions using tracing
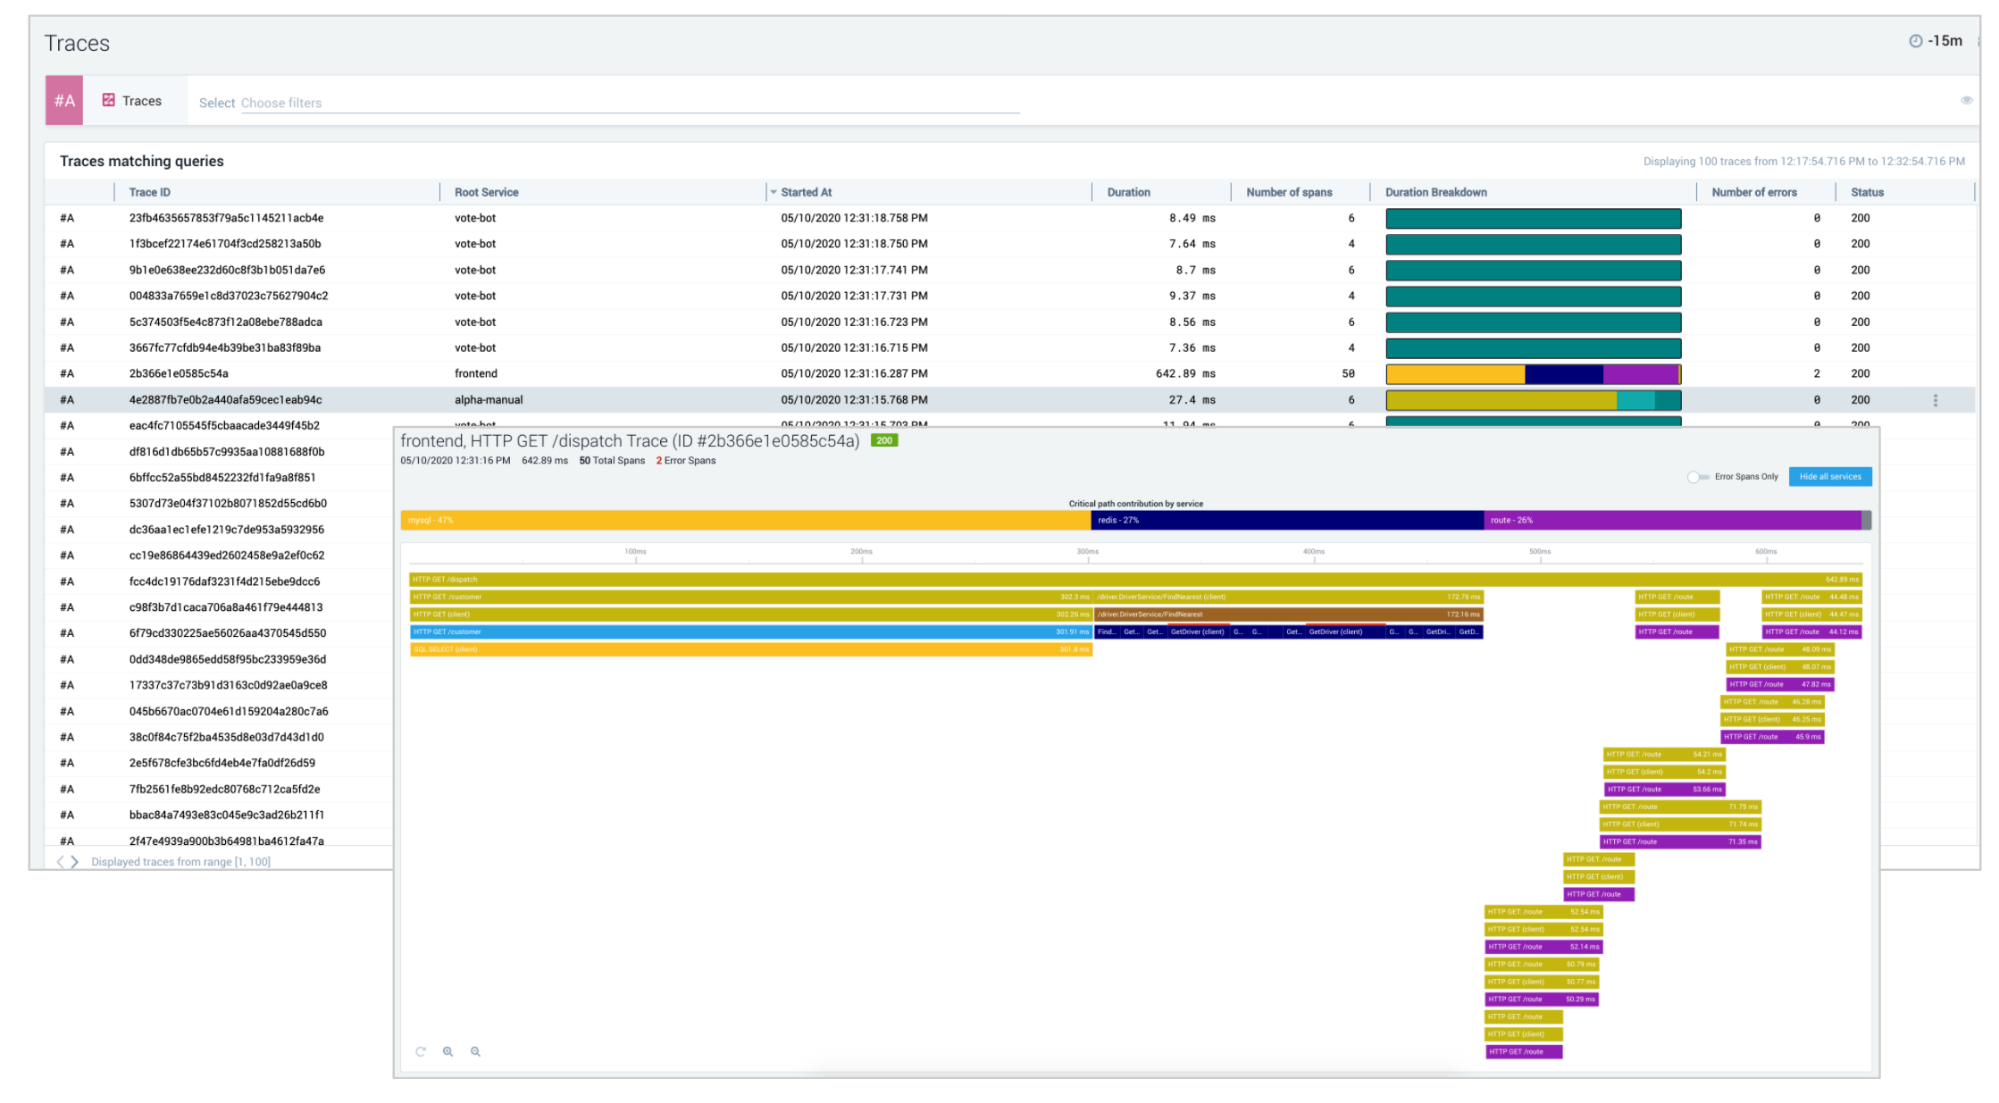
Observe apps and microservices using Transaction Tracing and detect issues with particular microservices. Using Trace analytics, you can drill down to a specific trace and learn about bottlenecks that will help you narrow down your investigation to specific service or function call that might be causing the issues. Drill down to any specific race to better understand timing relationships, the journey through the application infrastructure, full metadata information, error details, metrics-based infrastructure health info, and more. Finally, drill down to logs or infrastructure KPIs and pinpoint the problem’s root cause with all the important telemetry data at hand.

Analyze Key Metrics quickly using Metrics Explorer
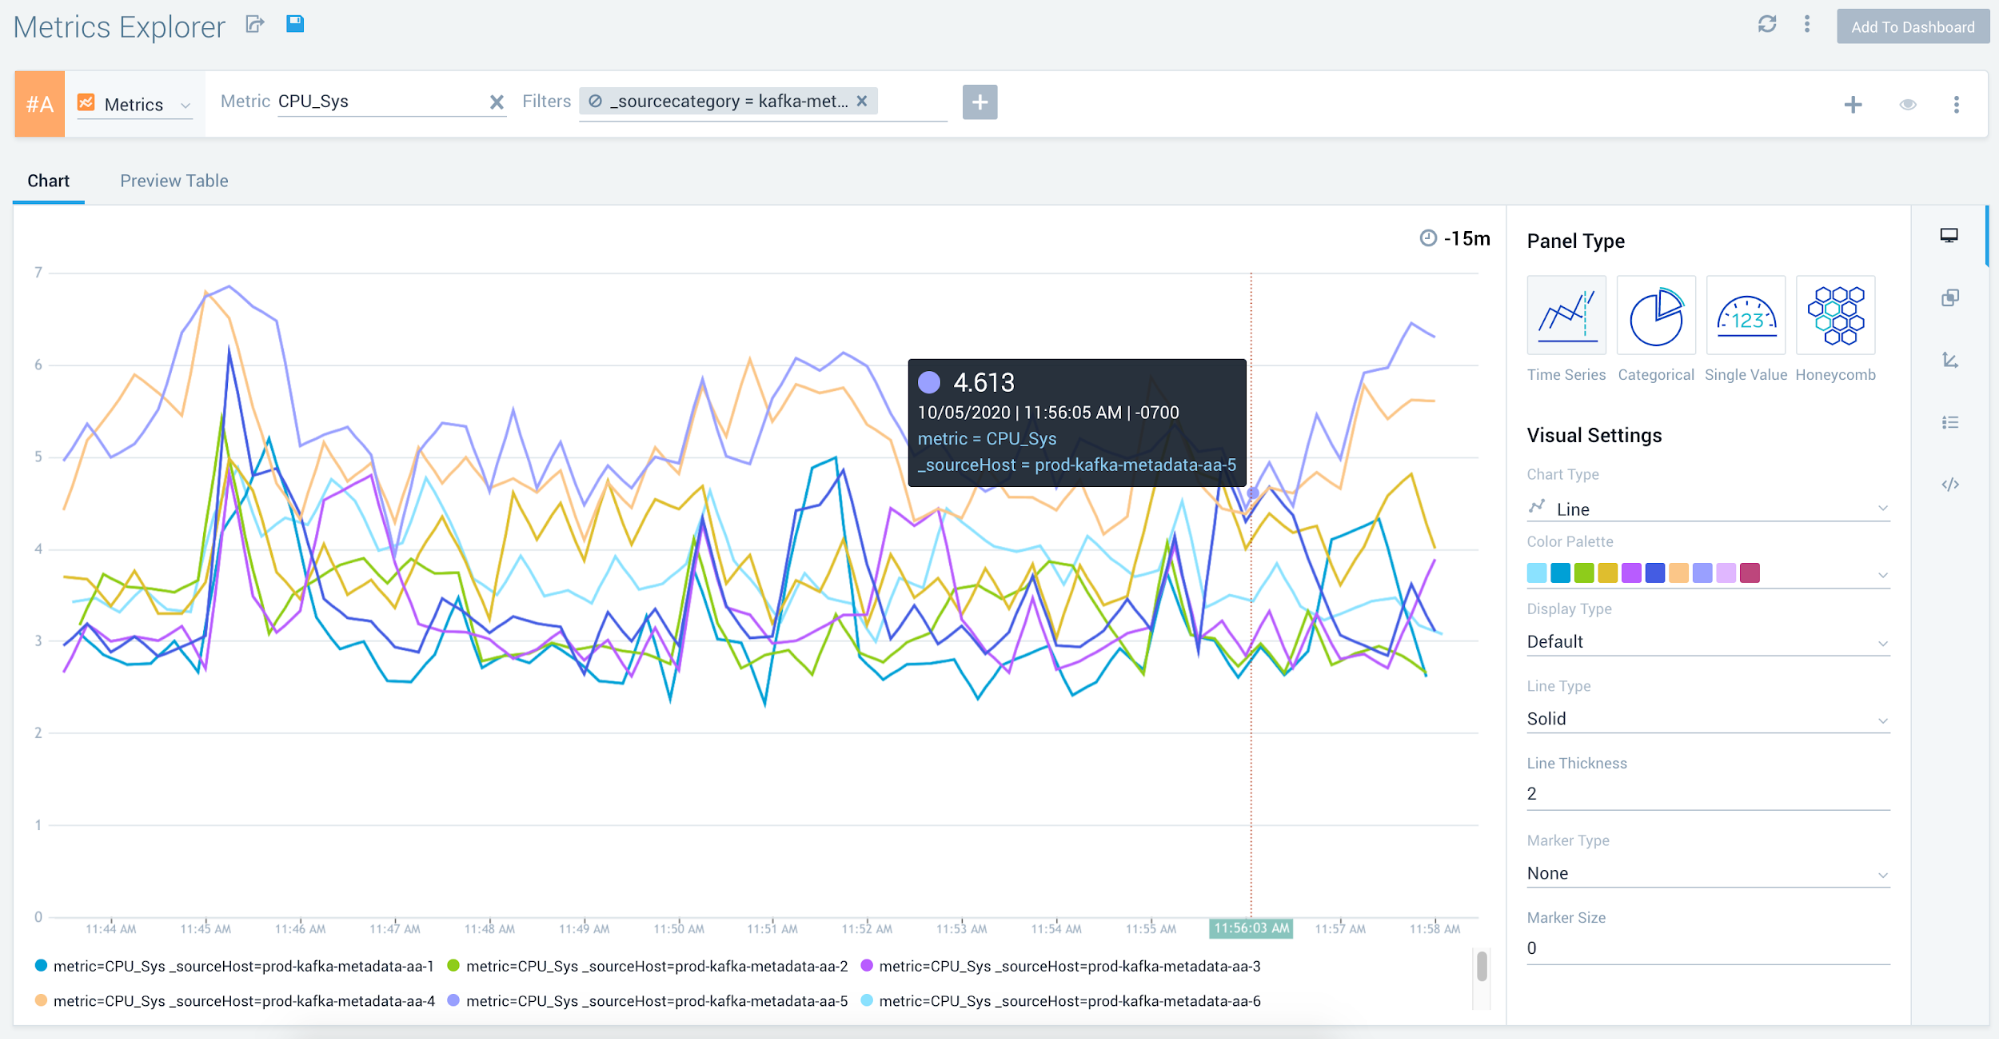
Easily find and visualize your metrics with the Re-vamped Metrics Explorer that comes with a new structured query builder, and an extended range of visualizations for ad-hoc analysis. Mimicking the Dashboard (New) workflow, you now have the same unified experience in the main metrics tab.

Benchmark KPIs with Rest of world
You can isolate or detect AWS errors using Global Intelligence for AWS CloudTrail DevOps. The service provides comparison benchmarks that on-call engineers can use to identify abnormal patterns and issues in your AWS service compared to the rest of the world, and then take action to remediate those issues.

