LogCompare
LogCompare allows you to easily compare log data from different time periods to detect major changes or anomalies. LogCompare runs a delta analysis that helps you troubleshoot and discover root causes. For example, you could determine what was different right before a failure compared to the previous day or previous week. Or, you could easily check if a new release introduced a new issue by reviewing the difference in log streams across time.
How LogCompare works
LogCompare creates a baseline (historical) query and compares it to a target (current) query. Logs from each query are clustered into patterns, called signatures, then compared and ranked based on the significance of change.
For example, a 24-hour LogCompare, which is the default time shift, allows you to pinpoint the major changes in your log messages compared to the same time on the previous day.
LogCompare reports the variance between the baseline and the target, allowing you to see the change in patterns of log messages over time. This way, you can compare log messages from today with the same time range from yesterday, and see the percentage of changes in your log message signatures, as well as new signatures that have appeared, and signatures that are now gone.
Search time
Depending on the time range you have selected for the search, the LogCompare operation may take a long time to complete, due to the multiple operations it is performing. For this reason, we suggest that you select as small a time range as practical.
If the baseline query does not finish within two hours, it will timeout.
Compare vs. LogCompare
The compare and logcompare operators are very similar in syntax and functionality, but they handle different types of data:
- compare is used for aggregated numeric data, such as analyzing results from a group by query or a query with aggregation operators like count, sum, and avg.
- logcompare is used for log signature counts based on your raw log data.
Use LogCompare
LogCompare is an operator available in log searches. You can manually add it to a query or use the built-in button provided on the Messages tab after running a non-aggregate query.
LogCompare button
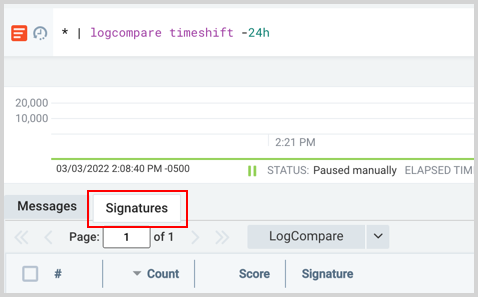
First, run a non-aggregate search, then the LogCompare button in the Messages tab can be quickly pressed to run the baseline (historical) query 24 hours in the past. However, you can easily change the baseline query time range by clicking the dropdown arrow to the right of the button.

Once clicked, a new search is opened with the logcompare operator and the specified timeshift added to your query, for example:
* | logcompare timeshift -24h
A new tab labeled Signatures is provided with the compared results.

Custom option
Click the dropdown arrow next to the LogCompare button and select Custom.
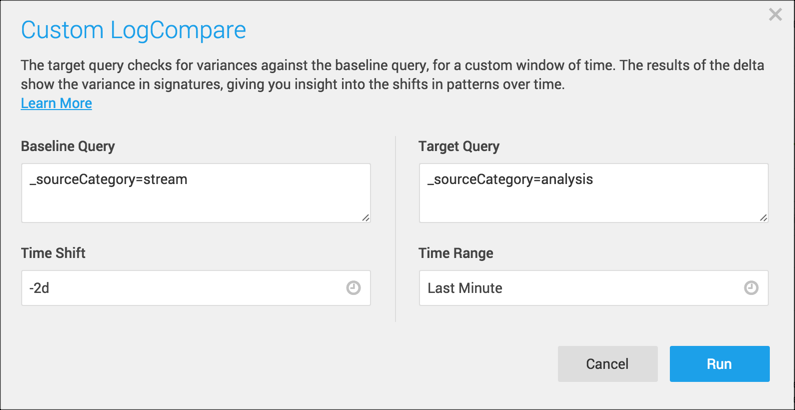
In the Custom LogCompare dialog, you can specify the target and baseline query independently, including their time ranges.

- Baseline Query is your historical query.
- Time Shift is the Time Shift of the Baseline Query, and it controls when the Baseline Query runs. If the Time Shift is -2d, that means that it will run for the exact Time Range duration (1 minute, in this query), but two days in the past.
The Time Shift can take a single value, such as -2d, or it can take a range. It must be a valid range, with a start date older or smaller than the end date.
- Target Query. Originally, the Target Query is the same as the Baseline Query. But you can edit it to compare against a new target. Here we’ve added
_sourceCategory=analysisto compare it to_sourceCategory=stream. - Time Range. The Time Range pertains to both the Target Query and the Baseline Query. You can enter a preconfigured, relative, or absolute time range, similar to the time range on the Search page. The Time Range can be specified by timeshift (start_time = now - timeshift) or (start_time + end_time).
- For the target, if the end_time is not specified, it is implicitly set to now if not specified.
- For the baseline, if the end_time is not specified, it is implicitly set as: (end_time = start_time + range_length.) The (range_length = end_time - start_time) using the target times.
See the Time Shift versus Time Range example for a table showing how these settings affect the Target and Baseline queries.
Click Run to add the logcompare operator, timeshift, and baseline to your query, for example:
_sourceCategory=analysis | logcompare timeshift -2d baseline (_sourceCategory=stream)
Results appear in the Signatures tab.
LogCompare operator
The LogCompare operator is used the same as a search operator. This section explains how to manually add LogCompare to a query, the LogCompare button simply does this for you.
Syntax
<target query> | logcompare timeshift <time> [baseline (<baseline query>)]
where
<target query>is the target (current) query.<time>is the time shift you want for the baseline query.<baseline query>is the baseline (historical) query.
A few examples:
... | logcompare timeshift -24hCompare the result of a query with the result of the same query for a time range shifted by 24 hours.... | logcompare timeshift -1d
Compare the result of a query with the result of the same query for a time range shifted by 1 day. (Same as previous example.)... | logcompare start_time 2021-01-06T12:00:00-08:00 end_time 2021-01-07T12:00:00-08:00
Compare the result of a query with the result of the same query for a time range specified by start_time and end_time. This must be a valid time range._sourceHost=cluster-1| logcompare timeshift -0s baseline(_sourceHost=cluster-2)
Compare logs on two different hosts (cluster-1 and cluster-2) for the same time period.
Output fields
LogCompare generates and applies results to certain fields, shown in the following table. These fields are referenced to populate the data in the Signatures tab.
| Field | Description |
|---|---|
| _count | The number of log messages that belong to this cluster for this query. |
| _deltaPercentage | The percent change of the signature, calculated as (targetPercentage - baselinePercentage) / baselinePercentage, where baselinePercentage is the number of logs matched to the signature divided by the total number of logs in the baseline, and similarly for targetPercentage. This is infinity for new signatures. |
| _anomalyScore | The value is calculated using a symmetric version of Kullback-Leibler divergence score. |
| _isNew | Values are Boolean.1 if the cluster is new, otherwise 0. |
Use LogCompare fields
These options are not supported in the LogCompare Custom dialog. They are only supported in the search text box.
The following are examples that use fields generated from LogCompare.
Show only signatures that are missing in the baseline query:
Use the where operator against the _isNew field to return only new clusters:
error | logcompare timeshift -1d
| where (_isNew)
Show only signatures that are missing in the target query:
And in this example, the logcompare operator shows only clusters that no longer include any messages:
error | logcompare timeshift -1d
| where _count ==0
Show signatures with a count greater than 50, is not new, and has a delta percentage greater than 90.
error | logcompare timeshift -1d
| where _deltapercentage>90 and !_isnew and _count>50
Understand LogCompare results
After running a query with LogCompare your results are displayed in the Signatures tab of the Search page. You will have a table with Count, Score, Actions, and Signature columns.

Count
Count is the number of raw logs that were clustered into the signature from the target query.

The count column shows the following:
- Delta Percentage. The delta percentage is the straight percentage change in the number of messages divided by the historical count percentage, which is the historical count change over time since the initial count results for this cluster.
- New. When the word "new" appears, the signature did not exist in the original baseline.
- Gone. When the word "gone" appears, a previous signature was not in the target query.
You will see that some clusters are new and some are gone especially if you have used a target query that is different from the baseline query. So, if a signature is shown as gone (meaning, it was in the baseline query, but is missing in the target query) the count for it will be zero.
New signatures have their column highlighted:
Gone signatures look like the following:
The following table illustrates the way Count results are calculated. For example, if the baseline query returns signatures A, B, C, and D while the target includes A, B, D, and E signatures, your results would look like the following:
| Baseline | Target | Count (delta) |
|---|---|---|
| A | A | +/-% |
| B | B | +/-% |
| C | gone | |
| D | D | +/-% |
| E | new |
So in this example, C is "gone" in the target results, and E is "new". Between the matching clusters, LogCompare reports the percentages of changes in the log message for that time shift.
Details option
Using the details option launches a new query adding a unique signature ID that allows you to view the logs grouped under that signature. The signature ID is not available to run this manually, you'll need to use the web interface.
After running a LogCompare search, from the Signatures tab, you can view logs grouped together in a signature. To see the raw log data from signatures click the blue underlined number in the Count column. A new log search is opened with the details option set against the selected signature.

Details option syntax:
... | logreduce | details <signatureId>
Score
The Score column is calculated based on the significance of the change in the occurrence of that specific pattern, compared to the baseline. So the higher the score, the more significant the change in this message.
The value is calculated using a symmetric version of Kullback-Leibler divergence score.

Actions
You can influence the algorithm by promoting, demoting, and splitting signatures. Actions take effect in subsequent LogCompare searches.
The following table explains the icons in the Actions column.
| Icon | Action |
|---|---|
| Promote a signature if the data included in the signature is relevant. Once promoted the thumbs-up icon turns blue. | |
| Demote a signature if it's not relevant. Once demoted the thumbs-down icon turns blue. | |
| Split a signature into multiple signatures to see more granular results. You'll notice that fewer wildcard asterisks will appear. Instead, specific values are included in the signatures. After splitting, the newly split signatures are highlighted. | |
| Edit the signature. After editing, the signature is highlighted. |
Signature
Logs are clustered into patterns, called signatures. The structure of logs is analyzed for patterns and assigned a unique identifier. You can search for logs that have a specific signature by clicking the number value in the Count column. See the Details option for details.
Time Shift versus Time Range example
The following table shows how the Time Range and Time Shift affect the Target and Baseline searches. The dates shown are based on a LogCompare search ran on May 10th.
| Time Range | Time Shift | Target (current) | Baseline (historical) |
|---|---|---|---|
| -1d | -30d | May 9-10 | April 9-10 |
| -30d | -1d | April 10 - May 10 | April 9 - May 9 |
LogCompare alerts
With LogCompare, you can create a Monitor or Scheduled Search to send notifications when certain conditions are met. For example, you can be alerted when new signatures are found.
To do this, use a search query such as:
error | logcompare timeshift -24h | where (_isNew)
Then to create the alert, save and schedule your search query.
To prevent gaps in your LogCompare results, configure the time range of your Scheduled Search to be a little longer than the frequency of your search. For example, if you configure the search to run every 4 hours, the time range you select when you configure the Scheduled Search should be -4h30m.
When selecting the time range of your search, keep in mind:
- With a smaller time range, more emails will be generated, unless you configure it so that an email is only sent when there are results.
- When the time range is smaller, the LogReduce results are also less accurate. For example, if you were to use a 1s time range, any new signature information would likely be useless.
- The larger the time range, the longer it takes for the email alert to be generated.
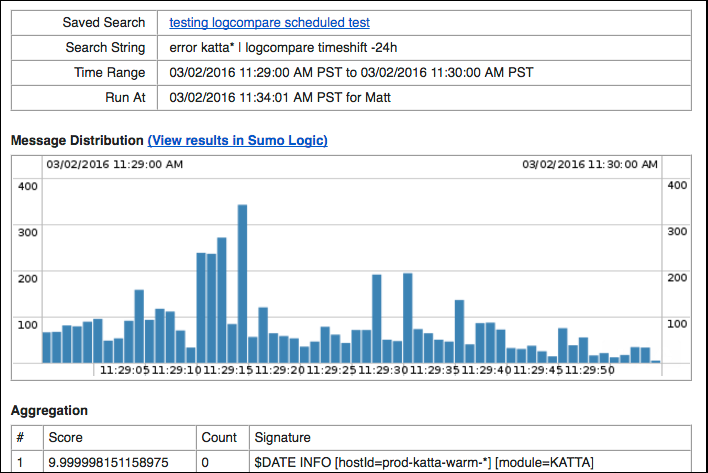
By default, LogCompare email notifications provide details on the Score, Count, and Signature, as shown in the following email example. This is not configurable.


