total Search Operator
The total operator inserts the sum of a set of fields into every row of the set. Unlike the sum operator, which produces an aggregate value, the total operator inserts the total value as a new column, enabling expressions that compare an individual value to the total.
Syntax
Create a new field (named _total by default) containing the sum of the specified field:
total <field>
Create a new field containing the sum of the specified field for groups of the set of fields specified in the by clause. A given row's total is the sum of the specified field for all rows with matching values in the by clause fields.
total <field> [as <field>] [by <field1>, <field2>, ...]
Rules
- An alias for total is optional. If no alias is given,
_totalis used by default. - Rows in which the specified field contains non-numeric values will be skipped.
- There is a limit of 100k messages that can be totaled.
Examples
Calculate the total
In this example, you can find the total data (bytes) transmitted for a time range. Running a query such as:
* | parse "bytes:*," as data
| total data as t_data
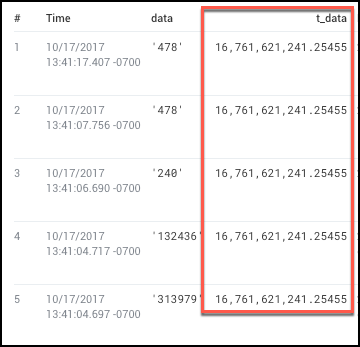
produces results similar to:

Note that the t_data value of 16,761,621,241.25455 is the sum of the data field in all rows, many of which are not visible here.
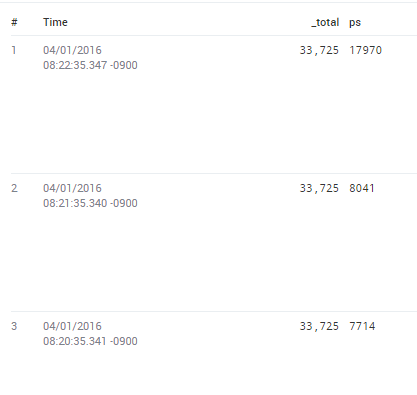
This query produces only three results, illustrating that _total is simply the sum of ps:
* | parse "BytesTotalPersec = \"*\"" as ps
| where ps > 3000
| total ps

Calculate totals by message time
To group rows by their message time and calculate different totals for each time, use the _messageTime field:
* | limit 10
| 1 as data
| total data by _messagetime
This query looks at the first 10 rows and creates a field called data in each. Rather than simply totaling data—which would be 10—this query groups the rows by their message time and provides the total for each group.
Calculate the running total of requests
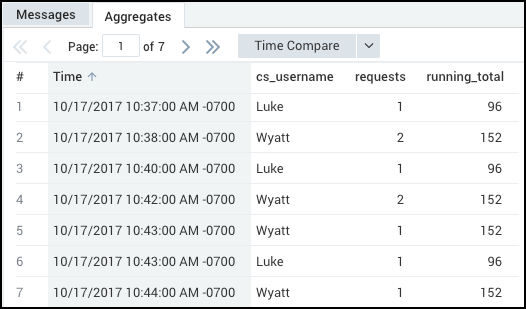
Say you'd like to find the running total of requests from certain users. Running a query similar to:
_sourceCategory=IIS (Wyatt OR Luke)
| parse "* * * * * * * * " as date, time, csmethod, cs_uri_stem, cs_uri_query, s_port, c_ip, cs_username
| timeslice by 1m
| count as requests by _timeslice,cs_username
| sort by _timeslice asc, cs_username
| total requests as running_total by cs_username
produces results similar to:


