What if I don't want to send all the tracing data to Sumo Logic?
note
Most of configuration rules described below are based on whole trace inspection (such as end-to-end trace duration) and the decision of whether to send a trace or not, is also based on all or none spans for the trace. Therefore it is important that a single collector working with that capability enabled, always sees a complete trace.
Sumo Logic’s OpenTelemetry collector has a unique capability of shaping trace data at output, according to user-defined custom rules. You can define rules in a cascading fashion, assigning different volume pool sizes to each rule, and giving them different priorities.
This ensures you will always have valuable, useful, and cost-optimized data for analysis in the backend. A few common reasons why you'd want to filter tracing data include: scaling, privacy, or cost optimization purposes for large environments.
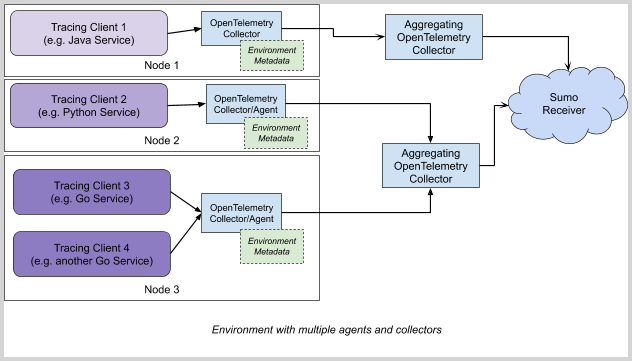
For best results, we recommend to perform filtering on a central instance of Aggregating OT Collector (see diagram below for blueprint example), as it gives possibilities to act on whole trace, rather than individual span level. Aggregating collector can receive data from local collectors/agents or directly from tracing client.

Prerequisites
Already installed and running OpenTelemetry Collector version v0.38.1-sumo or higher, installed according to following articles:
- Tracing collection for Kubernetes environments (with sumologic-kubernetes-collection v2.2.1 or higher)
- Tracing collection for other environments
Configuring filters and traffic shaping rules
In the instructions below, we are going to modify the config for the Aggregating OpenTelemetry Collector.
To enable the filter, replace your existing cascading_filter: configuration in processors: section of your OT configuration (such as values.yaml in Kubernetes) with snippet provided below (after required modifications mtaching your needs) and apply configuration by helm upgrade (in Kubernetes) and restart.
Cascading filter is combining the spans into traces and then applies a three-stage traffic shaping: pattern filtering > probabilistic sampling > tail-based filtering
You can modify to adjust each of the sections to enable and adjust each of required stages.
- Pattern Filtering
(trace_reject_filters)simply filters out traces where at least one span matches the pattern. For example, you can filter health-checks this way. All remaining traffic is passed to next defined logic. - Probabilistic sampling
(probabilistic_filtering_rate)takes the traffic after initial filtering and randomly select complete traces in that way that overall resulting traffic would not exceed defined number of spans per second. All remaining traffic is passed to next defined logic. You should always have some good sample of all traffic included here for good representation of aggregation metrics. - Tail-based filtering
(trace_accept_filters)takes traffic remaining after initial filtering/sampling and picks up to defined number spans per second as specified in the parameters from traces that were longer than defined number of seconds or have at least defined number of errors. The rest of the traffic is disregarded, if that's the last stage (as in the default configuration).
Here's an example configuration that:
Filters all traces where at least one span has
/healthcheckas operation namePasses 100 spans/sec max of other traffic in random, probabilistic manner
In addition, passess:
- up to 500 spans/sec of traces longer than 3 seconds
- up to 400 spans/sec of traces with 2 or more error spans
- up to 300 spans/sec of traces where at least one span comes from
login-service
processors:
  cascading_filter:
    # 1. Pattern filtering
    # Adjust the filters as needed
    trace_reject_filters:
       - name: filter_out_pattern
         name_pattern: "/healtcheck" #\<- set to filter out spans with name matching this pattern
    # 2. Probabilistic sampling
    # Adjust the limit as needed
    probabilistic_filtering_rate: 100 #\<- output limit for this rule in spans/sec
    # 3. Tail-based filtering
    # Adjust as needed
    trace_accept_filters:
      # Adjust the duration threshold and limit as needed
      - name: tail-based-duration
        properties:
          min_duration: 3s      #\<- traces longer then this will qualify to be sent
        spans_per_second: 500   #\<- output limit for this rule
      # Adjust number of errors and limit as needed
      - name: tail-based-errors
        properties:
          min_number_of_errors: 2 #\<- traces with at least this number of errors will qualify to be sent
        spans_per_second: 400     #\<- output limit for this rule
      # Adjust number of errors and limit as needed
      - name: tail-based-attributes
        attributes:               #\<- traces with at least one span or resource
          - key: service.name     #    matching this attribute will qualify to be sent
            values:
              - login-service     #\<- pass all traces where at least one span belongs to "login-service" service
        spans_per_second: 300     #\<- output limit for this rule
If you are using non-standard configuration template, please also ensure cascading_filter and batch are present in the list of processors:
# Include the processor in the tracing pipeline as needed
service:
  pipelines:
    traces:
      receivers: ...
      processors: [..., cascading_filter, batch]
      exporters: ...
By default, cascading filter waits for 30 seconds before making the decision and can hold up to 100000 traces in memory (if available). This parameters can be fine-tuned using decision_wait and num_traces configuration options. More details on the usage is available at cascadingfilterprocessor page. For examples, refer to:
- custom-values-cascading-filter.yaml (for Kubernetes collection)
- gateway-configuration-template-with-cascading-filter.yaml (for non-Kubernetes collection)
Troubleshooting
When enabled, cascading filter emits logs on startup which indicate the rules that were applied. For example:
2021-11-18T19:50:23.451+0100    info    cascadingfilterprocessor@v0.38.0/processor.go:132    Adding trace reject rule    {"kind": "processor", "name": "cascading_filter", "name": "healthcheck-rule"}
2021-11-18T19:50:23.451+0100    info    cascadingfilterprocessor@v0.38.0/processor.go:169    Adding trace accept rule    {"kind": "processor", "name": "cascading_filter", "name": "test1", "spans_per_second": 50}
2021-11-18T19:50:23.451+0100    info    cascadingfilterprocessor@v0.38.0/processor.go:169    Adding trace accept rule    {"kind": "processor", "name": "cascading_filter", "name": "test2", "spans_per_second": 50}
2021-11-18T19:50:23.451+0100    info    cascadingfilterprocessor@v0.38.0/processor.go:185    Setting total spans per second limit    {"kind": "processor", "name": "cascading_filter", "spans_per_second": 100}
2021-11-18T19:50:23.451+0100    info    cascadingfilterprocessor@v0.38.0/processor.go:202    Setting probabilistic filtering rate    {"kind": "processor", "name": "cascading_filter", "probabilistic_filtering_rate": 8}
Note that no traces will be emitted by cascading filter until the decision_wait time passes.
When cascading filter is processing data, it emits a number of metrics that describe actions made by it. Such as otelcol_processor_cascading_filter_count_final_decision or otelcol_processor_cascading_filter_count_policy_decision. They are available at OpenTelemetry Collector metrics endpoint (http:/\<OPENTELEMETRY_COLLECTOR_ADDRES\>:8888/metrics) or for Kubernetes, via collected metrics (Helm chart flag otelcol.metrics.enabled must be set to true).