Set up traces collection for Kubernetes environments
After installing or upgrading your Kubernetes Sumo Collector, you will be able to send your traces directly to its endpoint using Jaeger, Zipkin, and OpenTelemetry formats.
Traces will be enhanced with Kubernetes metadata, similarly to the logs and metrics collected by the collector. See below for installation instructions.
Prerequisites:
- Kubernetes 1.18+
- Helm 3.4+
Installation process for Sumo Logic Tracing on Kubernetes
Installation is almost the same as for the official SumoLogic Kubernetes Collection, except a tracing flag needs to be enabled. The process follows using a Helm chart to set all required components. It will automatically download and configure OpenTelemetry Collector, which will collect, process, and export telemetry data to Sumo Logic.
In the following installation steps, we use the release name collection and the namespace name sumologic. You can use any names you want, however, you'll need to adjust your installation commands to use your names since these names impact the OpenTelemetry Collector endpoint name.
There are two deployment scenarios:
- Scenario 1: A single OpenTelemetry Collector gateway
- Scenario 2: Running OpenTelemetry Collector Agents on each node and OpenTelemetry Collector gateway
Scenario 1: Single OpenTelemetry Collector gateway
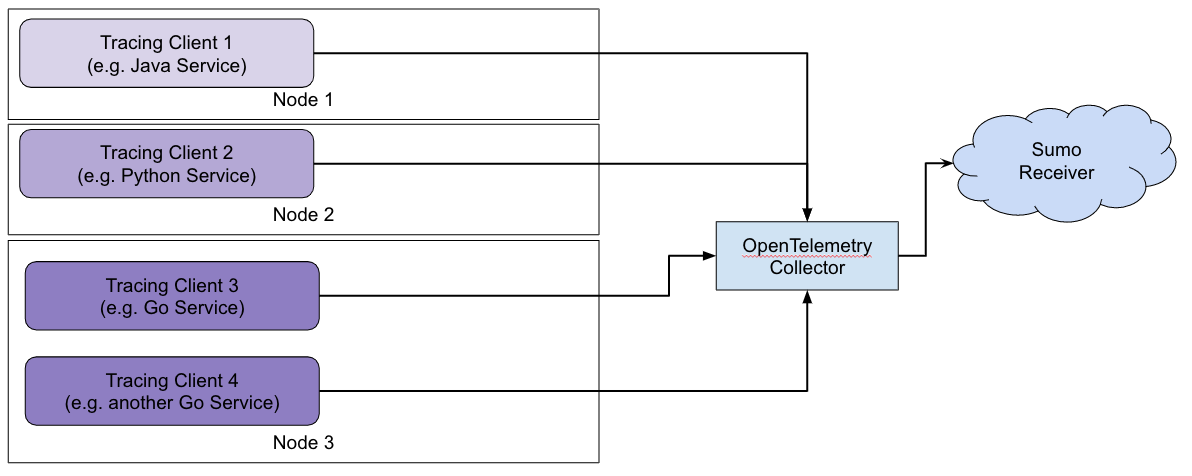
Tracing data from your services is sent directly to a single OpenTelemetry Collector service running as a Deployment and acting as a gateway:
Use this when either of the following are met:
- planning to test the process
- have an environment with a relatively low number of pods (less than 100) or just a single host
- aim at simplicity

Setting up the most recent SumoLogic Kubernetes Collection
Tracing requires Sumo Logic Kubernetes collection 2.0. Refer to install/upgrade instructions for the current version. To enable tracing, sumologic.traces.enabled=true flag must be included.
Using command line
helm upgrade --install collection sumologic/sumologic \
  --namespace sumologic \
  --create-namespace \
  --set sumologic.accessId=<SUMO_ACCESS_ID> \
  --set sumologic.accessKey=<SUMO_ACCESS_KEY> \
  --set sumologic.clusterName="<MY_CLUSTER_NAME>" \
  --set sumologic.traces.enabled=true
Using configuration file
We recommend creating a new values.yaml file for each Kubernetes cluster you wish to install collection on and setting only the properties you wish to override. For example,
sumologic:
  accessId: <SUMO_ACCESS_ID>
  accessKey: <SUMO_ACCESS_KEY>
  clusterName: <MY_CLUSTER_NAME>
  traces:
    enabled: true
Once you have the config customized you can use the following commands to install or upgrade:
helm upgrade --install collection sumologic/sumologic \
  --namespace sumologic \
  --create-namespace \
  -f values.yaml
You can also refer to example templates with configuration values.
Enabling tracing for existing installations
Tracing is disabled by default. If you previously installed sumologic-kubernetes-collection 2.0 without enabling tracing, it can be enabled with sumologic.traces.enabled=true.
Using command line
helm upgrade collection sumologic/sumologic \
  --namespace sumologic \
  ... \
  --set sumologic.traces.enabled=true
Using configuration file
The values.yaml file needs to have the relevant section enabled, such as:
sumologic:
  ...
  traces:
    enabled: true
After updating the configuration file, the changes can be applied with the following:
helm upgrade --install collection sumologic/sumologic \
  --namespace sumologic \
  -f values.yaml
Pointing tracing clients (instrumentation exporters) to the collector
The collector supports receiving spans in Zipkin, OTLP, and Jaeger formats. The following are the endpoints for each of them:
- Jaeger GRPC:
<CHART_NAME>-sumologic-otelcol<NAMESPACE>:14250 - Jaeger Thrift
HTTP:
<CHART_NAME>-sumologic-otelcol<NAMESPACE>:14268 - Jaeger Thrift Compact
(UDP):
<CHART_NAME>-sumologic-otelcol<NAMESPACE>:6831 - Zipkin:
<CHART_NAME>-sumologic-otelcol<NAMESPACE>:9411/api/v2/spans - OTLP gRPC:
<CHART_NAME>-sumologic-otelcol<NAMESPACE>:4317 - OTLP HTTP:
<CHART_NAME>-sumologic-otelcol<NAMESPACE>:55681
For example, when the default chart name (collection) and namespace
(sumologic) is used, the endpoints are following:
- Jaeger GRPC:
collection-sumologic-otelcol.sumologic:14250 - Jaeger Thrift HTTP:
collection-sumologic-otelcol.sumologic:14268 - Jaeger Thrift Compact (UDP):
collection-sumologic-otelcol.sumologic:6831 - Zipkin:
collection-sumologic-otelcol.sumologic:9411/api/v2/spans - OTLP gRPC:
collection-sumologic-otelcol.sumologic:4317 - OTLP HTTP:
collection-sumologic-otelcol.sumologic:55681
Scenario 2: Run local node OpenTelemetry collector Agents and aggregating OpenTelemetry Collector gateway
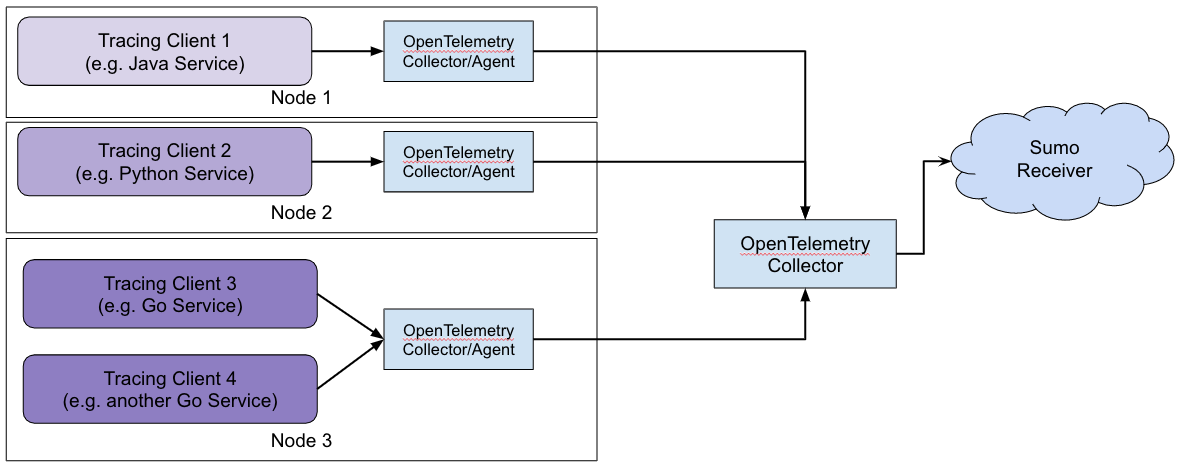
Tracing data from your services is sent through multiple, local OpenTelemetry Collectors/Agents, deployed as a DaemonSet on each Node which buffer and send data to a OpenTelemetry Collector gateway running as a Deployment.
When either of the following happens, using OpenTelemetry Agent and Collector is recommended:
- there is a significant number of pods running (more than 100) or multiple hosts
- you are already using agent/collector infrastructure (like Jaeger Agent) and planning to upgrade it to OpenTelemetry
- UDP protocol is used for exporting spans from client
- significant traffic volume is expected

In the case of having an environment with a significant volume of spans or if you are using a client that sends data over UDP, such as Jaeger, we recommend deployment with OpenTelemetry Collector/Agent enabled. It is deployed as a DaemonSet and in effect, there is an instance of the agent running on each node.
Replacing existing agents
When Jaeger or any other existing agent is being used, it typically is used to receive traffic data via UDP from tracing clients. We recommend replacing these agents with the Sumo Logic version of OpenTelemetry collector in agent mode to accurately assign source IP address, which is used for identifying the source pod when doing metadata tagging. This will ensure that Kubernetes metadata tagging works well for tracing in addition to metrics and logs data.
Setting up the most recent SumoLogic Kubernetes Collection
Tracing requires Sumo Logic Kubernetes collection 2.0 Refer to install/upgrade instructions for
the current version. To enable tracing, sumologic.traces.enabled=true flag must be included. Enablement of Agent mode is configured with otelagent.enabled=true.
Using command line
helm upgrade --install collection sumologic/sumologic \
  --namespace sumologic \
  --create-namespace \
  --set sumologic.accessId=<SUMO_ACCESS_ID> \
  --set sumologic.accessKey=<SUMO_ACCESS_KEY> \
  --set sumologic.clusterName="<MY_CLUSTER_NAME>" \
  --set sumologic.traces.enabled=true \
  --set otelagent.enabled=true
Using configuration file
We recommend you create a new values.yaml file for each Kubernetes cluster you wish to install collection on and setting only the properties you wish to override. For example,
sumologic:
  accessId: <SUMO_ACCESS_ID>
  accessKey: <SUMO_ACCESS_KEY>
  clusterName: <MY_CLUSTER_NAME>
  traces:
    enabled: true
otelagent:
  enabled: true
Once you have the config customized you can use the following commands to install or upgrade:
helm upgrade --install collection sumologic/sumologic \
  --namespace sumologic \
  --create-namespace \
  -f values.yaml
You can also refer to example templates with configuration values.
Enabling tracing for existing installations
Tracing is disabled by default. If you previously installed sumologic-kubernetes-collection 2.0 without enabling tracing, it can be enabled with sumologic.traces.enabled=true. Enablement of Agent mode is configured with otelagent.enabled=true.
Using command line
helm upgrade collection sumologic/sumologic \
  --namespace sumologic \
  ... \
  --set sumologic.traces.enabled=true \
  --set otelagent.enabled=true
Using configuration file
The values.yaml file needs to have the relevant section enabled, such as:
sumologic:
  ...
  traces:
    enabled: true
otelagent:
  enabled: true
After updating the configuration file, the changes can be applied with the following:
helm upgrade --install collection sumologic/sumologic \
  --namespace sumologic \
  -f values.yaml
Pointing tracing clients (instrumentation exporters) to the agent collectors
The following are the endpoints for each of the supported formats:
- Jaeger GRPC:
<CHART_NAME>-sumologic-otelagent<NAMESPACE>:14250 - Jaeger Thrift HTTP:
<CHART_NAME>-sumologic-otelagent<NAMESPACE>:14268 - Jaeger Thrift Compact (UDP):
<CHART_NAME>-sumologic-otelagent<NAMESPACE>:6831 - Zipkin:
<CHART_NAME>-sumologic-otelagent<NAMESPACE>:9411/api/v2/spans - OTLP gRPC:
<CHART_NAME>-sumologic-otelagent<NAMESPACE>:4317 - OTLP HTTP:
<CHART_NAME>-sumologic-otelagent<NAMESPACE>:55681
For example, when the default chart name (collection) and namespace (sumologic) is used, the endpoints are following:
- Jaeger GRPC:
collection-sumologic-otelagent.sumologic:14250 - Jaeger Thrift HTTP:
collection-sumologic-otelagent.sumologic:14268 - Jaeger Thrift Compact (UDP):
collection-sumologic-otelagent.sumologic:6831 - Zipkin:
collection-sumologic-otelagent.sumologic:9411/api/v2/spans - OTLP gRPC:
collection-sumologic-otelagent.sumologic:4317 - OTLP HTTP:
collection-sumologic-otelagent.sumologic:55681
Troubleshooting
Desired Kubernetes installation state
After enabling and installing tracing one should have additional Kubernetes resources:
- Deployment:
collection-sumologic-otelcol - Pod:
collection-sumologic-otelcol-<hash>-<hash> - Replica Set:
collection-sumologic-otelcol-<hash> - Service:
collection-sumologic-otelcol - Config Map:
collection-sumologic-otelcol
How to verify traces are installed and working?
- There are no Kubernetes errors in the namespace sumologic.
- There is a running pod
<CHART_NAME>-sumologic-otelcol-<hash>. - Kubernetes metadata tags (pod, replicaset, etc.) should be applied to all spans. If there are no metadata tags and intermediate agent or collector is being used, make sure it has passthrough mode set (see above). If metadata tags are describing pod named “otel-collector-...” - then most likely there’s an intermediate pod acting as an agent or collector with no passthrough mode set.
- The OpenTelemetry Collector gateway can export metrics, which include information such as the number of spans exported. To enable, apply the
otelcol.metrics.enabled=trueflag when installing or upgrading the Collector, for example:After enabling, several metrics starting withhelm upgrade collection sumologic/sumologic \
--namespace sumologic \
... \
--set otelcol.metrics.enabled=trueotelcol_will become available, such asotelcol_exporter_sent_spansandotelcol_receiver_accepted_spans. - OpenTelemetry Collector can have logging exporter enabled. This will put on the output contents of spans (with some sampling above a certain rate). To enable, apply the following flags when installing/upgrading the collector (appending logging to the list of exporters):
helm upgrade collection sumologic/sumologic \
  --namespace sumologic \
  ... \
  --set otelcol.config.exporters.logging.logLevel=debug \
  --set otelcol.config.service.pipelines.traces.exporters="{zipkin,logging}"
Having this enabled, kubectl logs -n sumologic collection-sumologic-otelcol\<ENTER ACTUAL POD I\> might
yield the following output:
2020-03-09T10:47:28.861Z TraceData with 1 spans
Node service name: carpogonial
Node attributes:
2020-03-09T10:47:28.861Z Span #0
  Trace ID    : 00000000000000004abaf4a8688cee33
  ID          : 1aad0bc2b44e8219
  Parent ID   :
  Name        : Carpoidea
  Kind        : CLIENT
  Start time  : seconds:1583750845 nanos:799855000
  End time    : seconds:1583751016 nanos:332705000
  Span attributes:
        -> zipkin.remoteEndpoint.ipv6: 5ab8:31e6:a7b:6205:13cb:a3fe:c180:ca26
        -> ip: 10.1.1.1
        -> zipkin.remoteEndpoint.port: 49088
        -> zipkin.remoteEndpoint.serviceName: carpogonial
        -> ipv4: 36.110.13.238
        -> ipv6: 5ab8:31e6:a7b:6205:13cb:a3fe:c180:ca26
        -> port: 49088
        -> zipkin.remoteEndpoint.ipv4: 36.110.13.238