OTLP/HTTP Source
An OTLP/HTTP Source is an endpoint for receiving OTLP formatted Logs, Metrics, and Traces. This is an alternative option to installing an OpenTelemetry Collector for sending OTLP data to Sumo Logic.
Create an OTLP/HTTP Source
To configure an OTLP/HTTP Source:
In the Sumo Logic web interface, select Manage Data > Collection > Collection.
On the Collection page, click Add Source next to a Hosted Collector.
Select OTLP/HTTP.

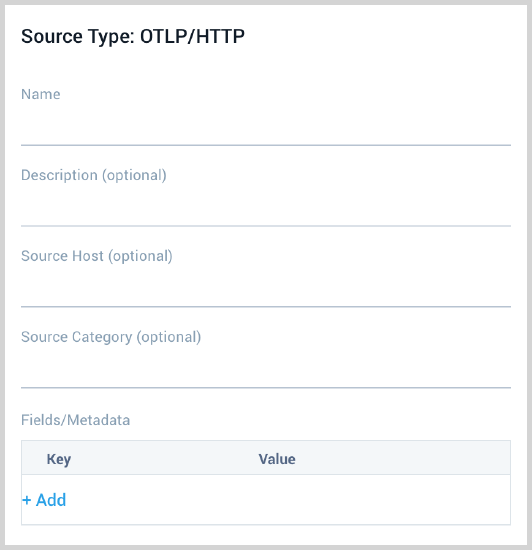
Enter a Name for the Source. A description is optional.

(Optional) For Source Host and Source Category, enter any string to tag the output collected from the source. These are built-in metadata fields that allow you to organize your data.
Fields. Click the +Add Field link to define the fields you want to associate, each field needs a name (key) and value.
A green circle with a check mark is shown when the field exists in the Fields table schema.
An orange triangle with an exclamation point is shown when the field doesn't exist in the Fields table schema. In this case, an option to automatically add the nonexistent fields to the Fields table schema is provided. If a field is sent to Sumo that does not exist in the Fields schema it is ignored, known as dropped.
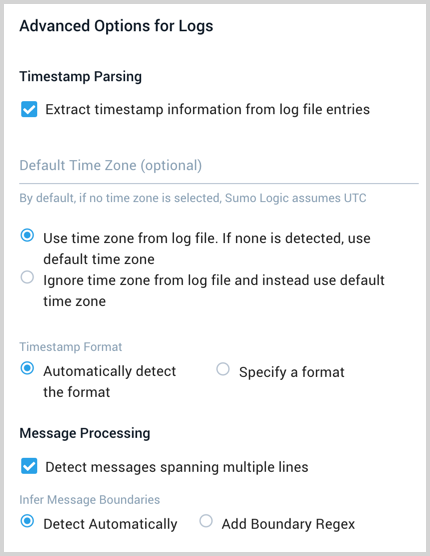
Set any of the following under Advanced Options for Logs:

Timestamp Parsing. This option is selected by default. If it's deselected, no timestamp information is parsed at all.
- Time Zone. There are two options for Time Zone. You can use the time zone present in your log files, and then choose an option in case time zone information is missing from a log message. Or, you can have Sumo Logic completely disregard any time zone information present in logs by forcing a time zone. It's very important to have the proper time zone set, no matter which option you choose. If the time zone of logs can't be determined, Sumo Logic assigns logs UTC; if the rest of your logs are from another time zone your search results will be affected.
- Timestamp Format. By default, Sumo Logic will automatically detect the timestamp format of your logs. However, you can manually specify a timestamp format for a Source. See [Timestamps, Time Zones, Time Ranges, and Date Formats](/feat/swc/ja/docs/send-data/sources/reference-information-sources/time-reference for more information.
Message Processing. See [Collecting Multiline Logs](/feat/swc/ja/docs/send-data/sources/reference-information-sources/collect-multiline-logs for details on multiline processing and its options. This is enabled by default. Use this option if you're working with multiline messages (for example, log4J or exception stack traces). Deselect this option if you want to avoid unnecessary processing when collecting single-message-per-line files (for example, Linux system.log). Choose one of the following:
- Detect Automatically. Enable when you want Sumo Logic to automatically attempt to determine which lines belong to the same message. If you deselect the Infer Boundaries option, you will need to enter a regular expression in the Boundary Regex field to use for detecting the entire first line of multiline messages.
- Boundary Regex. You can specify the boundary between messages using a regular expression. Enter a regular expression that matches the entire first line of every multiline message in your log files.
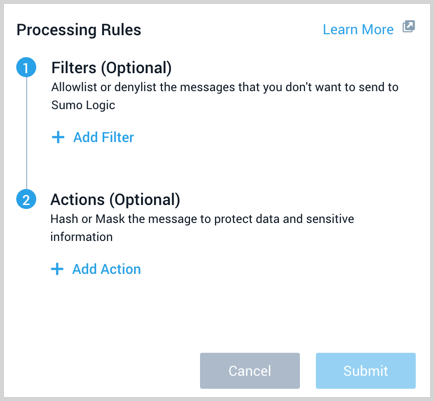
[Create any Processing Rules](/feat/swc/ja/docs/manage/collection/processing-rules/create-a-processing-rule you'd like for the OTLP/HTTP Source.

When you are finished configuring the Source click Save.
View the endpoint URL
If you need to access the Source's URL again, click Show URL.
Using the OTLP/HTTP Source
Data differentiation
When you set up an OTLP/HTTP Source, a unique URL is assigned to the Source. The exporter automatically appends the specific signal type when sending the data, as described by OpenTelemetry Protocol Exporter specification. The following table shows the URL format based on data types.
| Data Type | URL Format |
|---|---|
| Logs | <source_url>/v1/logs |
| Metrics | <source_url>/v1/metrics |
| Traces | <source_url>/v1/traces |
OTLP/HTTP Exporter
To use the URL, include the url in otlphttp exporter of OpenTelemetry Collector and refer it in the pipelines, as needed. The exporter will automatically attach the signal type suffix:
exporters:
  otlphttp:
    endpoint: <source_url>

...

service:
  pipelines:
    logs:
      ...
      exporters: [otlphttp]
    metrics:
      ...
      exporters: [otlphttp]
    traces:
      ...
      exporters: [otlphttp]
Alternative
It is also possible to optionally configure per-signal URL, e.g.
exporters:
  otlphttp:
    traces_endpoint: <source_url>/v1/traces
    metrics_endpoint: <source_url>/v1/metrics
    logs_endpoint: <source_url>/v1/logs

...

service:
  pipelines:
    logs:
      ...
      exporters: [otlphttp]
    metrics:
      ...
      exporters: [otlphttp]
    traces:
      ...
      exporters: [otlphttp]