Windows Sensor Troubleshooting
note
The CSE Windows Sensor has reached end of life and is no longer supported. Please migrate to a Sumo Logic Installed Collector. For more information see the end of life notice.
This topic describes basic steps for troubleshooting problems with the Windows Sensor.
Verify Windows Service configuration
Open the Services (service.msc) tool from the Microsoft Windows Control Panel.
Select Sumo Logic CSE Windows Service from the list of services. Right-click and choose Properties.
Choose the Log On tab. Verify that: This account is selected. This account has the correct username.
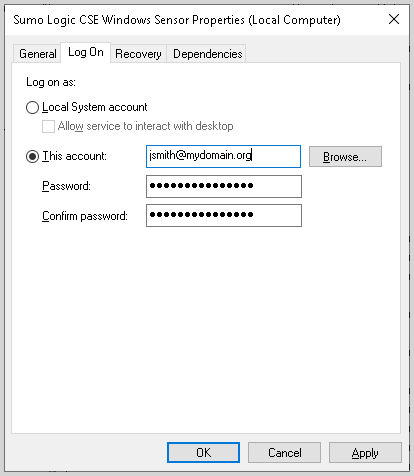
Still on the Log On tab, re-enter the current password for the account in both password fields, and click OK. This will result in the account being granted the “Logon as a service” permission, if it does not already have it.
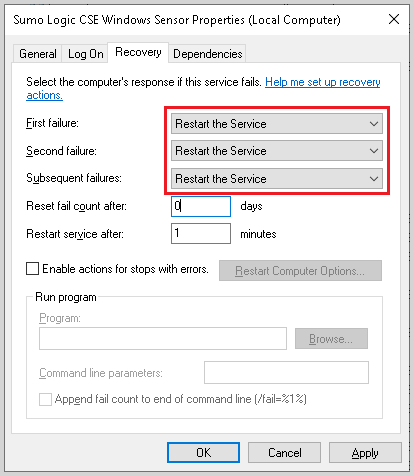
Open the Recovery tab. Verify that each failure mode is set to Restart the Service, as shown below.
Verify that the service account has the necessary permissions
- Choose the Log On tab.
- Make sure that the account is a dedicated account that runs only the Windows Sensor.
- Verify that the account has “Logon as a service” permission. If the account doesn't have the permission, follow the instructions in Give service account “Log on as a Service” permission.
- Verify that the service account a member of the server’s local Performance Monitor Users group. Alternatively, you can grant the service account local administrator rights, in which case, it does not have to be a member of the Performance Monitor Users group.
- If the Windows Sensor’s Domain Controller Monitor is being used, as is the default, verify that the service account a member of the Domain Event Log Readers group.
- If the Windows Sensor Active Directory Monitor is being used, as is the default, verify that the service account a member of the Domain Users group.
- If the Windows Sensor’s Localhost Monitor is enabled verify that the service account is a member of the local machine’s Event Log Readers group.
- If the Windows Sensor’s Windows Event Collector (WEC) Monitor is enabled, verify that the service account is a member of the appropriate group to be granted access to the Forwarded Events log on the WEC Server. (This is usually the Event Log Readers group).
Give service account “Log on as a Service” permission
When you install the Windows service, the service account should be granted the "Log on as service" permission. In rare cases, this doesn't happen.
To manually grant the "Log on as service" permission:
- Run Start > Control Panel > Administrative Tools > Local Security Policy.
- Select Local Policies > User Rights Assignment > Log on as a service.
- Click Add user or Group and then add the service account to the list of accounts that have the "Log on as a service" permission.
Verify sensor is sending data
In its default configuration, the Windows Sensor sends event log and directory inventory to the Sumo Logic platform. In some instances, the sensor may be configured to send data to the legacy CSE server, rather than to the Sumo Logic platform. In either case, you should verify that the sensor is sending data to the configured destination. If it is not, that could indicate a problem with the sensor configuration.
Check that Sumo Logic received data from sensor
Perform this step if the Windows Sensor is running in its default mode, which is to send event logs and directory inventory to the Sumo Logic platform.
Log in to Sumo Logic.
In the Sumo Logic UI, go to Manage Data > Collection.
In the list of Collectors and their Sources, locate the Sumo Logic HTTP Source running on Hosted Collector—this is the Source that was set up when the Windows Sensor was installed. (The procedure is described in Set up Sumo Logic Collector and Source section of the Windows Sensor Installation topic.)
Mouse over the name of the HTTP Source and click on the left blue icon to “Open in Log Search.” This will open a search in another tab and display data recently received from the Windows Sensor.
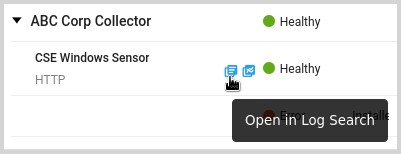
If the sensor is properly configured, you should see messages in the search results.
If you don’t see Records in Sumo Logic
If the search you performed above did not return messages, compare the URL of the HTTP Source in Sumo Logic, to the URL configured in the Windows Sensor configuration file.
- In the Sumo Logic UI, go to Manage Data > Collection.
- In the list of collectors and sources, navigate to the HTTP Source that was created to receive data from the sensor.
- Click Show URL and note the URL.
- Open the Windows Sensor configuration file,
C:\ProgramData\Sumo Logic\CSE Windows Sensor\settings.conf. - Verify that the value of the
addresssetting is the same as the URL shown for the Source in Sumo Logic.
Check that data is coming into the CSE Server
In some instances, the sensor may be configured to send data to the legacy CSE server rather than to Sumo Logic. In this case, verify that data is being ingested to the the CSE server.
Navigate to the Windows Sensor in the CSE UI. Click on the gear in the upper right corner, and choose Sensors from the configuration menu.
Look for the sensor in the list that matches the name of the computer where the sensor service is installed. When the sensor service is working properly and sending records, the Records Per Second (RPS) value should be greater than zero. Slide the mouse pointer along the RPS graph to see values at a given time.
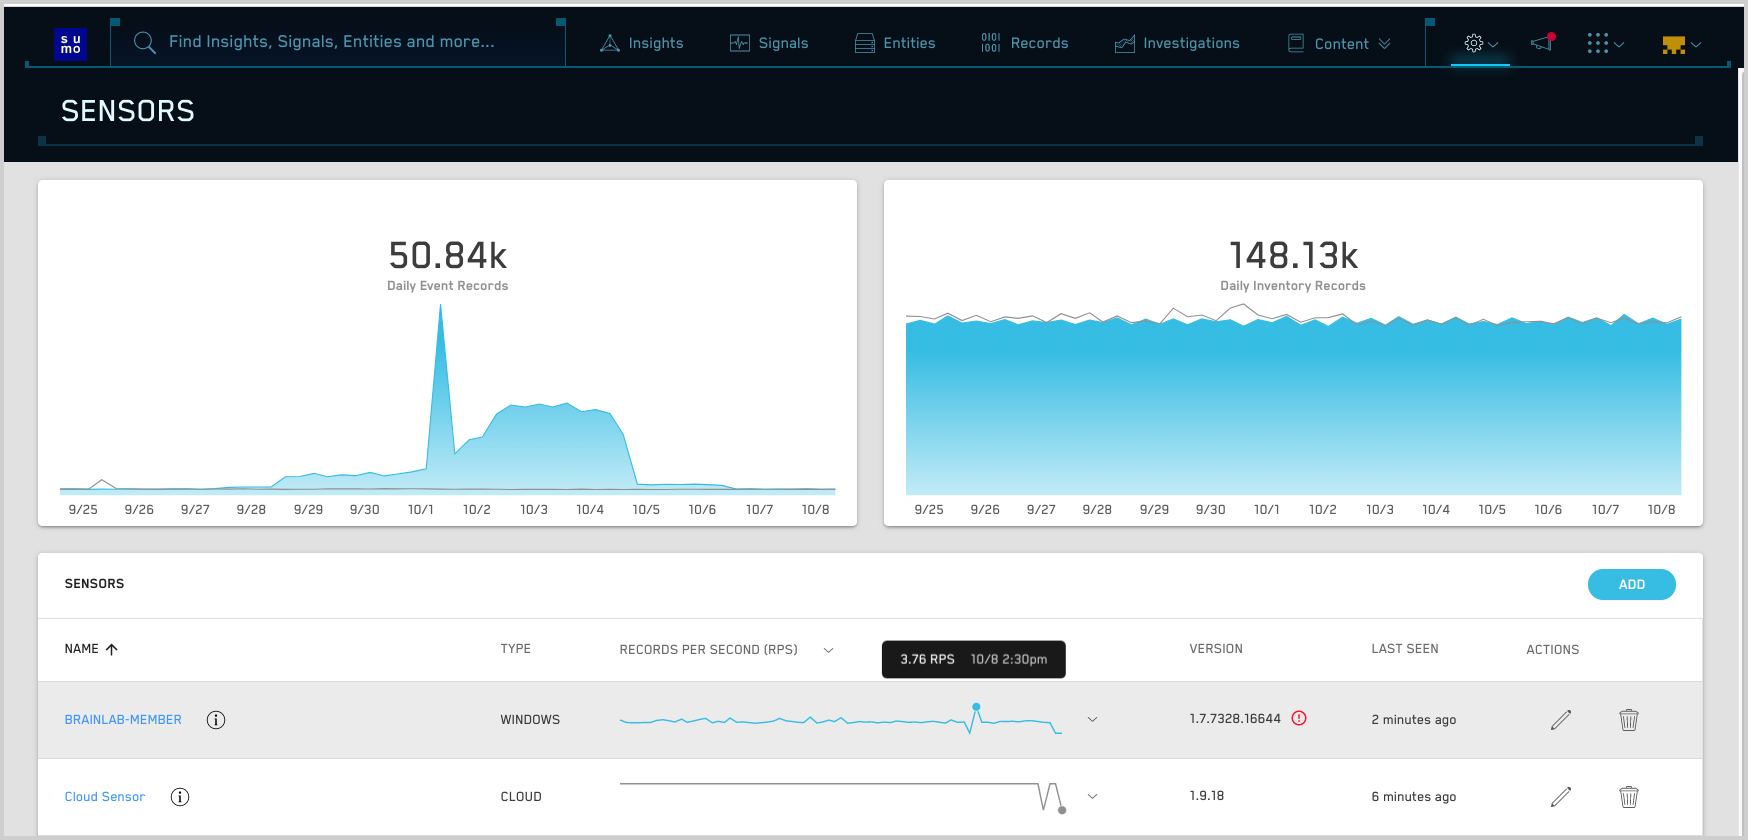
To search for individual Records that have been ingested, click the information icon next to the sensor name.
On the popup that appears, click the icon next to the Sensor ID to copy the Sensor ID to your clipboard. Then, close the popup.
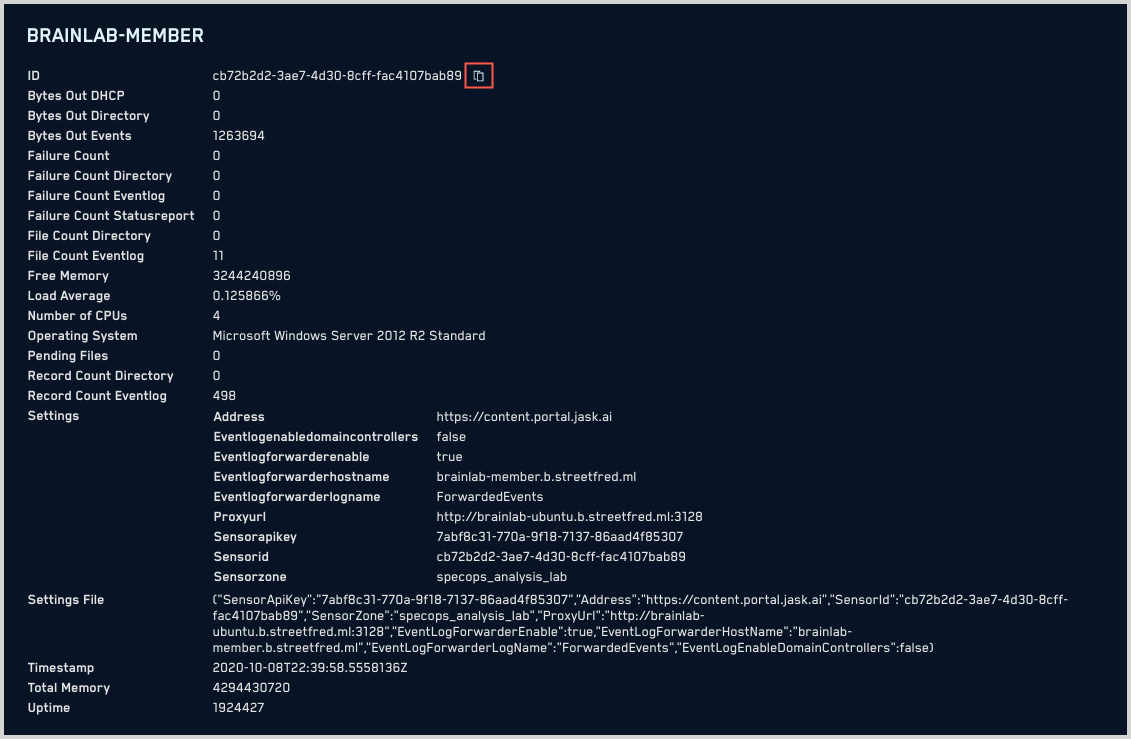
Click the Records tab at the top of the page.

In the Filters area, filter by Metadata Sensor ID and supply the Sensor ID you copied above. You can enter the following, or select the field and “is” when those options are suggested. Paste in the sensor ID from your clipboard.
Metadata Sensor ID is\<sensor I\>A list of Records appears.
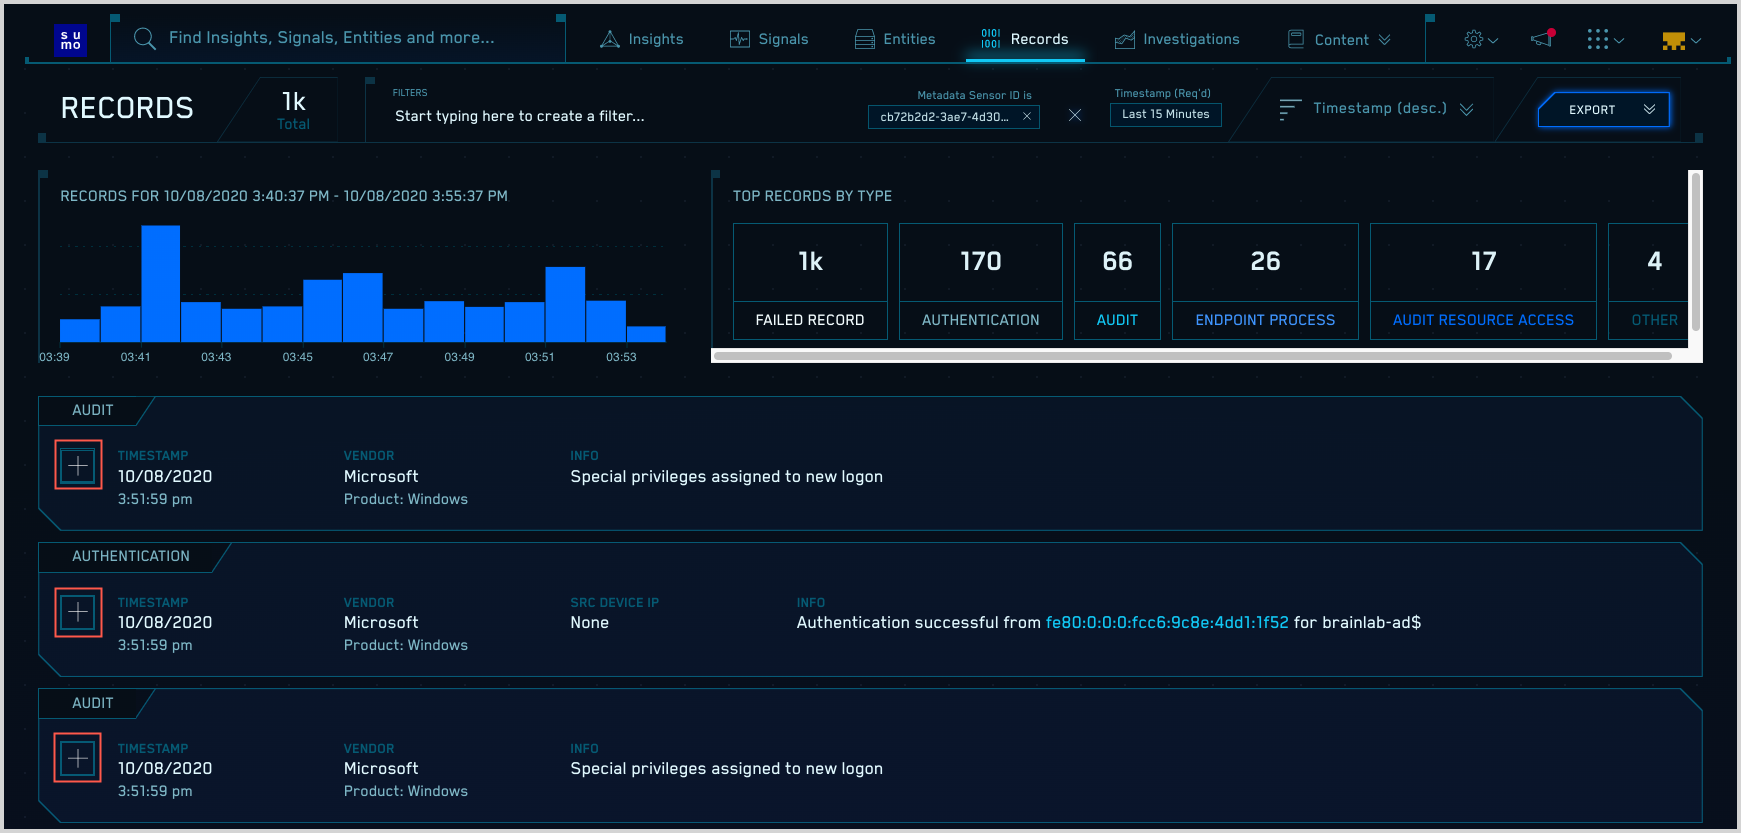
To view Record details click the plus sign at the left end of the row for a Record.
Examine the Records, checking that:
The computer name in a Record matches the computer name where the associated event occurred.
The Records have recent timestamps. Be sure to take time zone settings into account.
Compare the Records to source event logs, using the Windows Event Viewer. Keep in mind that the sensor configuration determines which categories of events are sent to the portal. For more information, see EventIdAllowList and EventIdDenyList.
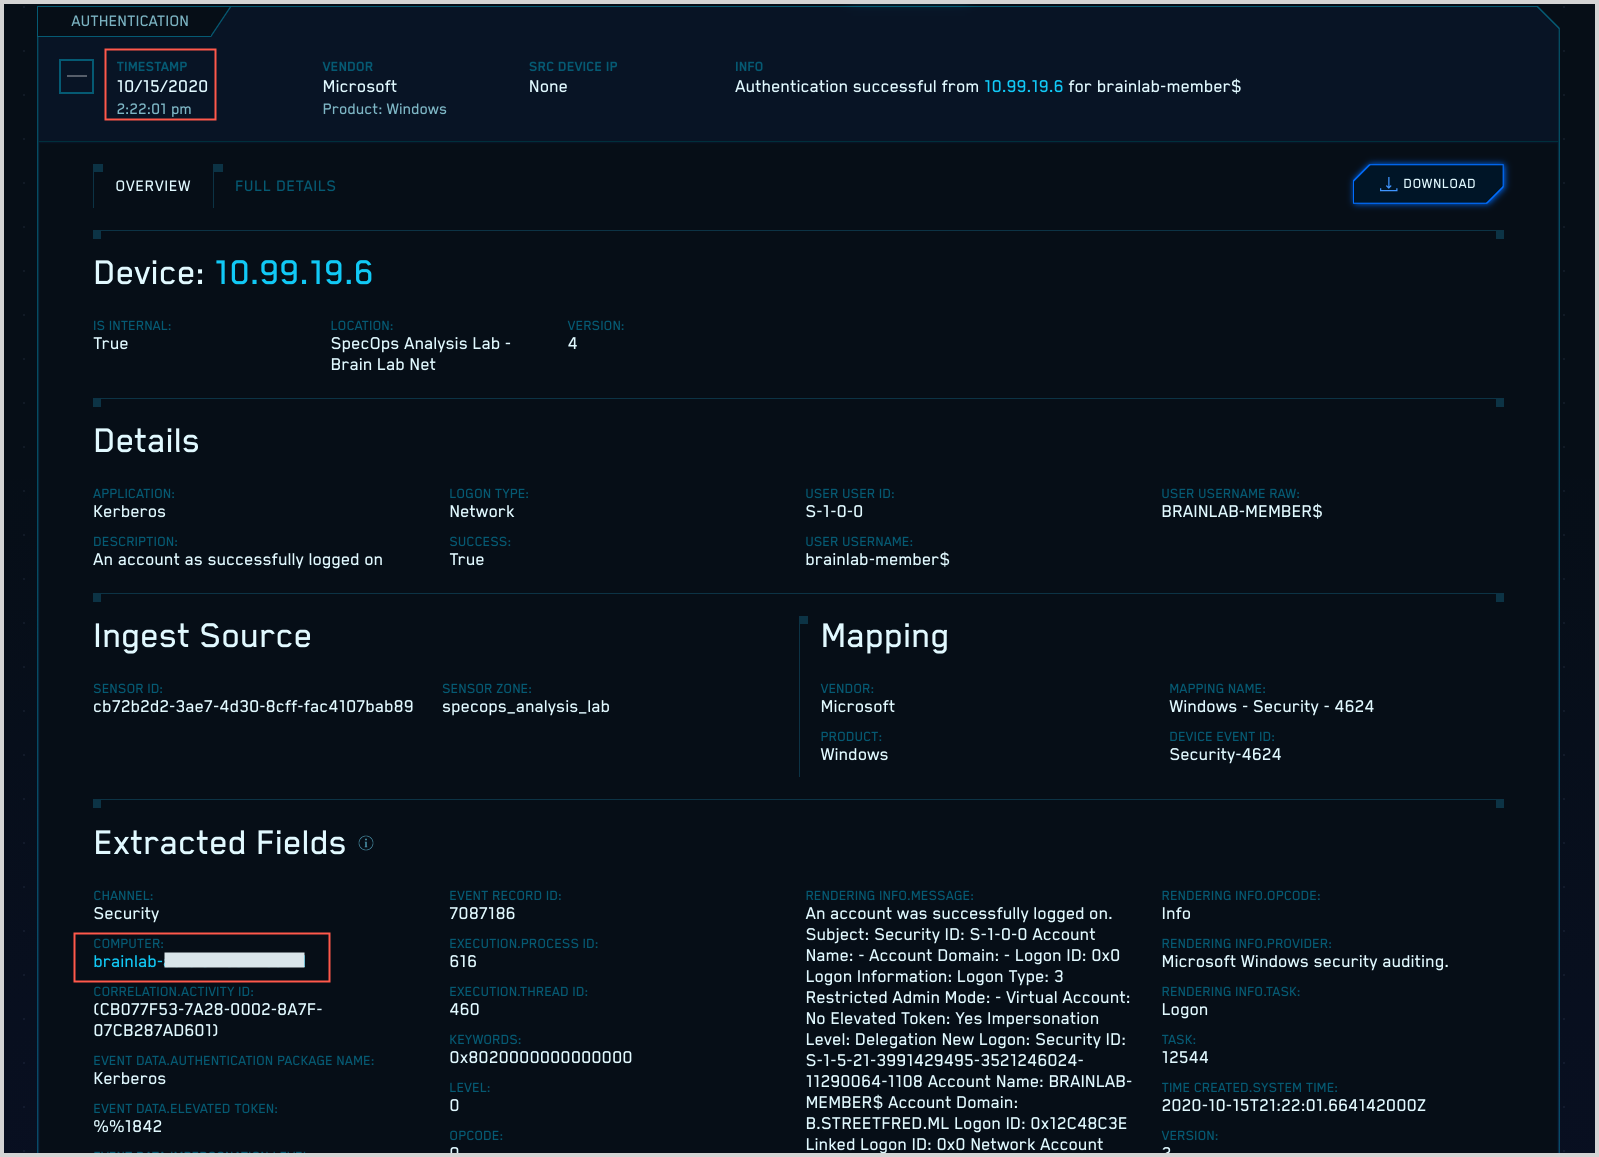
Check that Records appear in CSE UI
If you didn’t see Records in the step above, check the values of the SensorAPIKey and SensorID options in C:\ProgramData\Sumo Logic\CSE Windows Sensor\settings.conf. They should match the values shown on the sensor details popup that appears when you click the info icon for a sensor on the Sensors page.
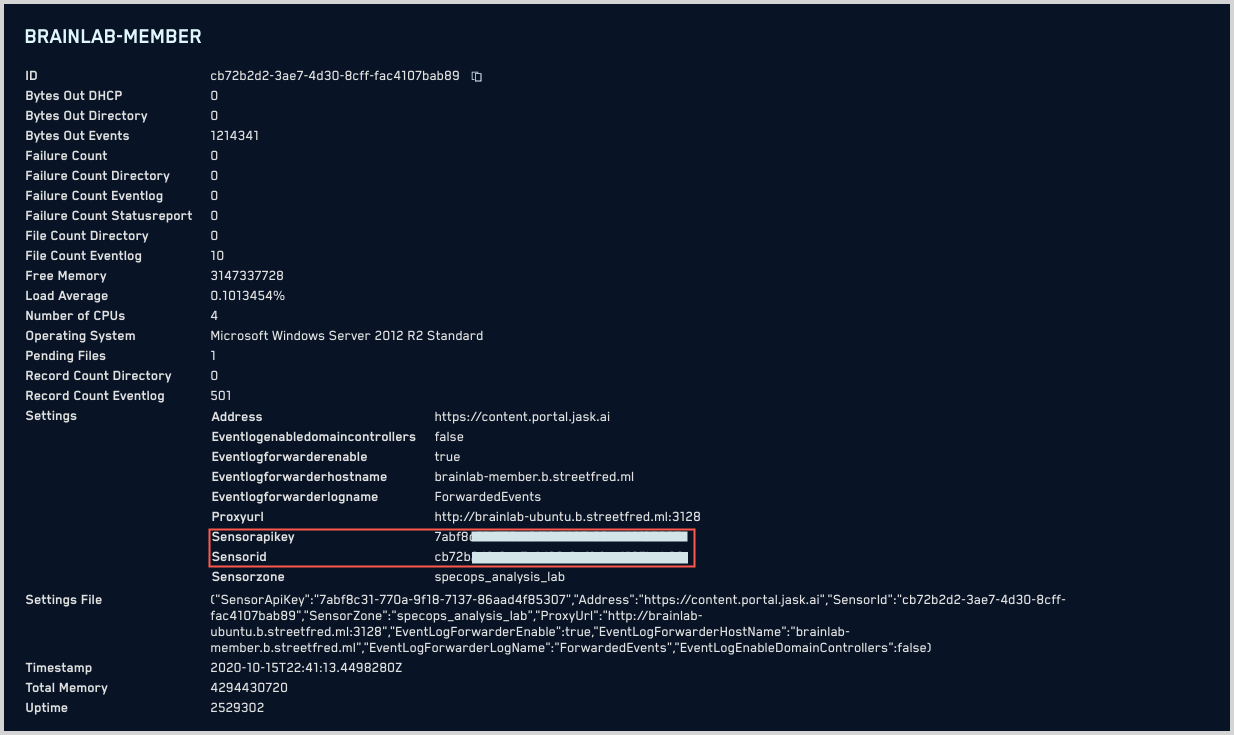
Check the sensor log file
How to view the sensor log file
You can open the Windows Sensor log file, C:\Program Data\Sumo Logic\CSE Windows Sensor\SumoLogic.CSEWindowsSensor.log, with Notepad or another text editor.
note
By default, the ProgramData folder is hidden by Windows and does not show up in Windows Explorer. To find it, enter C:\Program Data in the Windows Explorer address bar. Another option is to click the View tab in Windows Explorer and put a check mark next to “Hidden Items.” This will make hidden files and folders visible, including the ProgramData folder.
If you prefer, you can use a log tail program, like BareTail, instead of a text editor.
When you use BareTail, the view auto-updates so that you can watch the logs update in real time.
Turn on additional logging
By default, the Windows Sensor logs messages at an Informational level and above. This includes Informational, Warning, and Error levels. For more advanced troubleshooting, you can configure the sensor to log lower-level Debug or Trace messages as well. There are two approaches to changing the logging levels.
Using the command prompt, as described in Option 1, is the simplest approach to quickly enable and disable additional logging. However, if the problem you are troubleshooting involves the service not starting properly, or if you want the logging changes to persist across service restarts, you will need to edit the configuration files, as described in Option 2.
Option 1: Turn on additional logging from the command prompt
Using the sc command, you can send commands to the sensor service while it’s running to make adjustments to logging settings.
The available command codes are:
- 200 - Reload the sensor settings file
- 201 - Print current settings to the log
- 202 - Enable trace and debug logging
- 203 - Disable trace and debug logging
- 204 - Toggle Event Log verbose logging on or off
- 205 - Toggle Directory verbose logging on or off
To send a command, open a command prompt in Windows. Enter:
sc control SLCSEWS\<command cod\>
and press return.
For example, if you are troubleshooting a problem with the Event Log, run:
sc control SLCSEWS 204
to turn on verbose logging for Event Logs. The command will output some information about the state of the sensor service, which you can ignore. Check the sensor log file, C:\ProgramData\Sumo Logic\CSE Windows Sensor\logs\SumoLogic.CSEWindowsSensor.log, to see that your changes have taken effect.
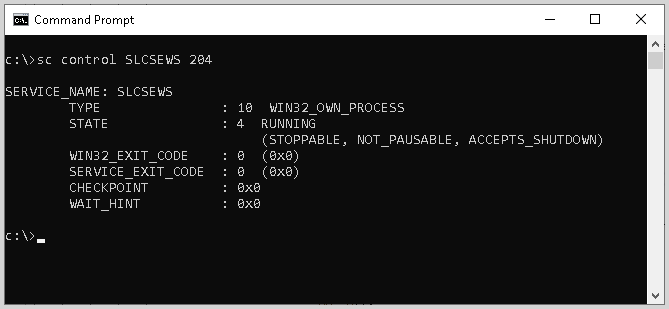
Reset Logging Levels
It is very important to reset logging levels after you’re done troubleshooting. Continued trace-level logging will cause your log files to grow enormously and consume large amounts of disk space.
For example, if you used code 202 to turn Trace and Debug logging on, be sure to use code 203 to disable it when troubleshooting is complete. If you used command 204 or 205 to toggle verbose logging ON for Event Log or Directory, issue the same command a second time to toggle it OFF. Alternatively, you can issue the following command to reload the original settings from the configuration file:
sc control SLCSEWS 204
Another way to reset logging is to simply restart the sensor service.
Option 2: Turn on additional logging by editing the logging configuration file
A more permanent alternative to issuing commands to the service while it is running is to edit the configuration files that control these settings.
To change logging levels for the sensor service as a whole:
Open a text editor as an Administrator (right-click on the icon and choose Run as Administrator), so that Windows will let you to save the updated logging configuration file in its current location. In the text editor, open C:\Program Files\Sumo Logic\CSE Windows Sensor\NLog.conf. Find the logging rule and change the line so that it looks like the following. Then save the file and restart the Windows service that runs the sensor.
<rules>
<logger name="*" minlevel="Trace" writeTo="file"/>
</rules>
After a sufficient period of time has passed to capture the problem (an hour or less, ideally), turn off trace-level logging. Edit NLog.conf again, to change minlevel back to “Info”, as shown below, and restart the service.
<rules>
<logger name="*" minlevel="Info" writeTo="file"/>
</rules>
Reset minLevel
It is very important to reset minlevel back to “Info” when you’re done troubleshooting is complete. Continued trace-level logging will cause your log files to grow enormously and consume large amounts of disk space.
To turn on detailed, verbose logging for Event Log or Directory inventory:
Open
C:\ProgramData\Sumo Logic\CSE Windows Sensor\settings.confin a text editor. Add these additional lines between the curly brackets:"EventLogVerboseTrace": true, "DirectoryLogVerboseTrace": trueThe settings in this file require a comma at the end of each line, except for the last line.
Save the file and restart the sensor service.
Setting EventLogVerboseTrace to “true” results in very detailed logging about the event log collection and upload process. Setting DirectoryLogVerboseTrace to “true” results in very detailed logging about the Active Directory inventory logging and upload process.
Both of these settings rely on the sensor logging level being set to Trace as described above.
For more information about setting Sensor configuration options, see Windows Sensor Configuration Settings.
Interpreting the Log Files
By default, entries for the sensor log contain the following components:
- Timestamp. The date and time that the event was logged, in local machine time
- Log level. ERROR, WARN, INFO, DEBUG, TRACE
- TID(1234). 1234 is the ID of the thread that generated the log message
- Identity. Domain and user name of the user running the sensor service
- Message. The log message, including exception information, if one occurred.
Some example messages that could indicate problems:
ERROR | Loading the settings.conf failed
Possible causes:
- The settings file doesn’t exist or is not accessible by the sensor service. The settings file is usually created during the installation process, and should be located at
C:\ProgramData\Sumo Logic\CSE Windows Sensor\settings.conf. For more information, see Check folder permissions. - The Sensor couldn’t deserialize (parse) the JSON in the settings file. Check for syntax errors like missing commas, or opening brackets without closing brackets, and so on. For more information, see Windows Sensor Configuration Settings.
ERROR | Username: [user] is not in Event Log Reader Group OR Performance Monitor Users Group
Possible causes:
- The service is not running under the correct user name.
- The username is not an Administrator and does not have the required permissions. For more information, see Verify that the service account has the necessary permissions.
ERROR | A queue path could not be found or created. Please check permissions.
Possible cause:
- The user that the service is running under does not have permissions to write to the
C:\ProgramDatadirectory. For more information, see Check folder permissions.
ERROR | There have been many recent errors. Enable trace-logging to view them.
Possible cause:
- The sensor service has detected a large number of errors that may not have been logged due to the configured logging level. The errors are related to analyzing and storing Event Log records. Use one of the options in Turn on additional logging above to turn on Trace logging for more information about the root cause.
WARN | Could not post to DirectoryUploadUrl [directory URL] OR EventUploadUrl [event URL]
Possible causes:
- The URL was not entered properly during installation. Check the
Addressentry insettings.conf. - A firewall may be blocking outbound communication to Sumo Logic. For more information, see Outbound internet communications requirements in the Windows Sensor Installation topic.
- The computer that the sensor service is installed on may be behind an HTTP Proxy. For more information, see the sample configuration settings for Proxy configuration in the Windows Sensor Configuration Settings topic.
How to send Sensor troubleshooting data to Sumo Logic
If your troubleshooting efforts are not successful, you can send CSE log and configuration files to CSE support.
- Before you send the data to CSE support, we recommend you configure the sensor for trace-level logging using one of the options in Turn on additional logging above.
- After one hour, turn off trace-level logging. Continued trace-level logging will cause your log files to grow enormously and consume large amounts of disk space.
- Zip up the contents of
C:\ProgramData\Sumo Logic\CSE Windows Sensor\and contact your Technical Account Manager for the best way to send the data to support.
Check folder permissions
If the sensor is having difficulty sending data either after a fresh install or an upgrade, verify that the Service Account assigned to run the event sensor has permissions to the folders as follows:
The CSE Windows Sensor Service Account must have READ and WRITE access to this folder:
C:\ProgramData\Sumo Logic\CSE Windows Sensor
The CSE Windows Sensor Service Account must have READ access to this folder:
C:\Program Files\Sumo Logic\CSE Windows Sensor
Check for sufficient hard drive space
The sensor requires that some hard drive space is available on the local machine in order to store sensor log files as well as event logs and directory entries that have been queued for upload. It is important to make sure that sufficient space is available on the hard drive so that the sensor can operate properly.
The sensor stores files in the Common Application Data folder, which by default is located at C:\ProgramData. To check available disk space:
- Open File Explorer in Windows.
- Under This PC, look for Local Disk (C:).
- Right-click Local Disk (C:) and select Properties.
- The General tab displays information about the used space, free space, and capacity of the drive.
The sensor requires that at least 5% of the disk’s capacity be free.
Check if the sensor is preventing additional log file accumulation
The sensor has built-in protection to keep it from filling up the hard drive. When the sensor detects that available space is too low, it will stop capturing event logs or directory entries until the disk space issue has been resolved.
The sensor uses three metrics to determine if disk space is too low.
- Available Hard Drive Space must be more than 5% of disk capacity.
- Size of Event Log Queue folder (
C:\ProgramData\Sumo Logic\CSE Windows Sensor\EventLogQueue) must be less than 2048 MB. - Size of Directory Queue folder (
C:\ProgramData\Sumo Logic\CSE Windows Sensor\DirectoryQueue) must be less than 2048 MB. - These limits are configurable. See MinPercentDiskSpaceLeft, MaxEventLogQueueFolderDirectorySize, and MaxDirectoryQueueFolderDirectorySize in the Windows Sensor Configuration Settings topic.
To determine if the sensor is not reporting event logs or directory entries due to low disk space, you need to turn on additional logging. First, configure the sensor for trace-level logging, as described in Turn on additional logging above.
Once the logging and configuration settings have been changed, and the sensor service has been restarted, check the log file. Search the log file for the words “dropping message.” If these appear in the file with a recent timestamp, it indicates that the sensor is no longer logging, either due to low disk space on the machine or the folder size limits being hit. To resolve the first issue, clear up disk space on the local hard drive by deleting unnecessary files. If enough disk space is available, see Check if the EventLogQueue or DirectoryQueue has a backlog, below.
Once the issue has been resolved, be sure to reset the logging levels, so as not to exacerbate any low disk space conditions that may exist.
Check if the EventLogQueue or DirectoryQueue has a backlog
One scenario that could result in event logs or directory entries not being logged is when the folders where logs are accumulated have reached the maximum size limit allowed by the sensor (2048 MB each, configurable).
Use Windows File Explorer to navigate to the queue folders, which are located at:
C:\ProgramData\Sumo Logic\CSE Windows Sensor\EventLogQueueC:\ProgramData\Sumo Logic\CSE Windows Sensor\DirectoryQueue
To check the size of the folder, right-click on its name in File Explorer, choose Properties, and look for the Size listing on the General tab. The number of files will also be listed next to Contains.
Under normal operation, there should be only a handful of files in each folder. If there are a large number of files in the folder, it could indicate that there is a backlog of messages being uploaded.
Open the folder using File Explorer to view its contents. If the view does not show the file details (file name, date modified, size, and so on), right click on the pane, choose View and then select Details. Watch the folder while the sensor is running. The temporary files in the directory will increase in size while events or directory entries are being logged to them, and they will be deleted as the messages in those files are uploaded to the Sumo Logic platform.
Sort the list by date modified. If there are files with modified dates more than several minutes old, this could indicate a problem.
If the EventLogQueue or DirectoryQueue folders show a backlog, check the sensor log files for error messages relating to upload. If the logs do not reveal any issues, the problem could be related to insufficient network bandwidth for the volume of logs processed.
Verify that Microsoft.NET Framework v4.8 or later is installed
Make sure that the member server where the sensor runs has .NET, v4.8 or later, and that all operating system updates and patches have also been installed
To check the version of .NET using regedit:
On the Windows Start menu, choose Run.
In the Open box, enter
regedit.exe. You must have administrative credentials to runregedit.exe.In the Registry Editor, open the following subkey:
HKEY_LOCAL_MACHINE\SOFTWARE\Microsoft\NET Framework Setup\NDP\v4\Full.Find the
Releasekey, and verify that the value is 528040 or higher.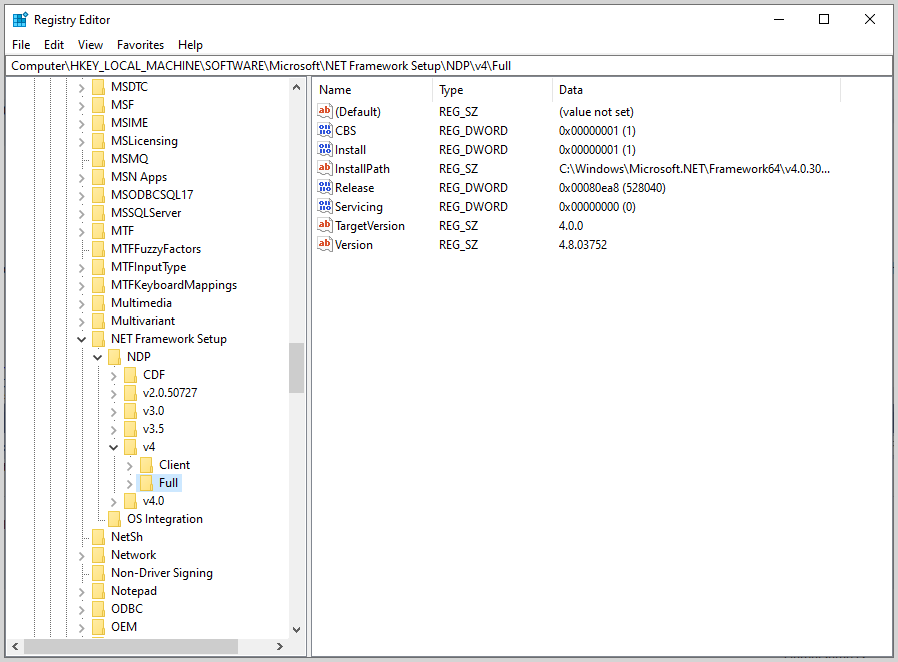
Verify connectivity to the Event Log Service
The CSE Windows Sensor makes a low-level RPC connection to the Event Log service. Sometimes this connection doesn’t function properly. In this test, you will make a connection using out-of-the-box Microsoft Windows tools. If it doesn’t work in Windows, then the CSE Windows Sensor won’t work.
From the member server that the CSE Windows Sensor is installed on:
- Start the Microsoft Event Viewer (from the Control Panel).
- Use Action > Connect to another computer to connect to a remote machine.
- For the server name, enter localhost, the WEC server, or each domain controller depending on how the sensor is configured. By default, the domain controller monitor is enabled. If you are using the default configuration, then enter a domain controller as the server name.
Once you connect, make sure that you can see events in the Security log.
If you are using the WEC monitor, then make sure that you can see events in the Forwarded Events log (or other log if you’ve directed the WEC server to a different location.
Repeat these steps for each domain controller. In other words, if you have 10 domain controllers, you should try to connect to each of the controllers from the member server where the sensor runs.
Verify domain controller IP addresses and hostnames
Make sure that the hostnames of your domain controllers match the expected IP addresses.
From the server where the sensor runs, ping each domain controller. For example:
ping dc1.example.com ping dc2.example.com ping dc3.example.com
From the server where the sensor runs, use nslookup and check the IP address of each domain controller. For example:
nslookup dc1.example.com nslookup dc2.example.com nslookup dc3.example.com
Check that the IP addresses are what you expect.
Verify the IP Addresses and hostname of the Sumo Logic endpoint
During the installation of the Windows Sensor, you were prompted to supply the URL of the HTTP Source to which the sensor will send data. Using that address perform the following:
note
Replace the example URL with the actual URL of the HTTP Source in the following examples.
Ping the address. For example:
ping https://collectors.sumologic.com/receiver/v1/http/…
Using nslookup, make sure that the address’s IP address is reasonable. You may not know the Sumo Logic IP addresses. For now, just make sure that the IP address is not on your LAN. For example:
nslookup https://collectors.sumologic.com/receiver/v1/http/…
Using curl, attempt to access the end point. Use the “verbose” switch (-v). A successful connection returns an HTTP 200 and SSL certificates are valid. For example:
curl -v https://collectors.sumologic.com/receiver/v1/http/…
Advanced troubleshooting
Check for RPC port issues (rare problem)
Verify that the RPC port works between the member server and the domain controller,
Use psping to check that the member server where the Windows Sensor is install can connect to each domain controller over one of these ports: 135, 137, 139
Check outbound firewall rules
Run the following command in any terminal window to determine the IP address associated with the URL at which users access the CSE UI.
dig\<customernam\>.portal.jask.aiSave the IP address that is returned.
Run the following command in any terminal window to determine the IP addresses that CSE has configured for the endpoint. There are more than one because the end-point is load balanced.
dig\<customernam\>-ingest.jask.aiSave the four IP addresses that are returned.
Verify that your firewall rules enable outbound TCP traffic on port 443 for each of these:
<customername>.portal.jask.ai<customername>-ingest.jask.ai- The IP address returned by the command you ran in step 1 above.
- The four IP addresses returned by the command you ran in step 3 above.