What is the AWS Observability Solution?
What is observability?
Observability is the ability of the internal states of a system to be determined by its external outputs. For our purposes, Observability is the ability to observe an application from the outside and understand what is happening inside the application and its services. It helps ensure that the application is running reliably: the system is up and running (available), performant, and secure.
Modern applications are increasingly complex, as they leverage distributed technologies, cloud infrastructure, and container and orchestration tools. In addition, the connections between microservices, orchestrators, and underlying cloud resources is also growing in complexity. This complexity leads to situations where unforeseen events, unknown unknowns in terms of risk, are more prevalent and come with mysterious behaviors and failure modes. This can cause major issues in your overall incident remediation workflow, which can be broken down into three steps.
See About the Observability Solution to learn more.
What is the AWS Observability solution?
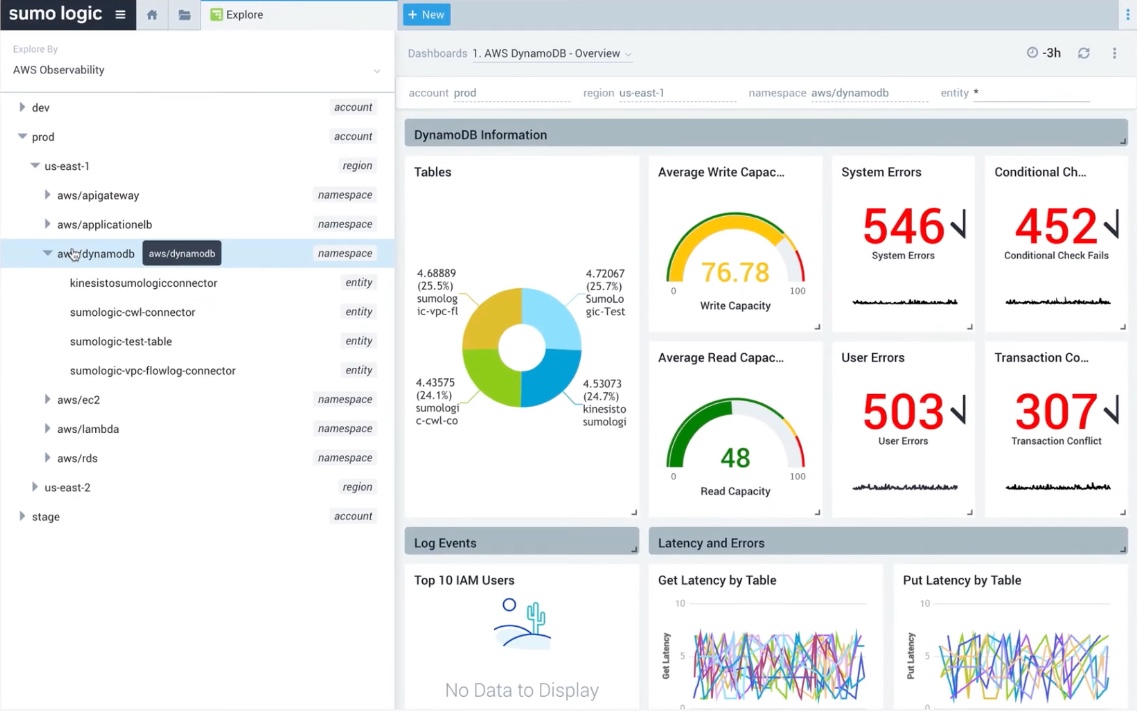
AWS Observability enables you to view your entire AWS environment in a single pane of glass, while seamlessly surfacing anomalous events of interest correlated with application incidents. It includes the AWS Observability Solution and Root Cause Explorer:
- AWS Observability Solution - Sumo Logic’s AWS Observability solution pulls in data across key AWS services and accounts to give a unified view of AWS environments. Easily navigate from overview dashboards into account, region, availability zone, or service specific views. Intuitive navigation ensures teams can quickly resolve issues, minimize downtime, and improve system availability. See About AWS Observability.
- Root Cause Explorer (RCE) - Sumo Logic's Root Cause Explorer makes it easy to visualize anomalous events of interest across multiple AWS services to quickly identify the root cause of application incidents. It relies on AWS CloudWatch metrics to enable on-call staff, DevOps, and infrastructure engineers to expedite troubleshooting and root cause isolation for incidents in their apps and microservices running on AWS infrastructure. Sumo Logic establishes an activity baseline and surfaces only high deviation events of interest. Cut down issue resolution time with seamless visibility into impacted services. See Root Cause Explorer).
See AWS Observability Apps for detailed information on all supported apps including Application and Network Load Balancer, DynamoDB, EC2, RDS, API Gateway, ECS, and ElastiCache.
What AWS services are supported?
Sumo Logic AWS Observability supports the following AWS services: EC2, ECS, RDS, ElastiCache, API Gateway, Lambda, DynamoDB, Application ELB, Classic ELB, and Network ELB.
Sumo Logic Root Cause Explorer analyzes and correlates metrics from all supported AWS Observability services and EBS, Autoscaling, X-ray, SNS, and SQS.
Can we monitor other AWS services?
AWS Observability provides a view across AWS accounts, regions, namespaces, and entities to present an intuitive navigation flow. You can add additional services to the AWS hierarchy as dashboards based on logs and metrics data to the AWS Observability Explore views, expanding as you add new services.
Adding a service requires:
- The AWS Observability solution must be installed for at least one supported service.
- Collect metrics for your service using a Sumo Logic AWS Cloudwatch metrics source for an AWS account currently monitored by the AWS Observability solution. We recommend creating a new AWS CloudWatch metrics source for the service you want to monitor as opposed to using an existing source for performance reasons.
- Create at least one Sumo Logic dashboard based on CloudWatch metrics and log data to monitor the operations of the AWS Service.
See Add a New AWS Service to the AWS Observability Explore Hierarchy to add a new service to the AWS Observability hierarchy.
Does AWS Observability require logs and metrics?
For full functionality of the out-of-the-box dashboards, the solution requires CloudWatch logs and metrics, EC2 Host Metrics (via installed collectors), and CloudTrail logs. You may be sending real-time data from AWS, primarily used for logs. These features expand monitoring to provide advanced analytics for large-scale AWS operations from the same dataset.
Who can use the new features?
Any Sumo Logic customer can leverage Sumo Logic AWS Observability solution features.
Root Cause Explorer is available for CloudFlex/Enterprise, Credits/Enterprise Operations, and Credits/Enterprise Suite account plans.
Is there a demo of the solution?
See the Sumo Logic AWS Observability demo video for a demo of the solution.
