Log Analysis QuickStart App
The Log Analysis QuickStart App, created for new users of Sumo Logic, includes searches to extract important information from your log files, independent of where they get generated. Whether you are new to log management or plan to migrate from other products, the Log Analysis QuickStart app will bring you up to speed with the Sumo Logic search, visualization, and analytics capabilities.
Install the Log Analysis QuickStart App
To install the app:
From App Catalog, search for the Log Analysis QuickStart App app.
Click Log Analysis QuickStart App.
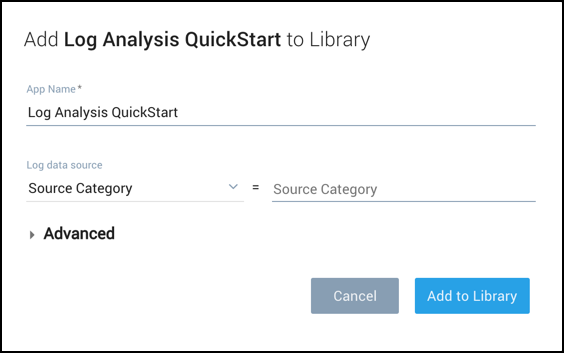
Click Add to Library, this will open a window.

note
If you do not select the correct _sourceCategory, data will not be loaded into the app. If you don't know which _sourceCategory to select, ask the administrator who configured the Source.
Select from _sourceCategory values. Choose an existing _sourceCategory present in your account used for your Sumo Logic data.
Click on Advanced, choose either the Personal folder or a subfolder in the Personal folder. (Click the blue + to create a new subfolder).
Click Add to Library. A dialog will confirm the app is installed successfully.
Visits
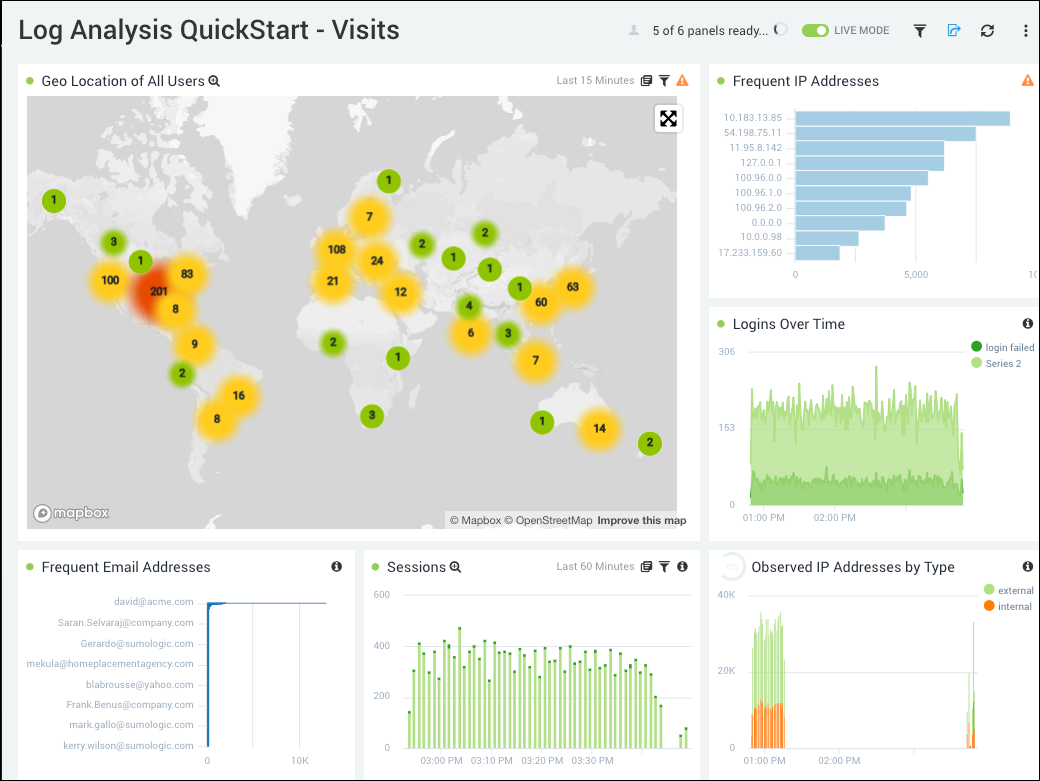
The Visits Dashboards displays identifying information about external and internal visitors across you deployment, including email addresses visitors are using.

- Geo Location of All Users. Uses a geolocation search to display the locations of IP addresses used by visitors.
- Frequent IP Addresses. Shows a list of the most frequently used IP addresses by visitors.
- Logins Over Time. Displays the successful and failed logins over the past three hours.
- Frequent Email Addresses. Displays the most frequently used email addresses.
- Sessions. Monitors** **errors across all sessions in your deployment.
- Observed IP Addresses by Type. Displays IP addresses used by internal and external visitors.
Keywords and Metadata
This Dashboard provides several ways to monitor your logs based on the metadata of your data. All of the Panels include searches for specific issues. You can learn more about metadata options in Search Metadata.
- High Priority Keywords. Displays how often the terms error, failure, and exception appear in all log messages over time.
- Medium Priority Keywords. Displays how often the terms time out, warn, check, exist, reject, deny, and timeout appear in all log messages over time.
- Issues by Origin. Displays how often high priority keywords occur by the origin of issue, which could be application, data or service.
- Issues in Top Categories. This Panel shows the top 10 source categories by number of log messages that contain error, exception, or failure terms.
- Issues in Top 10 Hosts. Displays the top 10 hosts by number of log messages that contain error, exception, or failure terms.
- Issues in Top 10 Files. Shows the top 10 files by number of log messages that contain error, exception, or failure terms.
- Issues by Category. This Panel shows the number of log messages that contain error, exception, or failure terms by Source Category over time.
- Issues by Host. Displays the number of log messages that contain time out, error, exceptions, and failures broken down by Source Host over time.
- Issues by File Name. Displays the number of log messages that contain error, exception, or failure terms issues by log file name over time.
Collectors and Source Monitoring
The Panels in the Collector and Source Monitoring Dashboard help you keep an eye on the machines running Collectors and Sources. If a machine begins to have issues (such as no logs being uploaded to Sumo Logic) you'll know at a glance.
- Issues by Collector. This Panel displays the number of log messages that contain error, exception, or failure terms by Collector.
- Issues by Source. Shows the number of log messages that contain error, exception, or failure terms by each Collector's Source.
- Collector Issue Monitoring. Displays warnings generated over time for each Collector in your deployment.