Monitors
Sumo Logic Monitors allow you to set robust and configurable alerting policies that enable you to get notified about critical changes or issues affecting your production application.
Monitors track your Metrics or Logs data in real time and send notifications when noteworthy changes happen in your production applications.
note
See details on how Scheduled Searches are different.
Rules
You need the Manage or View Monitors role capability) to manage or view Monitors respectively.
The frequency a Monitor executes depends upon a variety of factors such as the underlying query, the operators used, and the detection window. It can vary from a couple of seconds to a few minutes. If for example, the detection window of your alert is one day it will be evaluated every couple of minutes, whereas if the detection window of the monitor is 15 minutes then it will be evaluated every couple of seconds.
Log Monitors use the role search filter of their creator.
Log Monitors delay execution by two minutes. This means it won't evaluate data from the current time, but evaluate data from two minutes ago. This ensures that any delays in ingestion are factored in and won't generate false positive or false negative alerts.
Metric Monitors delay execution by one minute.
Depending on your account type, you can have up to a certain number of Log and Metric Monitors.
- Enterprise and Trial can have up to 1,000 Log Monitors and 500 Metric Monitors.
- Essentials and Professional can have up to 300 Log Monitors and 500 Metric Monitors.
- Free can have up to 50 Log Monitors and 50 Metric Monitors.
Limitations
- Receipt Time is not supported.
- Monitors only support the Continuous data tier.
- An aggregate Metric Monitor can evaluate up to 15,000 time series. A non-aggregate Metric Monitor can evaluate up to 3,000 time series.
- Save to Index and Save to Lookup are not supported.
- Search templates are not supported.
- A Log Monitor can have one query up to 4,000 characters long. Metric Monitors can specify up to six queries.
- Email notifications can have up to 100 recipients.
- Dynamic Parsing (auto-parse mode) is not supported.
- The timeshift metrics operator (../../Metrics/Metric-Queries-and-Alerts/07Metrics_Operators.md "Metrics Operators") is not supported in a Metric Monitor.
- Hidden Metrics queries do not persist across edit sessions.
- The last millisecond of the defined time range is not searched. For example, a time range of 6:15 to 6.30 pm will run as 6:15:00:000 to 6:29:59:999.
Notifications
Notifications are optional and available as an alert and recovery for each trigger condition you specify, critical, warning, and missing.
Alert
- Monitors keep track of the notifications it sends and won't send additional notifications after sending the first one if the incident persists. It will only send additional notifications if there is a major change in the state of the monitor, such as new triggers from Warning to Critical or a different time series is detected.
- When more than one trigger condition is met notifications are sent based on the trigger conditions:
- When both Critical & Warning conditions are met two separate notifications are generated, one for the Critical condition and one for the Warning condition. Auto resolution, if set up, will work according to the resolution condition for each case.
- When the Missing Data condition is met after initially firing a critical/warning incident the system will resolve the Critical or Warning incident that was created with the appropriate resolution reason. The system will also create a new Missing Data incident and notify you appropriately using your configured notification channel.
- Metric Monitors have the option to group notifications. When configured, the Monitor will not trigger new notifications until the first one is resolved. The Monitor will only update if the notification type supports Auto Resolution. Grouped notifications will resolve when all the time series return to normal.
- Log Monitors always group notifications.
Recovery
- Recovery is based on the detection window, which is either the time range or the number of data points of the trigger condition. An alert is recovered (resolved) when the recovery condition is met for the entire duration of the detection window. For example, if an alert is triggered at 1 PM and the detection window is 15 minutes, the earliest the alert would recover is after 1:15 PM since the entire detection window must pass. This is to ensure there isn't an alert between the triggered and resolved state, especially for metrics that are volatile.
- Auto Resolution is supported with Email, Lambda, Microsoft Teams, OpsGenie, PagerDuty, Slack, and generic webhook connections. Support for other connection types is coming soon.
- For Lambda and generic webhooks, the same payload for both alerts and recovery is used.
- Email, Microsoft Teams, OpsGenie, PagerDuty, and Slack recovery notifications are hardcoded by Sumo Logic and cannot be edited. The recovery payload is not the same as the alert payload.
- The recovery notification is sent to the same channel where the corresponding Alert notifications were sent. In other words, you cannot have different channels where you receive alert and recovery notifications for a given trigger condition.
- After one day without new data to an incident, the system automatically expires it. The incident is marked as resolved with the resolution set to Expired.
Tools
- Monitor resource in Terraform
- [Monitor management API] (../../APIs/Monitor_Management_API.md)
Monitors page
The Monitors page allows you to view, create, and manage Monitors. You can create and organize your Monitors into folders. To access the page go to Manage Data > Monitoring > Monitors.
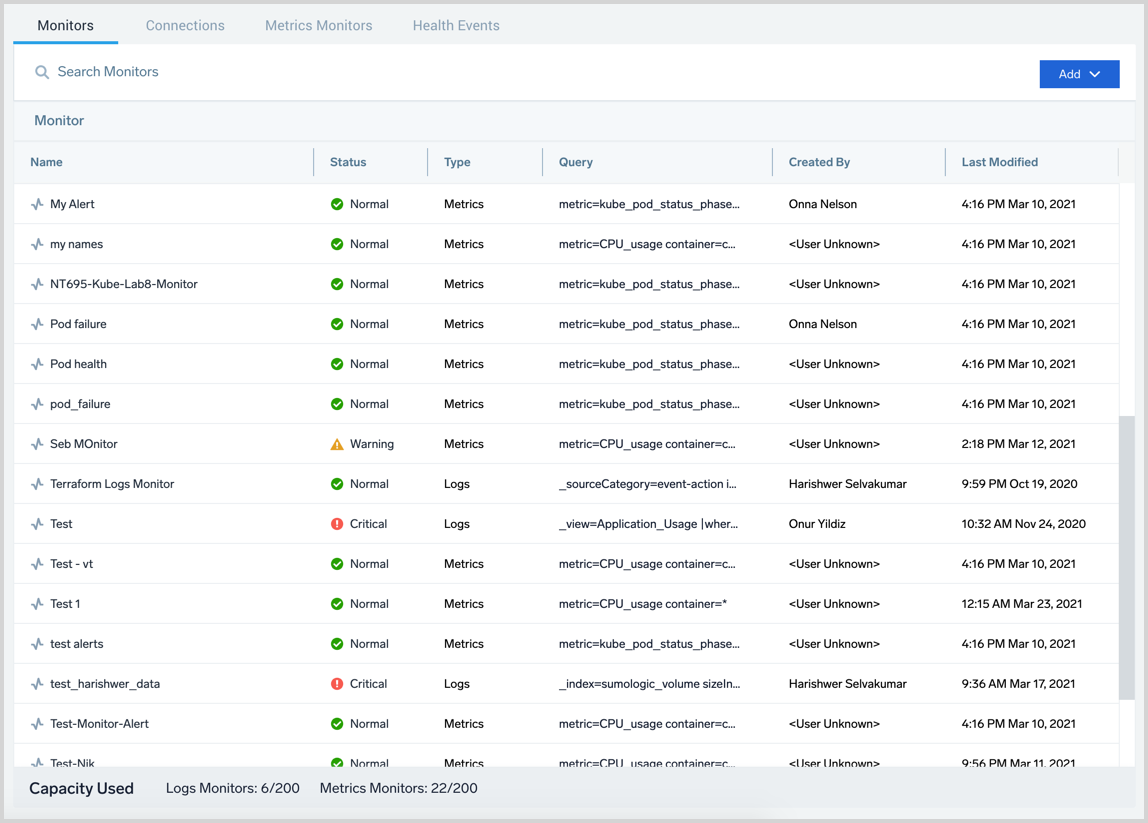
The page displays the following information:
- Name. Name of the Monitor.
- Status. A Monitor is considered Normal when none of the trigger conditions are met and your data is actively being monitored.
- Type. A Monitor type is either Logs or Metrics, based on the type of data being monitored.
- Query. The query the Monitor is running to track your data.
- Created By. The user that created the Monitor.
- Last Modified. The time the Monitor was last updated.
- Capacity Used. The bottom of the table shows the number of Log and Metric Monitors in your account.
To quickly open the Alert List to view all of the triggered alerts from a Monitor hover your cursor over its Status and click the icon.

At the top of the page, you can:
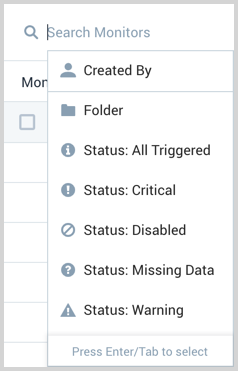
Search Monitors. Use the search field to filter Monitors by name and status. For example, you can view all Monitors that are currently triggered in the system by clicking the Status: All Triggered.
Click Add to:
create folders for organizing your Monitors.
create a new Monitor.
import Monitors from the exported JSON you copied from the More Actions menu in the Details pane of the original monitor.
important
The Import function is provided for you to transfer data immediately. The Sumo Logic JSON format may change without notice. There is no guarantee that you will be able to import the JSON in the future.
Quick menu
The quick menu allows you to make changes to the Monitor without opening the Details pane. Find and hover your mouse over a Monitor in the Monitors table. A three-dot icon appears on the right of the row. Click the three-dot icon to view a menu with all of the options available in the Details pane.

Details pane
The details pane provides additional information about a selected Monitor, like its query, trigger conditions, and notification preferences. For the monitors listed, select a row to view its details. A details pane appears to the right of the table.
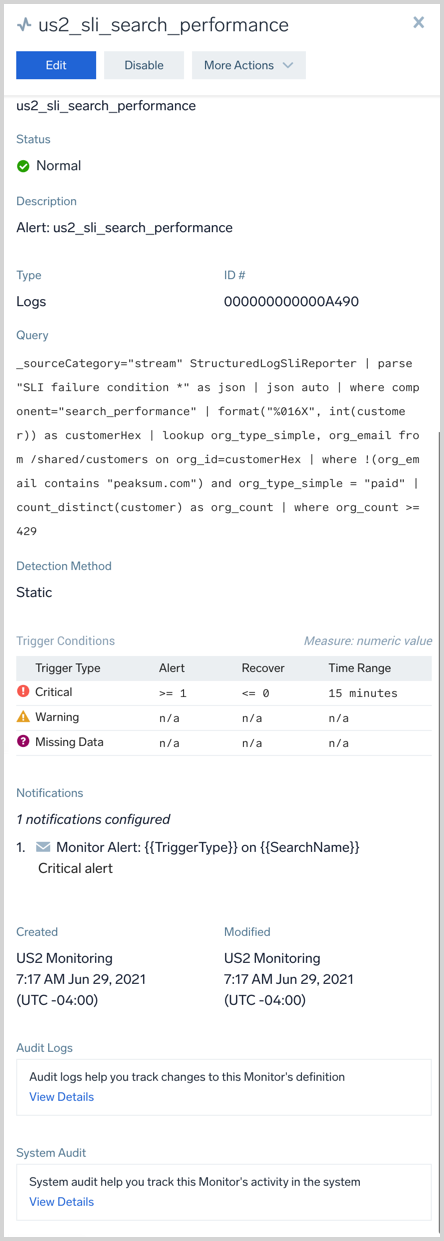
In the details pane you can see the following details for a Monitor:
- Name of the Monitor.
- The status of the Monitor, either Normal, Critical, Warning, or Missing Data. A Monitor can be in multiple states at the same time.
- Description of the Monitor.
- Type of Monitor, either Logs or Metrics.
- Path is the Library location where the Monitor is stored.
- Query used to track your data.
- Trigger Conditions that are set on the Monitor. Applicable values include Critical, Warning, and Missing Data.
- Notifications configured on the Monitor.
- The timestamp and user that Created and last Modified the Monitor.
Edit, Disable, More Actions
Use the Edit button to make changes to the selected Monitor.
The Disable button puts the Monitor in a disabled state so it will not fire any notifications.
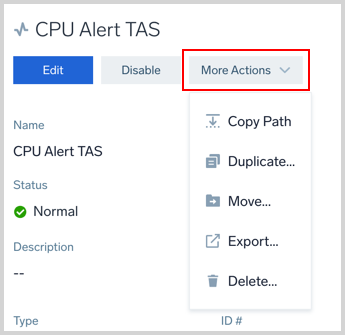
Under the More Actions menu you can:
- Disable and Enable. A Monitor that is in a disabled state will not fire any notifications.
- Copy Path. Copy the path of the Monitor to your computer clipboard.
- Duplicate. Make another Monitor based on the same settings.
- Move. Move the Monitor to a different path.
- Export. Provides JSON of the Monitor, allowing you to transfer content within Sumo Logic by copying this JSON, then pasting it into the import dialog in the Library location you choose. This JSON format may change without notice.
- Delete.
Add a monitor
On the Monitors page (to access the page go to Manage Data > Monitoring > Monitors) click on the Add button then New Monitor to add a new Monitor. The creation dialog box will appear.
You can configure Sumo Logic Monitors using Terraform modules.
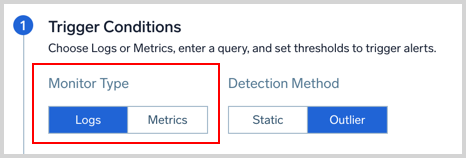
Select a Monitor Type, either Logs or Metrics.
Select a Detection Method, either Static or Outlier.
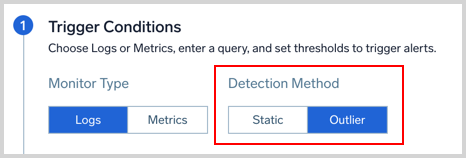
- Static allows you to set specific threshold conditions. Use this detection method when you are alerting on KPIs that have well defined and constant thresholds for what's good and bad. For example, infrastructure metrics like CPU utilization, and memory.
- An outlier is an unusual change or a spike in a time series of a key indicator. Use this detection method when you are alerting on KPIs that don't have well-defined constant thresholds for what's good and bad. You want the Monitor to automatically detect and alert on unusual changes or spikes on the alerting query. For example, application KPIs like page request, throughput, and latency.
Provide a Query. A Log Monitor can have one query up to 4,000 characters long. Metric Monitors can specify up to six queries. When providing multiple metrics queries use the letter labels to reference a query row, see joined metrics queries for details. The Monitor will automatically deduce the query row to use for the trigger.
Outlier detection methods require you to select the Direction you want to track. If you chose Static, you won't see this option.
- Up. Only get alerted if there is an abnormal increase in the tracked key indicator.
- Down. Only get alerted if there is an abnormal decrease in the tracked key indicator.
- Both. Get alerted if there is any abnormality in the data whether an increase or a decrease.
Specify the Trigger Type. A Monitor can have one critical, warning, and missing data trigger condition, each with one or more notification destinations. Triggers have different options depending on the query and alert type. Click the Expand button next to the query type you're using for configuration details.
- Logs Query
- Metrics Query

Trigger alerts on:
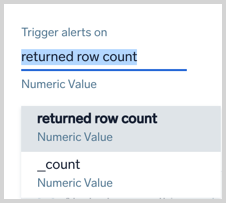
You can set the trigger based on the following:
returned row count (default): the number of rows returned from the log search.
A numeric field returned from the search. You can pick any numeric field from your query, and alert on the value of that field. The field is _count in the above screenshot. To convert a string to a number use the num operator. For example, if you have a field named duration you would use the num operator as follows to convert it to a number value.
| num(duration)
- Static detection method
- Outlier detection method
Trigger Type: Critical and Warning

Alert when returned row count is <threshold type> <threshold> within <time range>
| Parameter | Description |
|---|---|
| Threshold type | How you want the value compared. Select either greater than, greater than or equal, less than or equal, or less than. |
| Threshold | The value against which the trigger will be evaluated. You can specify any valid numeric value up to 1,000. |
| Time range | The duration of time to evaluate. Select either 5 minutes, 10 minutes, 15 minutes, 30 minutes, 1 hour, 6 hours, 12 hours, or 24 hours. |
Recover
Use the Infer recovery settings option to set the recovery to the opposite of the alert setting. The Alert must be checked for the option to be available.

For example, when the alert is set to > 10 the recovery would be set to \<= 10 when inferred.
Sumo Logic automatically resolves the incident when the resolution condition is satisfied.
Recover automatically when result is <threshold type> <threshold> for the selected time period
| Parameter | Description |
|---|---|
| Threshold type | How you want the value compared. Select either greater than, greater than or equal, less than or equal, or less than. |
| Threshold | The value against which the resolution will be evaluated. You can specify any valid numeric value. |
Trigger Type: Critical and Warning

Alert when result is greater than or equal to <threshold> standard deviations from baseline for <consecutive> consecutive out of <window> data points
| Parameter | Description |
|---|---|
| Threshold | The number of standard deviations for calculating violations. The default is 3.0. |
| Consecutive | The required number of consecutive indicator data points (outliers) to trigger a violation. |
| Window | The number of data points used to calculate the baseline for outlier detection. |
Recover
The recovery condition will always be the opposite of the alerting condition. For example, if there is no outlier identified for the duration of the detection window from the time the alert was first fired, then the Monitor will be brought back to the normal state. You cannot customize the resolution condition for the Monitor.
Trigger Type: Missing Data

Alert when missing data within <time range>
| Parameter | Description |
|---|---|
| Time range | The time span of data to evaluate. Select either 5 minutes, 10 minutes, 15 minutes, 30 minutes, 1 hour, 6 hours, 12 hours, or 24 hours. |
Recover
Automatically: Sumo Logic automatically resolves the incident when the resolution condition is satisfied.
Recover automatically when data becomes available for the affected time span.

- Static detection method
- Outlier detection method
Trigger Type: Critical and Warning

Alert when result is <threshold type> <threshold> <occurrence type> <time range>
| Parameter | Description |
|---|---|
| Threshold type | How you want the value compared. Select either greater than, greater than or equal, less than or equal, or less than. |
| Threshold | The value against which the trigger will be evaluated. You can specify any valid numeric value. |
| Occurrence type | The time condition you want for the trigger. Select either at any time within or continuously for. Choose continuously for if you want all the data points for the given metric to meet threshold conditions in a given time range, before triggering an alert. Alternatively, choose at any time within if you want to generate an alert when only a single data point meets the threshold condition for the given time range. |
| Time range | The duration of time to evaluate. Select either 5 minutes, 10 minutes, 15 minutes, 30 minutes, or 1 hour. |
Recover
Use the Infer recovery settings option to set the recovery to the opposite of the alert setting. The Alert must be checked for the option to be available.

For example, when the alert is set to > 10 the recovery would be set to \<= 10 when inferred.
Sumo Logic automatically resolves the incident when the resolution condition is satisfied.
Recover automatically when result is <threshold type> <threshold> for the selected time period
| Parameter | Description |
|---|---|
| Threshold type | How you want the value compared. Select either greater than, greater than or equal, less than or equal, or less than. |
| Threshold | The value against which the resolution will be evaluated. You can specify any valid numeric value. |
Trigger Type: Critical and Warning

Alert when result is greater than or equal to <threshold> standard deviations from baseline for <time range>
| Parameter | Description |
|---|---|
| Threshold | The number of standard deviations for calculating violations. The default is 3.0. |
| Time range | The duration of time to evaluate. Select either 5 minutes, 10 minutes, 15 minutes, 30 minutes, 1 hour, or 24 hours. |
Recover
The recovery condition will always be the opposite of the alerting condition. For example, if there is no outlier identified for the duration of the detection window from the time the alert was first fired, then the Monitor will be brought back to the normal state. You cannot customize the resolution condition for the Monitor.
Trigger Type: Missing Data

Alert when missing data <occurrence type> for <time range>
| Parameter | Description |
|---|---|
| Occurrence type | The time condition you want for the trigger. Choose either for all or for any. If you choose all you will get notified when all of the metrics meeting the query condition are not sending data in the given time range. Alternatively, you can choose any if you want to get notified when one of the metrics does not receive any data in the given time range. This option requires at least one initial data point and expires after 24 hours once triggered. |
| Time range | The duration of time to evaluate. Select either 5 minutes, 10 minutes, 15 minutes, 30 minutes, or 1 hour. |
Recover
Automatically: Sumo Logic automatically resolves the incident when the resolution condition is satisfied.
Recover automatically when data becomes available for the affected time span.
(Optional) Additional Settings has an Evaluation Delay setting. Collection delays may occur due to your environment and it takes a couple of minutes for data to be processed into Sumo Logic. Since Monitors run on data from the most current time period, it's possible for Monitors to evaluate against incomplete data. As a result, Monitors can generate false positives or negatives that can cause confusion. Set an evaluation delay in seconds to delay the evaluation of a Monitor, so it doesn't look at the most current time (where data can be incomplete) and instead looks at an older period of time, where you have more complete data.
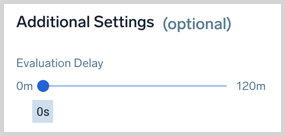
If your data is coming from the Amazon CloudWatch Source for Metrics we recommend a setting of 900 seconds.
(Optional) Set Notifications, when a trigger condition is met you can send notifications to other people and services. To add notifications click on the Add Notification button. You can add more than one notification channel for a Monitor.

Metric Monitors have an option to send notifications either as a group or separately. Group Notifications define whether you want single notifications per time series that match the Monitor query or you want group notifications where you receive a single notification for the entire Monitor. Log Monitors always group notifications.
The Connection Type specifies the notification channel where you want to get notified, such as an email or webhook. See Connections for details. Monitor notifications support variables to reference its configuration settings or your raw data. See alert variables for a table of the available variables.
- Email: Provide 1-100 recipient email addresses. You can customize the email subject and body.
- Webhook: By default, the payload defined on the Connection is used. You can customize your payload for each notification if needed.
Select the Alert and Recovery checkboxes for each trigger type based on when you want to send a notification. You can have different Trigger Conditions send a notification to different channels. For example, you can get notified on PagerDuty for critical Incidents and get an email or Slack notification for warning incidents.
:::tip See the Notifications section for details on alert and recovery notifications. :::
If your connection type is Lambda, Microsoft Teams, OpsGenie, PagerDuty, Slack, or a generic webhook the Recovery checkbox enables an automatic resolution process that updates the connection when an alert has recovered within Sumo Logic. Support for other connection types is coming soon.
Add Notifications to add additional notification channels as needed. You can configure different notifications for each trigger type, critical, warning, and missing data.
Enter a Name for the Monitor and the Location you want it saved to. A Description is optional.

Playbooks allow admins to codify tribal knowledge for an on-call so they know what exactly to do when they receive an alert. You have the option to provide a playbook when creating a Monitor, as shown in the below image. Markdown is supported.

Click the Save button at the top right of the panel when you're finished configuring the Monitor.