Explore a visual Kubernetes hierarchy
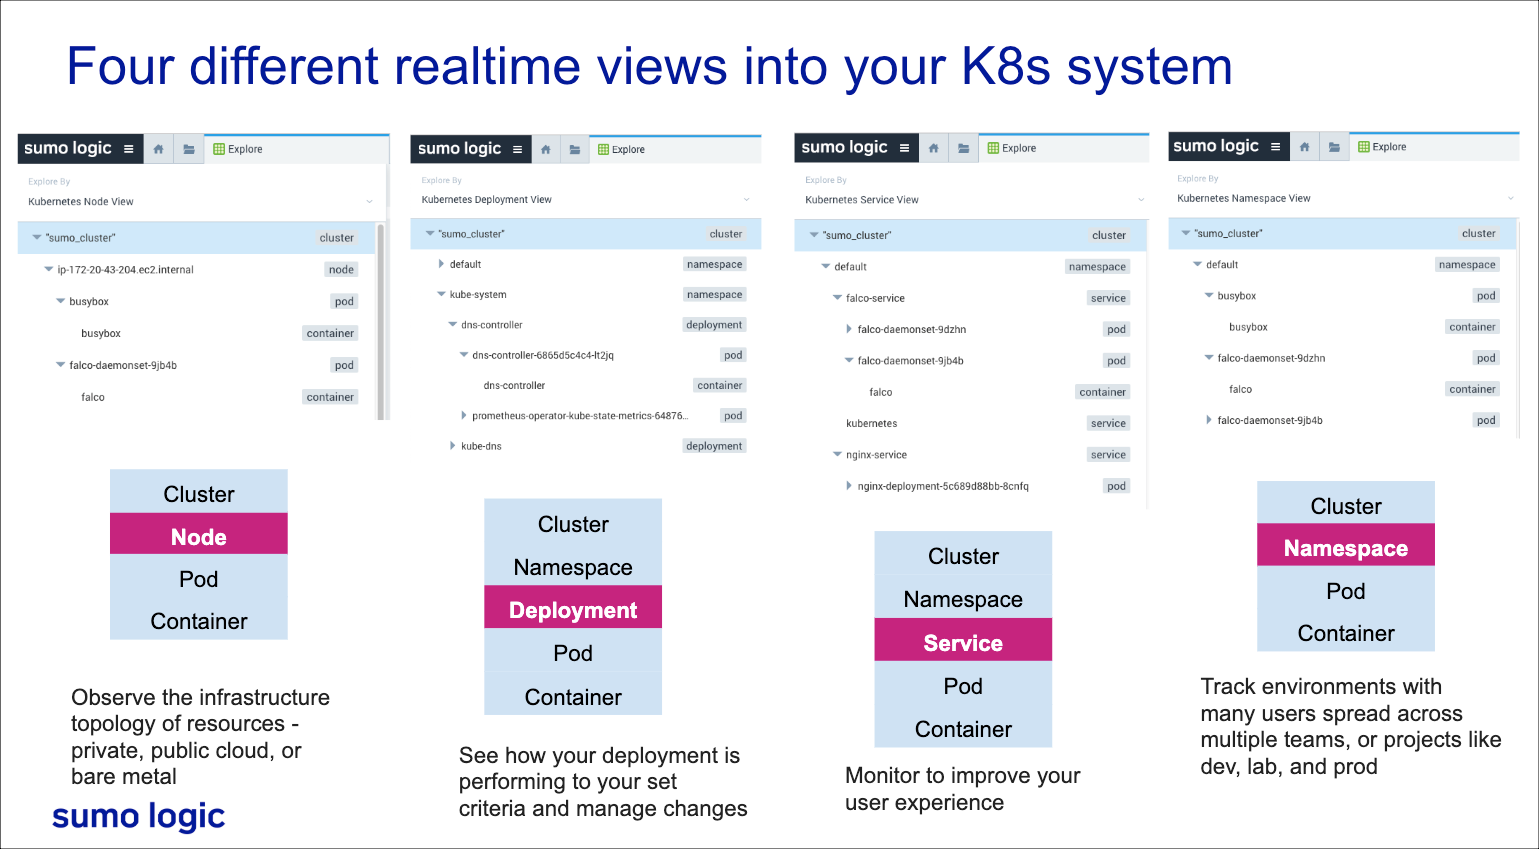
Explore is an intuitive navigational framework that provides a visual map of the hierarchy of your Kubernetes environment. It allows you to easily traverse the hierarchy and filter the display to focus on deployments, nodes, services, or namespaces. Explore accomplishes this by translating metadata fields into an easy to understand mental model so you can quickly check system states at various levels and proactively troubleshoot issues.

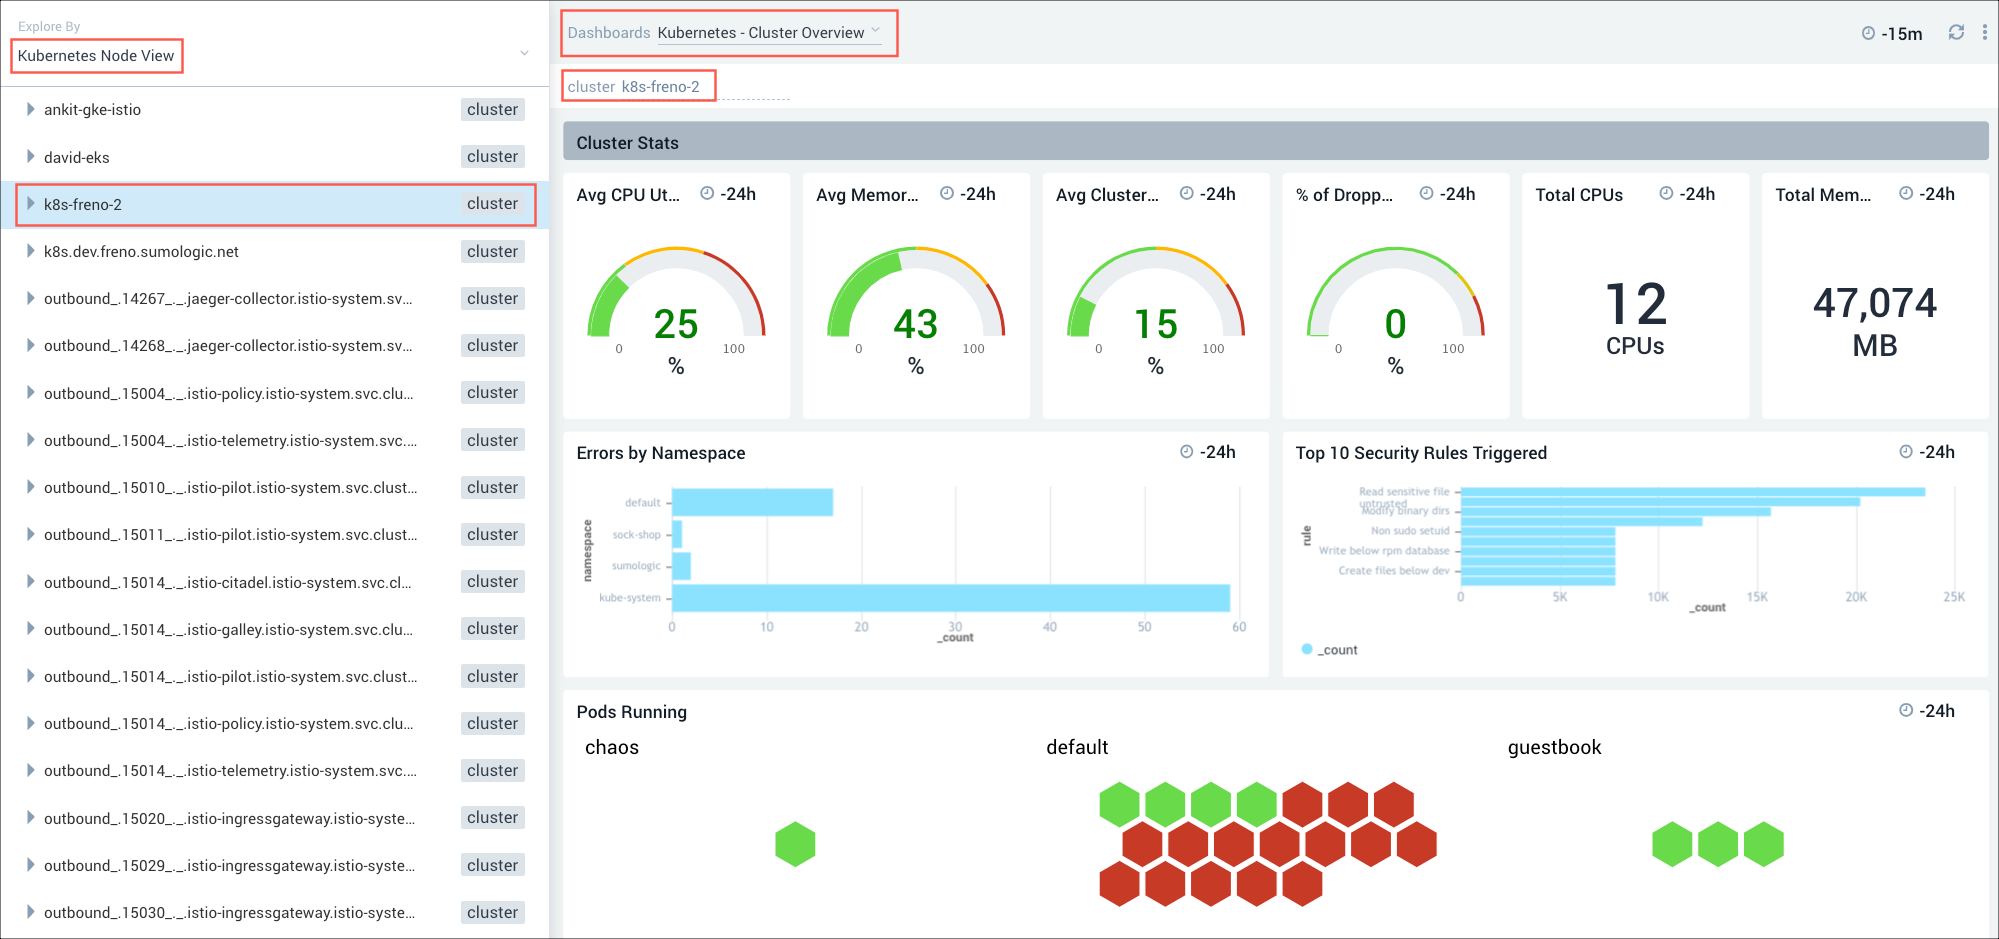
Health and performance data appears in the dashboard on the right for the view you are investigating: node, deployment, service, or namespace. The Sumo Logic Dashboard (New) framework is unique in its ability to show logs and metrics in a seamless integration with the same dashboard.
In the following example, we chose the Kubernetes Node View and selected the k8s-freno-2 cluster. We then selected the Kubernetes - Cluster Overview dashboard, for a high-level view of the health and performance of the cluster. For more information, go to Navigate your Kubernetes environment.

How metadata works
Metadata allows you to view your data in an intuitive mental model, as a visual representation of your Kubernetes environment within Sumo Logic. Explore uses metadata to unify metric and log streams with a centralized agent. The centralized agent has the ability to access multiple data streams across the platform with a common language comprised of metadata objects. Log and metric data are then displayed seamlessly in panels on the same dashboards.
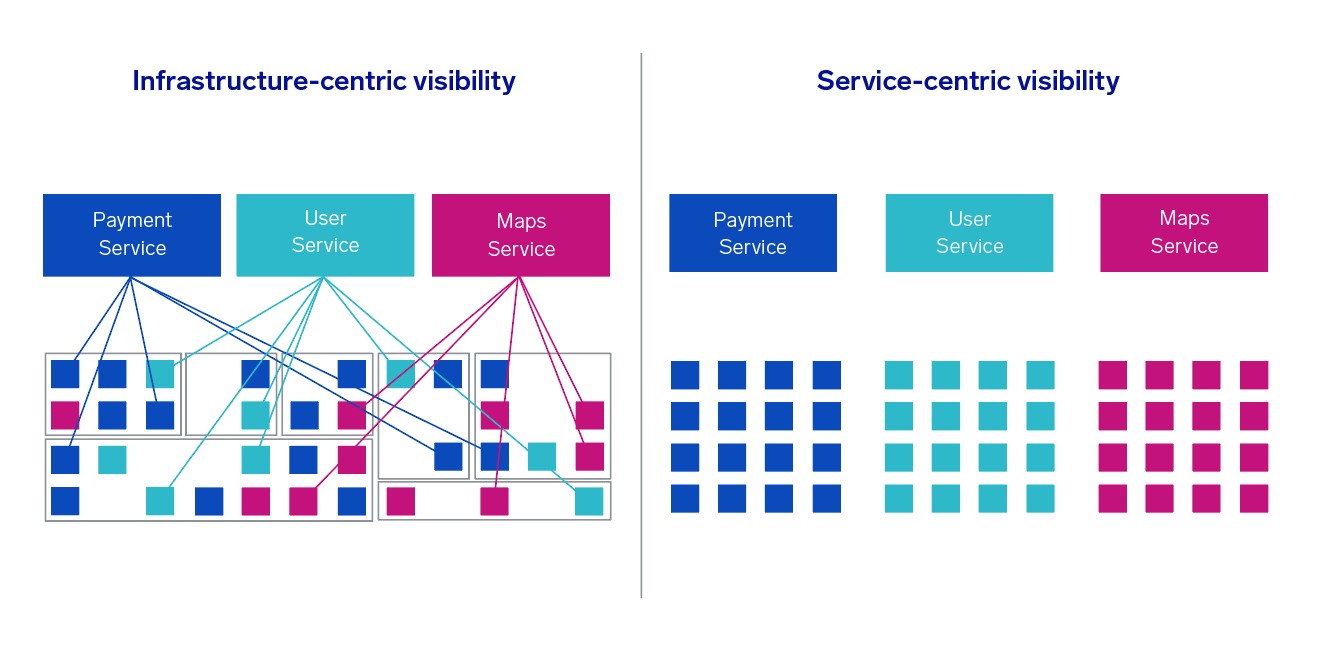
The following image illustrates the Explore intuitive "mental model" concept. The side-by-side views show a traditional infrastructure-centric model for visualizing service events on the left, and the Explore intuitive mental model for visualizing the data for the same service events on the right.
