Navigate your Kubernetes environment
This page shows you how to quickly access Explore and navigate your Kubernetes environment. As you navigate, data for your selection is shown in the dashboard on the right. Metric and log data is viewable on the same dashboard in one integrated, seamless view.
Open Explore
Explore is an out-of-the-box Sumo Logic view that you can use to navigate a visual representation of your Kubernetes stack.
To open Explore, do the following:
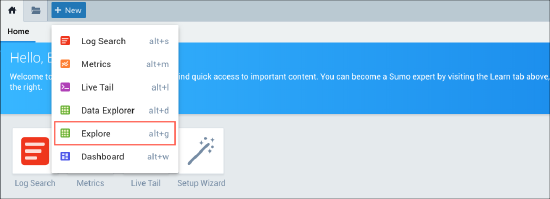
Log in to Sumo Logic and click + New on the top menu bar.
From the drop-down menu, choose Explore.
The Explore navigation panel appears on the left with a collapsed view of your Kubernetes stack.
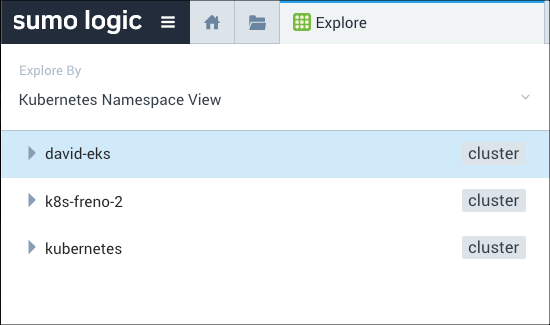
- If this is your first time using Explore, the window at the right will be empty.
- If you have already installed a Sumo Logic App for Kubernetes, a dashboard displaying data for the selected deployment appears on the right. For instructions on installing the Sumo Logic Kubernetes App, see the Kubernetes Solution help pages.
Now you can navigate your Kubernetes environment and analyze the landscape.
Navigate and analyze the Kubernetes landscape
Explore provides a framework of Views that allow you to quickly navigate through your Kubernetes environment and assess the landscape of the hierarchy. The navigation panel on the left shows a list of all your clusters with the namespaces, containers, and pods nested underneath each cluster.
To navigate Kubernetes environment and analyze the landscape, do the following:
- At the top of the navigation panel, click Explore By to expand the menu and make a selection for the top level hierarchy. The contents of your selection appear below.
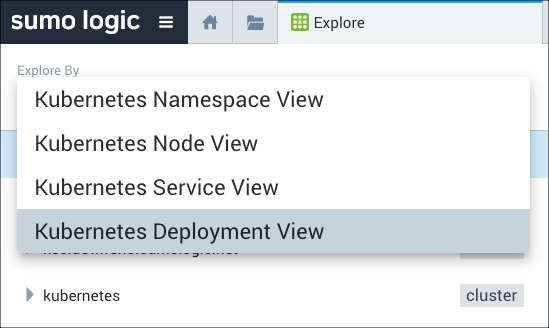
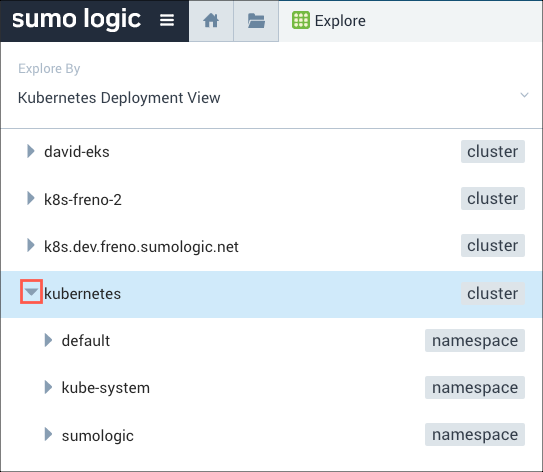
Click the arrow to the left of a content name to expand and view its contents.
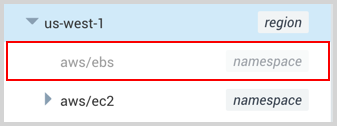
Dead entities are shown faded:
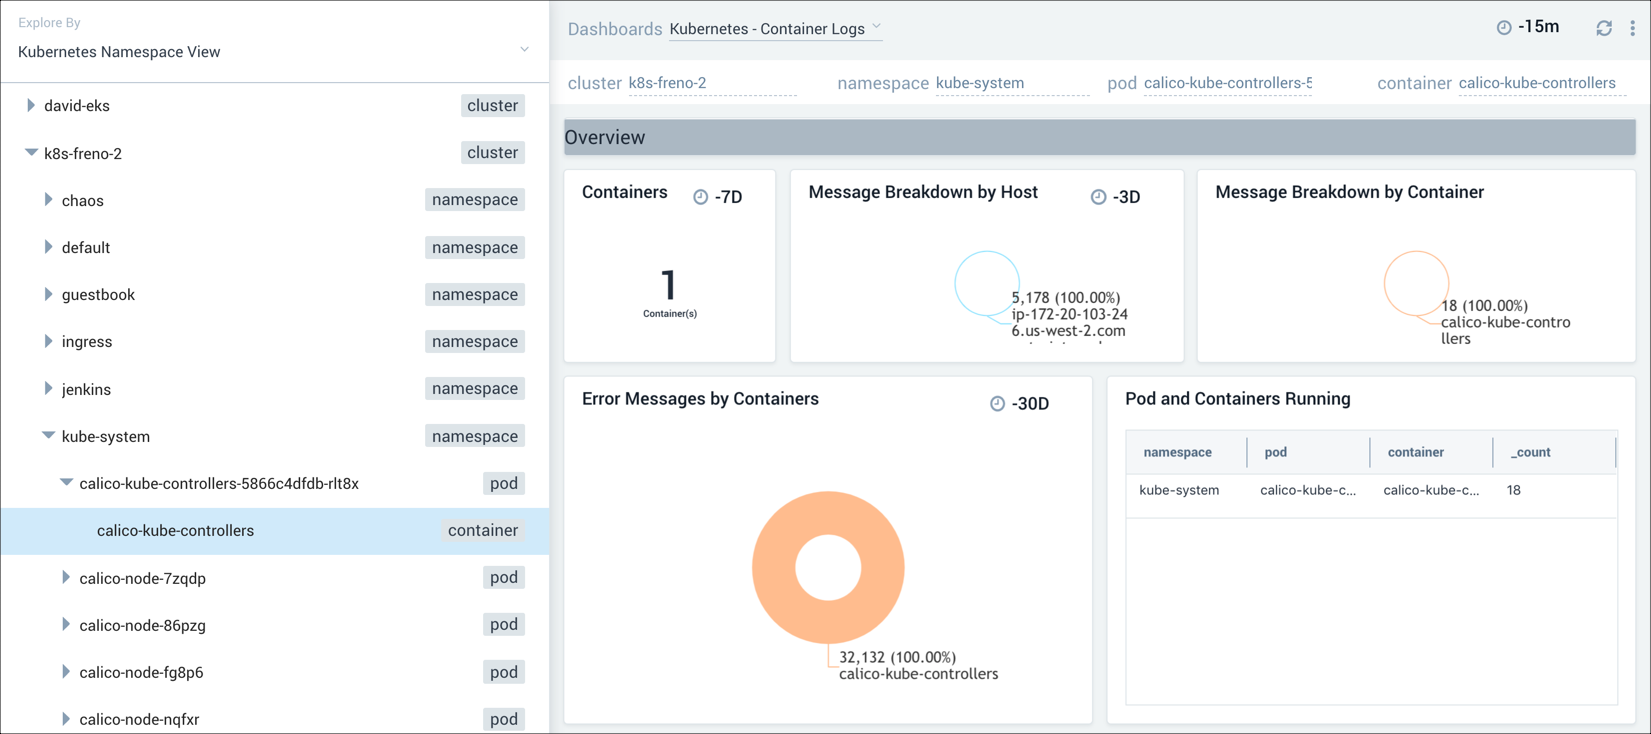
Drill-down into the clusters to view the pods and containers. The data for your selection is displayed in the panels of the dashboard on the right.
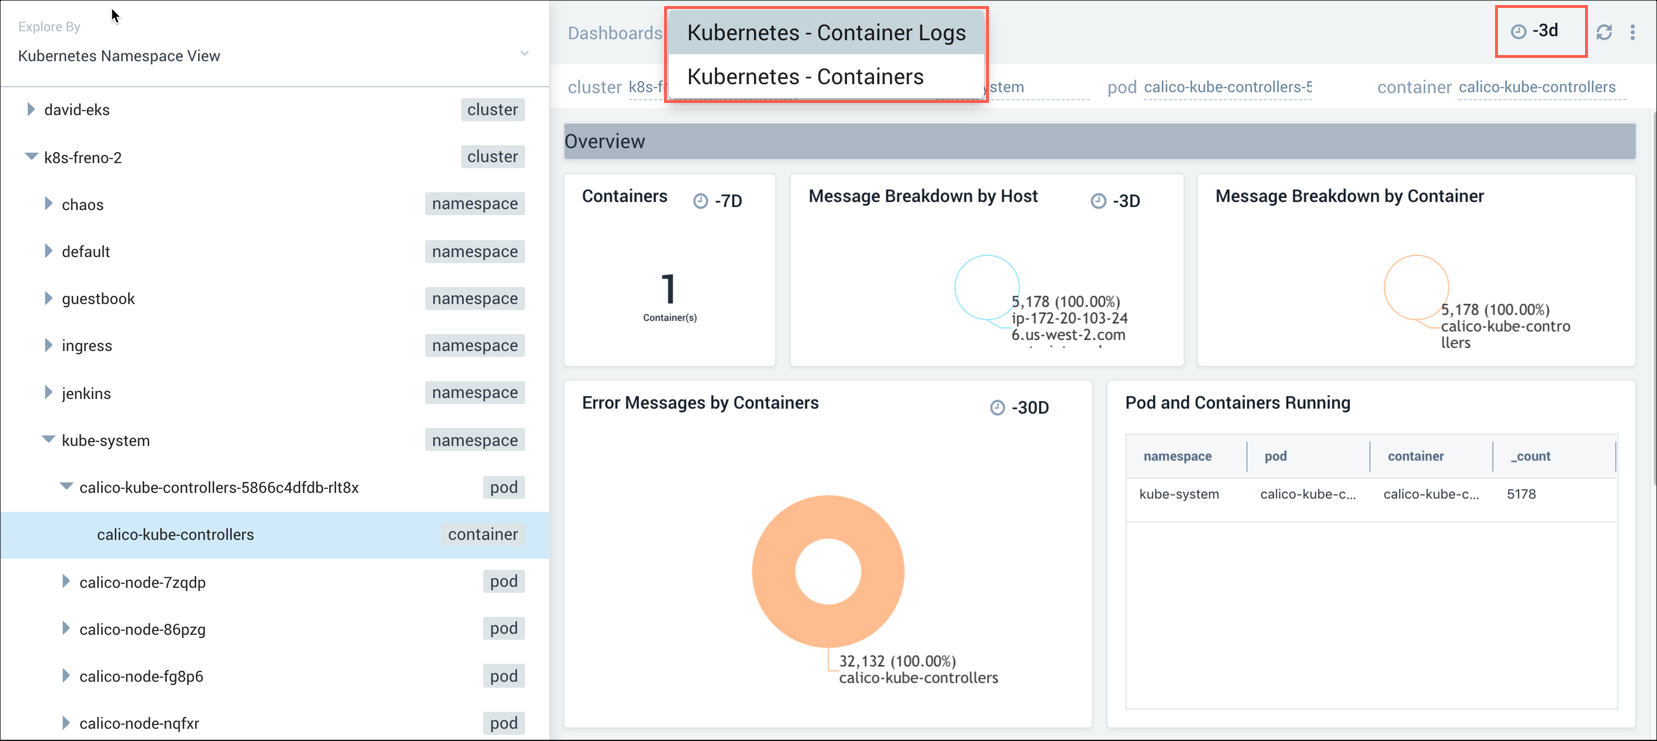
Optional: Select another type of dashboard display from the drop-down menu at the top of the dashboard, and select another time interval.
Drilling into related content
Sumo Logic provides relevant log searches and dashboards to consider investigating, as well as other locations with relevant content. This facilitates quickly discovering the root cause and devising a plan of action.
To discover and view related content, do the following:
Select the graph data point you are interested in. In the following screenshot, we selected a cell in a honeycomb chart. A panel appears on the right of the window with details and a list of related content links.
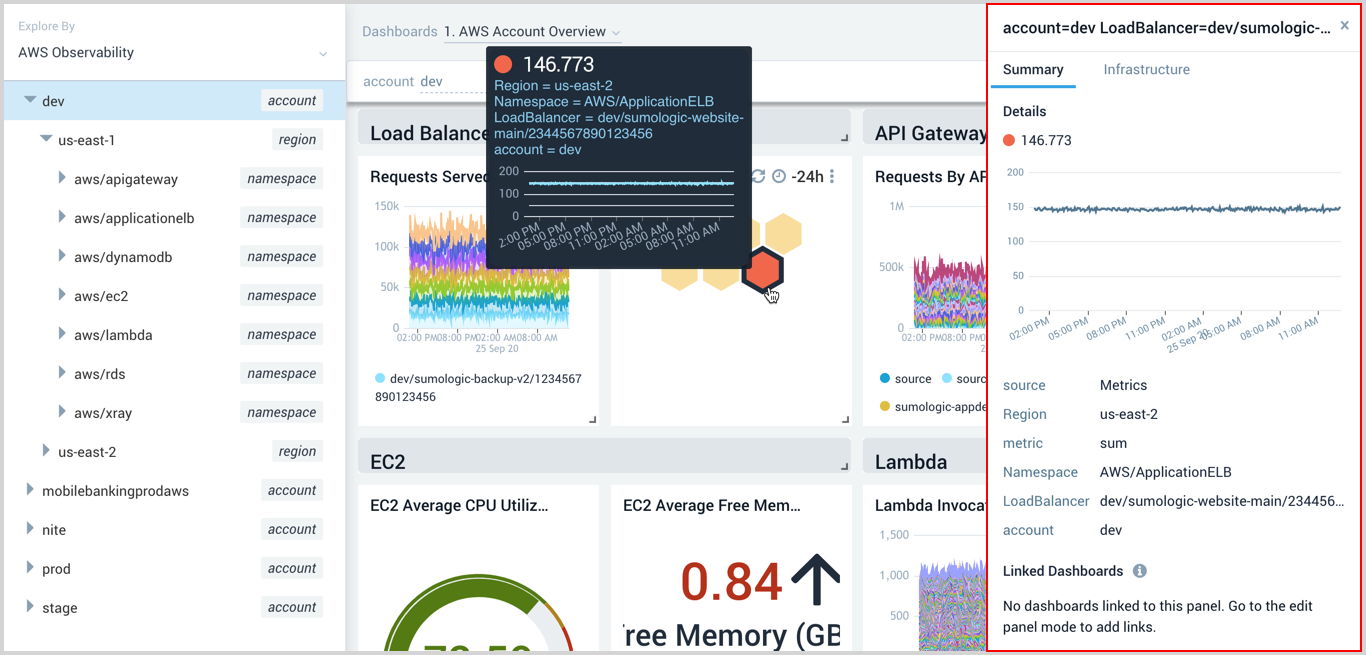
Summary tab
Select links from the Summary tab to go directly to:
- Linked Dashboards
- Recommended Dashboards - Currently, only dashboards from the Kubernetes App are supported.
Infrastructure tab
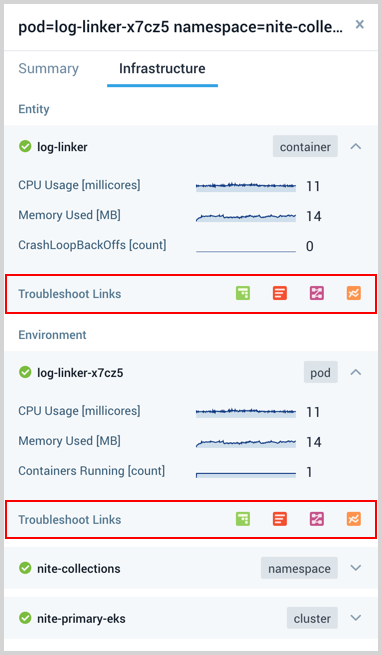
The Infrastructure tab provides the following Troubleshooting Links for related Entities and Environments. To investigate, click an icon to launch another feature against the entity or environment. An icon is not available if it's irrelevant.
Explore
Logs
Traces
Metrics
