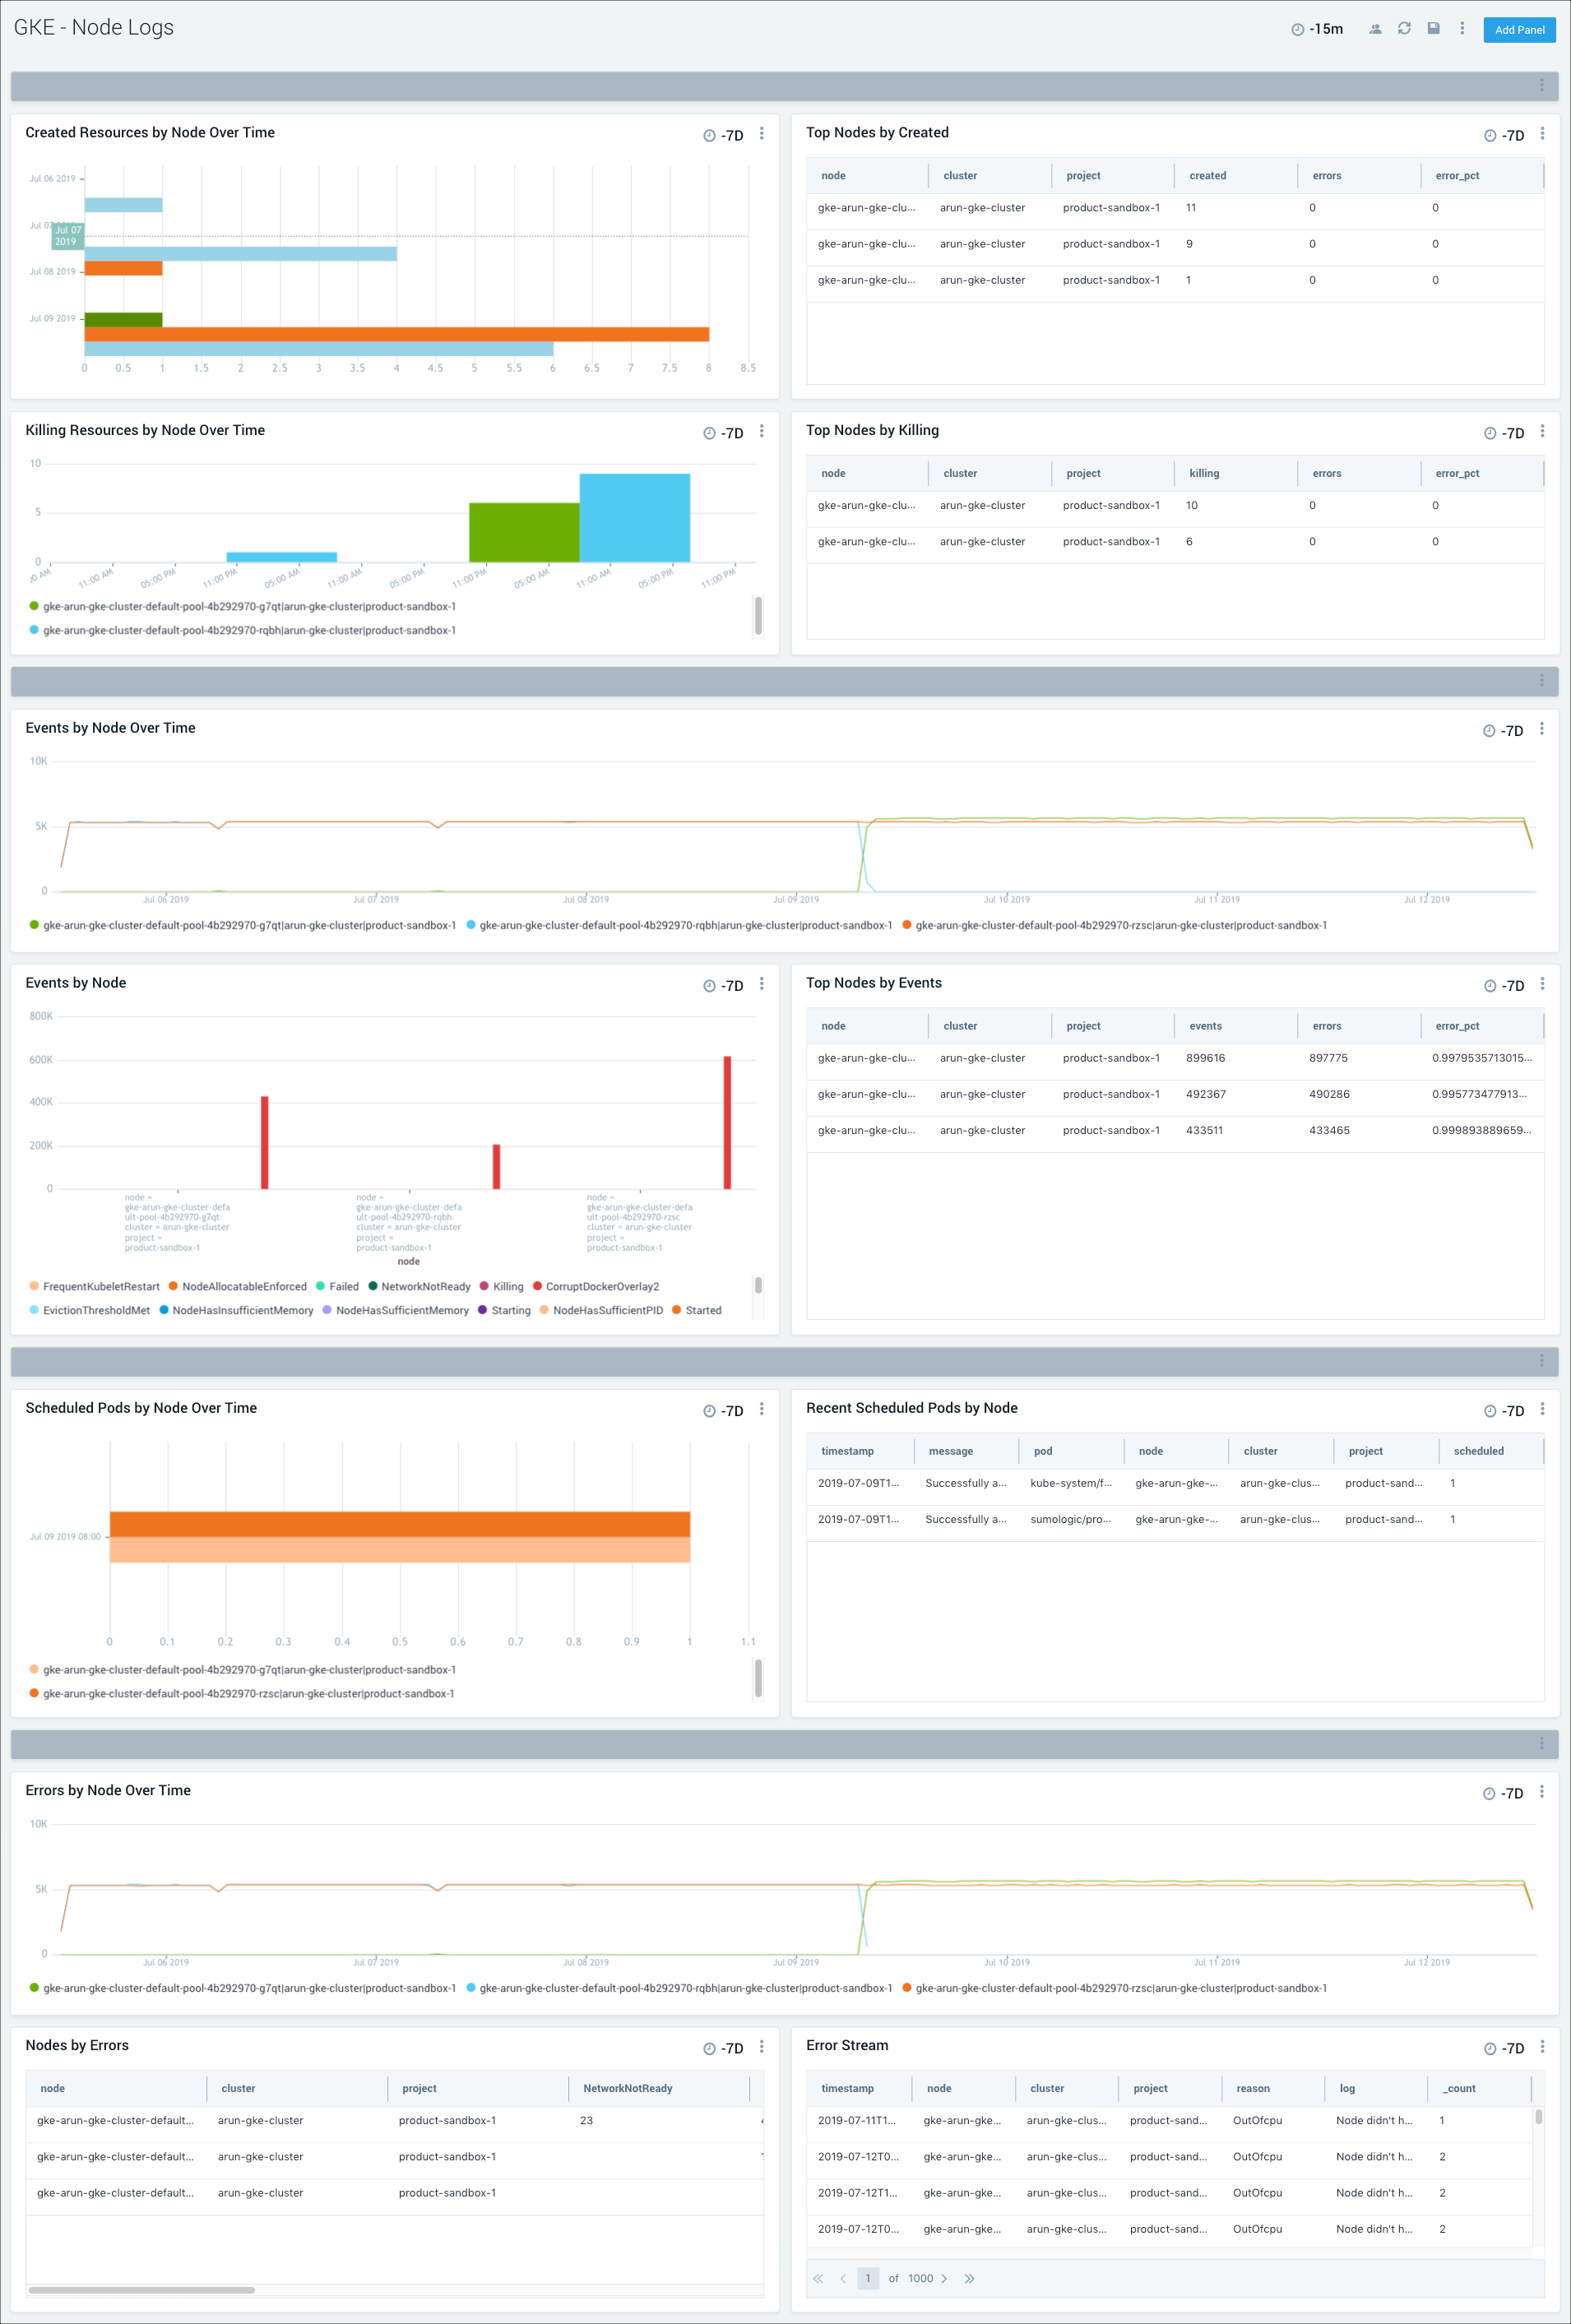
View Sumo Logic Kubernetes App Dashboards
Sumo Logic combines metrics, logs, and events to a create real-time unified view of the performance, uptime, and security of your Kubernetes environment, The Sumo Logic Kubernetes Solution leverages the standards endorsed by the Cloud Native Computing Foundation (CNCF), and utilizes the extensive ecosystem of existing integrations for monitoring and troubleshooting Kubernetes platforms.
Sumo Logic utilizes consistent tagging across logs, metrics, events, and security data, resulting in the centralization of enrichment data throughout your Kubernetes environment. Consistent tagging enables administrators to correlate data for metrics, logs, and events for their applications. They can then view the results in Sumo Logic App pre-defined dashboards for analysis and troubleshooting.
Kubernetes features
Sumo Logic allows administrators to monitor and troubleshoot their applications in Kubernetes using an intuitive mental model, rather than a server-based focus. From the Explore tab, you can intuitively filter on any of four hierarchical Views of your Kubernetes system: Node, Deployment, Service, and Namespace.
Sumo Logic Kubernetes Views make it easier to traverse your Kubernetes hierarchy to monitor specific components, identify problems, discover root problems, and take progressive action.
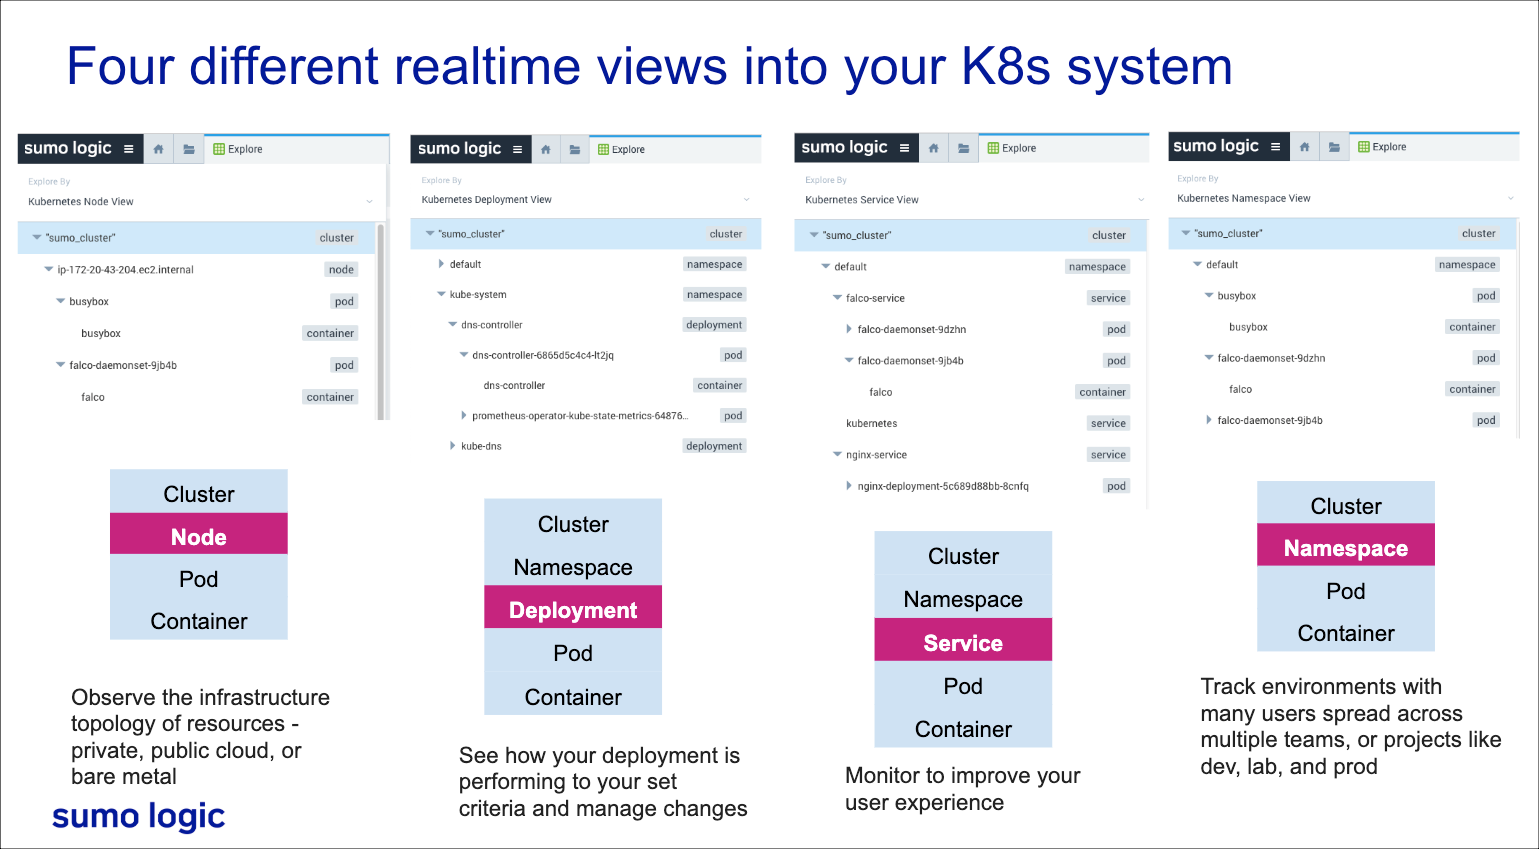
Sumo Logic auto-discovers the state of your Kubernetes environment and provides dynamic dashboards that update in real-time with incoming data. As your Kubernetes environment changes with new services, dashboards adjust automatically without any configuration changes. Sumo Logic is a security platform that incorporates security data into Kubernetes app dashboards for visibility across networks, applications, and Kubernetes clusters.
Kubernetes Cluster App Benefits
Sumo Logic provides a selection of Kubernetes cluster apps for almost any platform and environment.
- Kubernetes App—Provides visibility into the operations and security of the worker nodes in a cluster, as well as the application logs of the worker nodes. One Kubernetes App can monitor multiple clusters, utilizing Falco events to detect abnormal container, application, host, and network activity. This app is generally recommended to be used in conjunction with the Kubernetes Control Plane App, depending on your deployment.
- Kubernetes Control Plane App—Monitors the master node control plane, including the API server, etc, kube-system, and worker nodes. The App utilizes Falco Kubernetes Audit events to monitor and detect notable or suspicious activity, such as creating pods that are privileged, mounting sensitive host paths, using host networking, and the like.
- AKS, EKS, and GKE Control Plane Apps—Provide insights into the master node or vendor-specific control plane, including the API server, control manager, kube-scheduler, etc, and kube-system.
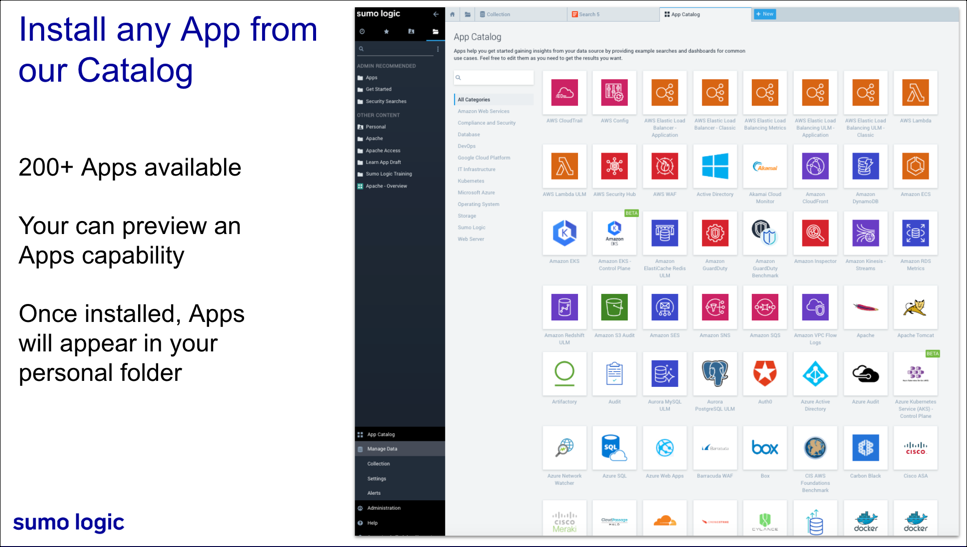
Sumo Logic Kubernetes App
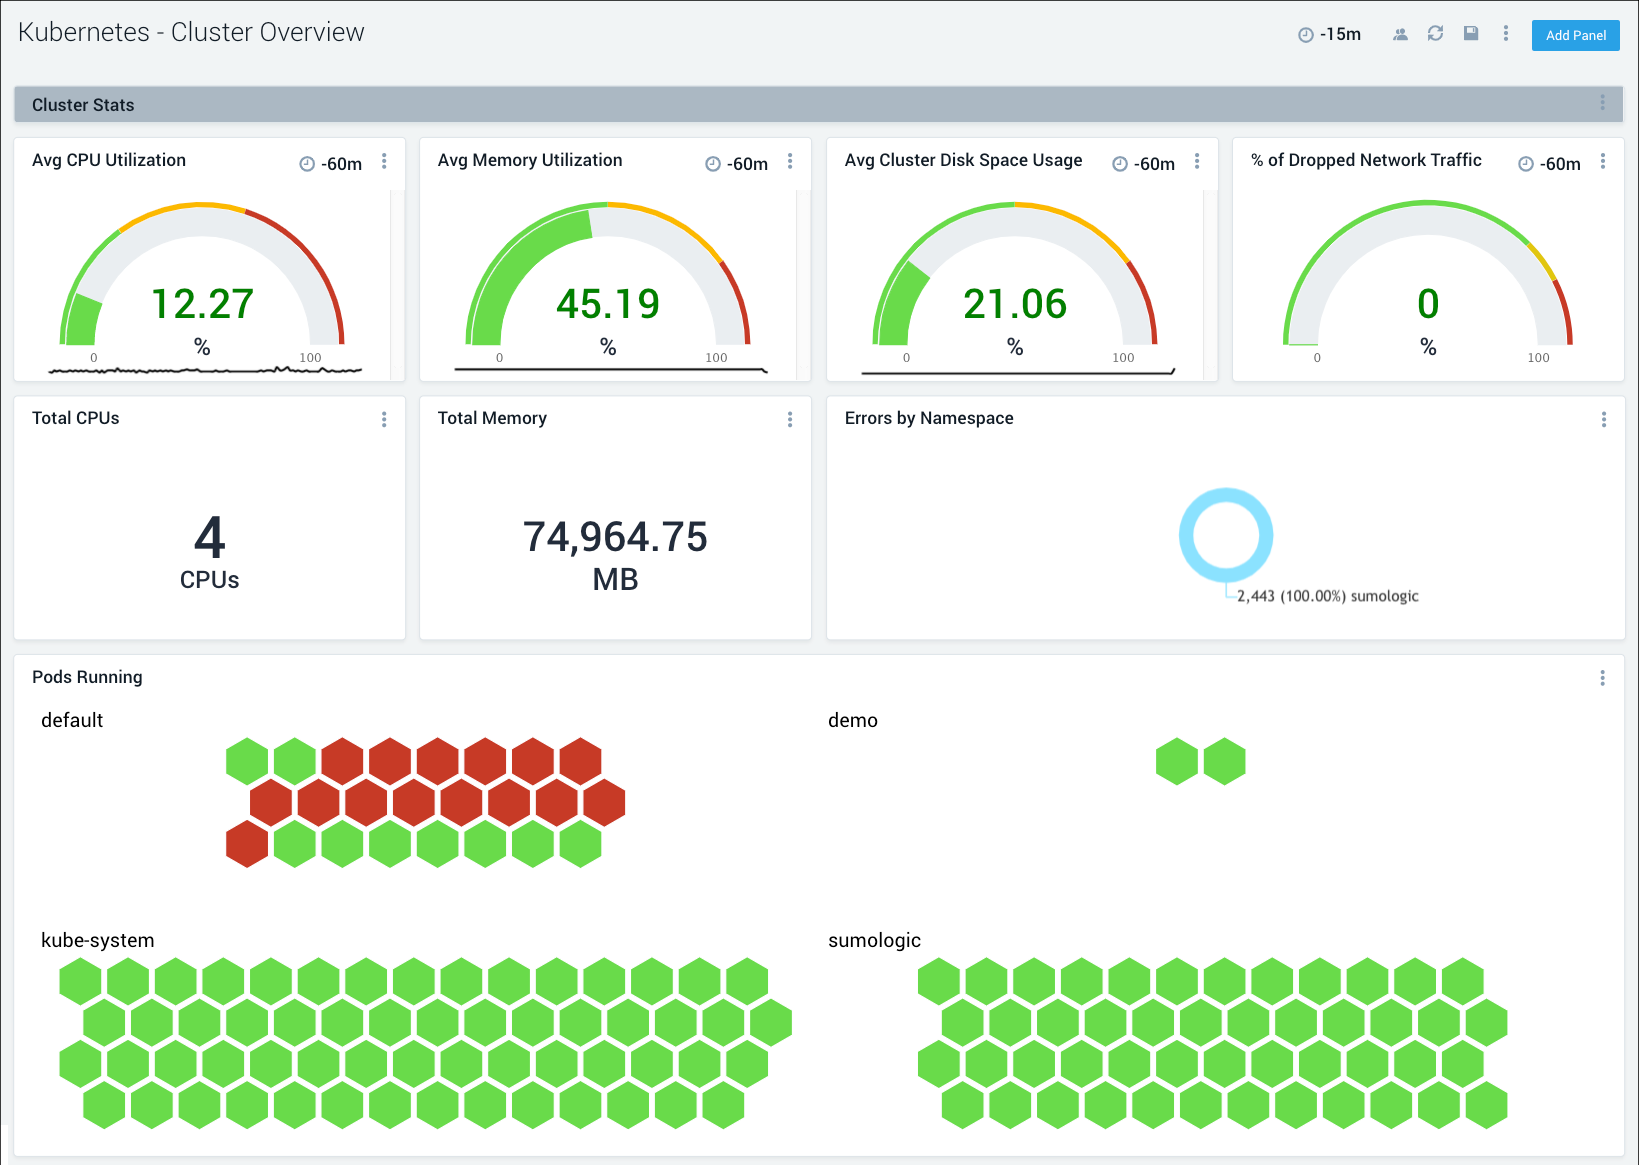
The Sumo Logic Kubernetes App provides visibility into the worker nodes that comprise a cluster, as well as application logs of the worker nodes. The App is a single-pane-of-glass through which you can monitor and troubleshoot container health, replication, load balancing, pod state, and hardware resource allocation. The App also integrates with Falco, an open source container native runtime security tool to monitor and detect anomalous container, application, host, and network activity. This app works in conjunction with the Sumo Logic Apps for the Kubernetes Control Plane, AKS Control Plane, GKE Control Plane, and EKS Control Plane apps to provide visibility into the control plane, including the API server, scheduler, and controller manager.
The following dashboard is an example of one of the many pre-configured dashboards you can access with the app to view and analyze data from your Kubernetes environment.
Sumo Logic Kubernetes Control Plane App
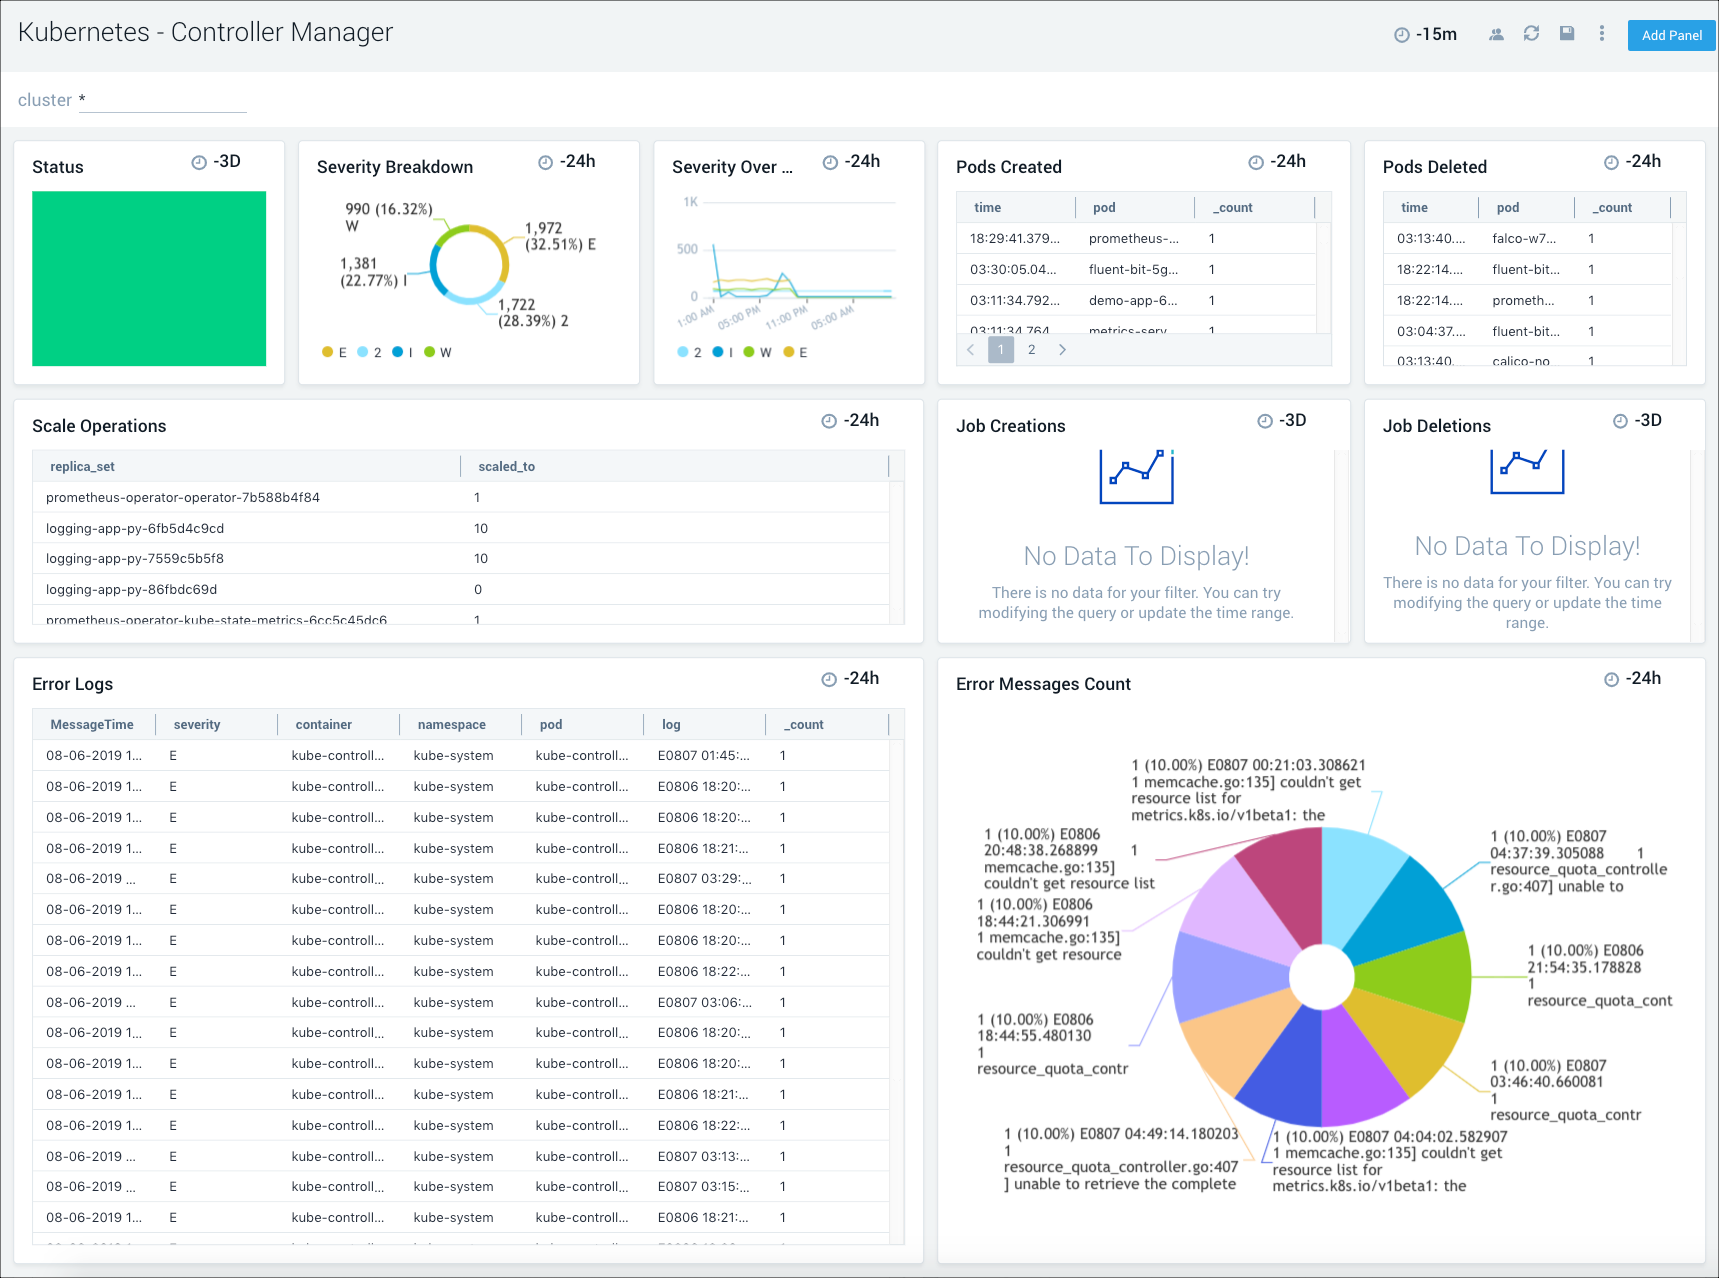
The Sumo Logic Kubernetes Control Plane App manages the master node control plane, including the API server, etcd, kube-system and worker nodes. The App utilizes Falco Kubernetes Audit events to monitor and detect notable or suspicious activity such as creating pods that are privileged, mount sensitive host paths, use host networking, and the like. Seamlessly integrated with the Sumo Logic Kubernetes App, pre-configured dashboards display resource-related metrics for Kubernetes deployments, clusters, namespaces, pods, containers, and daemonsets.
The following dashboard is an example of one of the many pre-configured app dashboards you can access to view and analyze data from your Kubernetes environment.
Amazon EKS - Control Plane
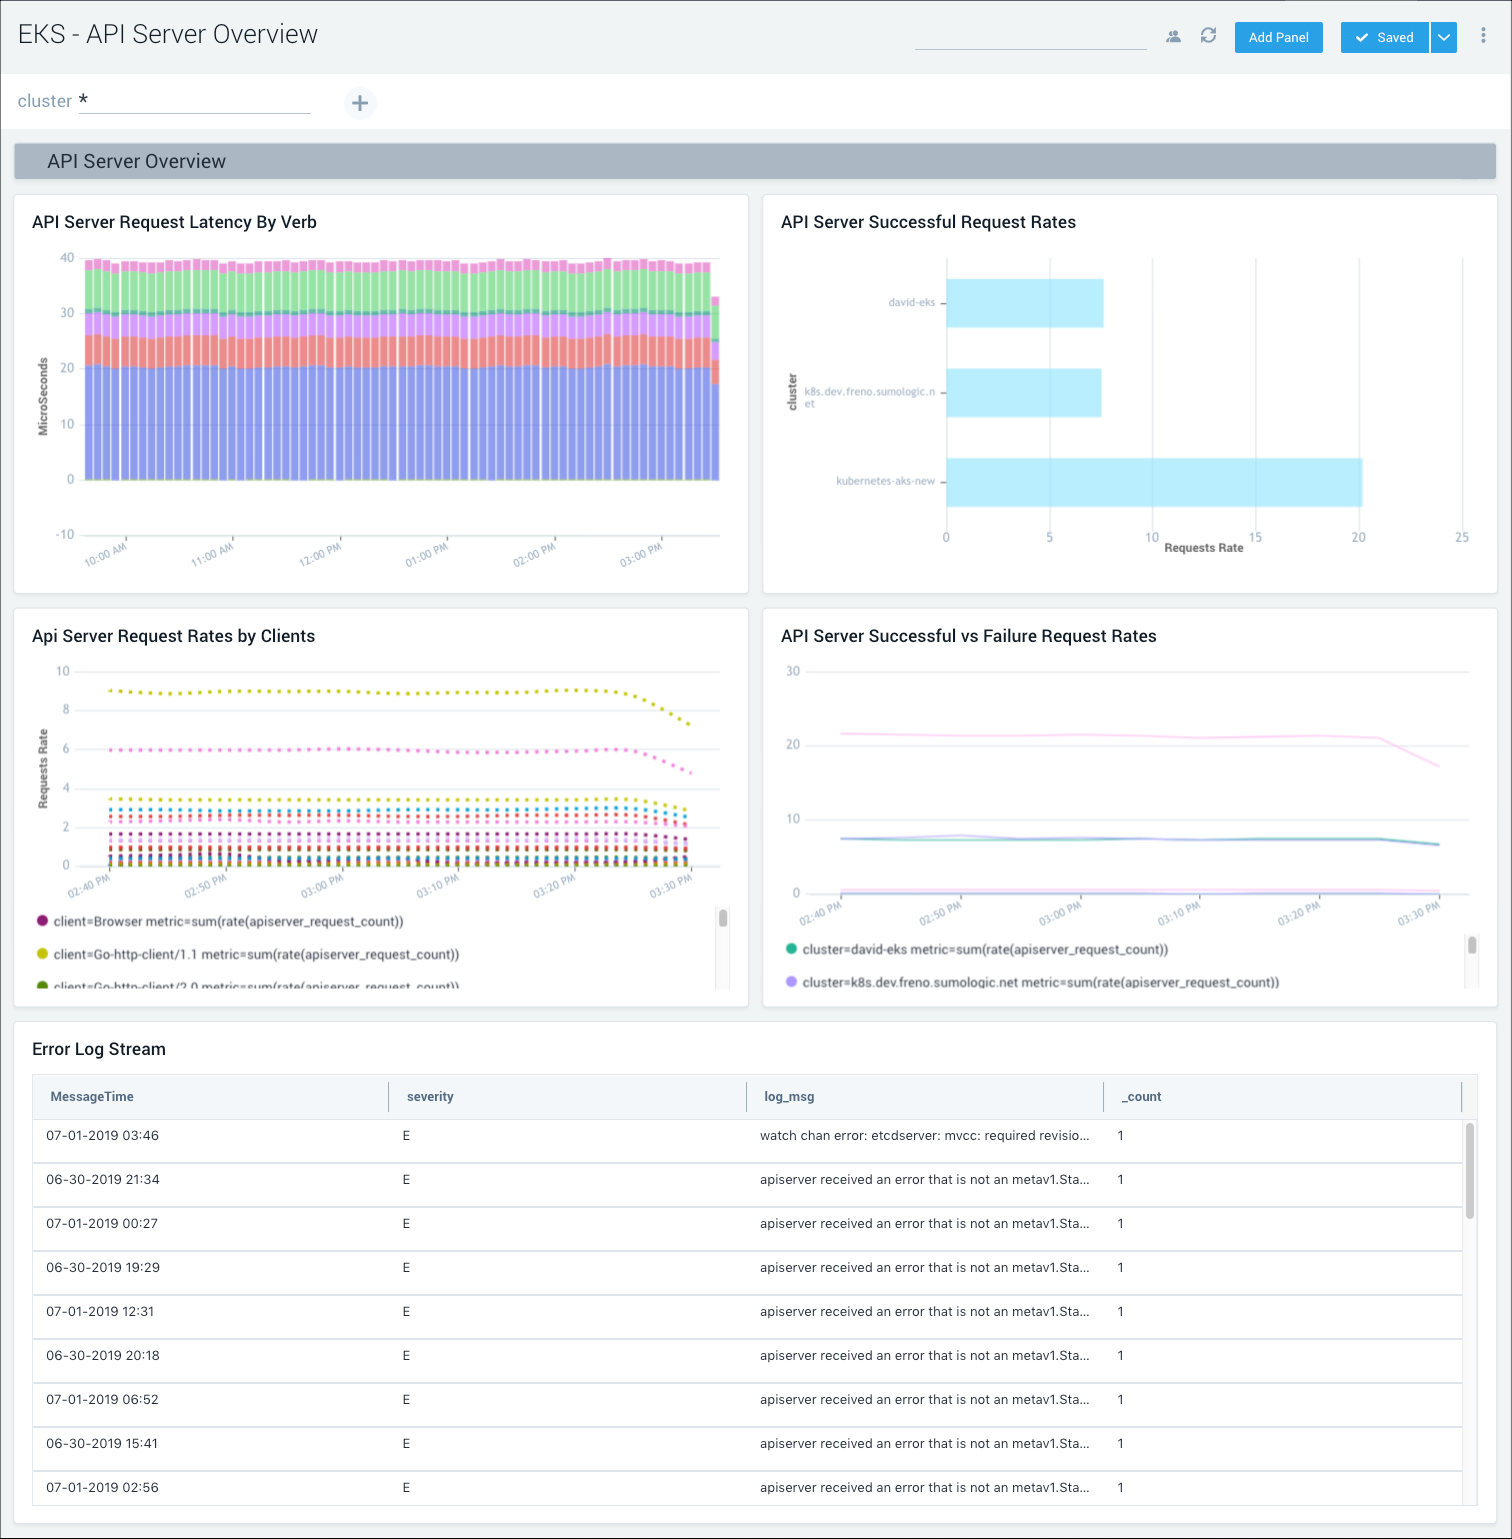
The Sumo Logic App for Amazon EKS - Control Plane provides visibility into the EKS control plane with operational insights into the API server, scheduler, control manager, and worker nodes. The app’s pre-configured dashboards display resource-related metrics for Kubernetes deployments, clusters, namespaces, pods, containers, and daemonsets. This app works in conjunction with Sumo Logic Kubernetes app that provides visibility into worker node metrics and application logs.
The following dashboard is an example of one of the many pre-configured app dashboards you can access to view and analyze data from your Kubernetes environment.
Azure Kubernetes System (AKS) - Control Plane
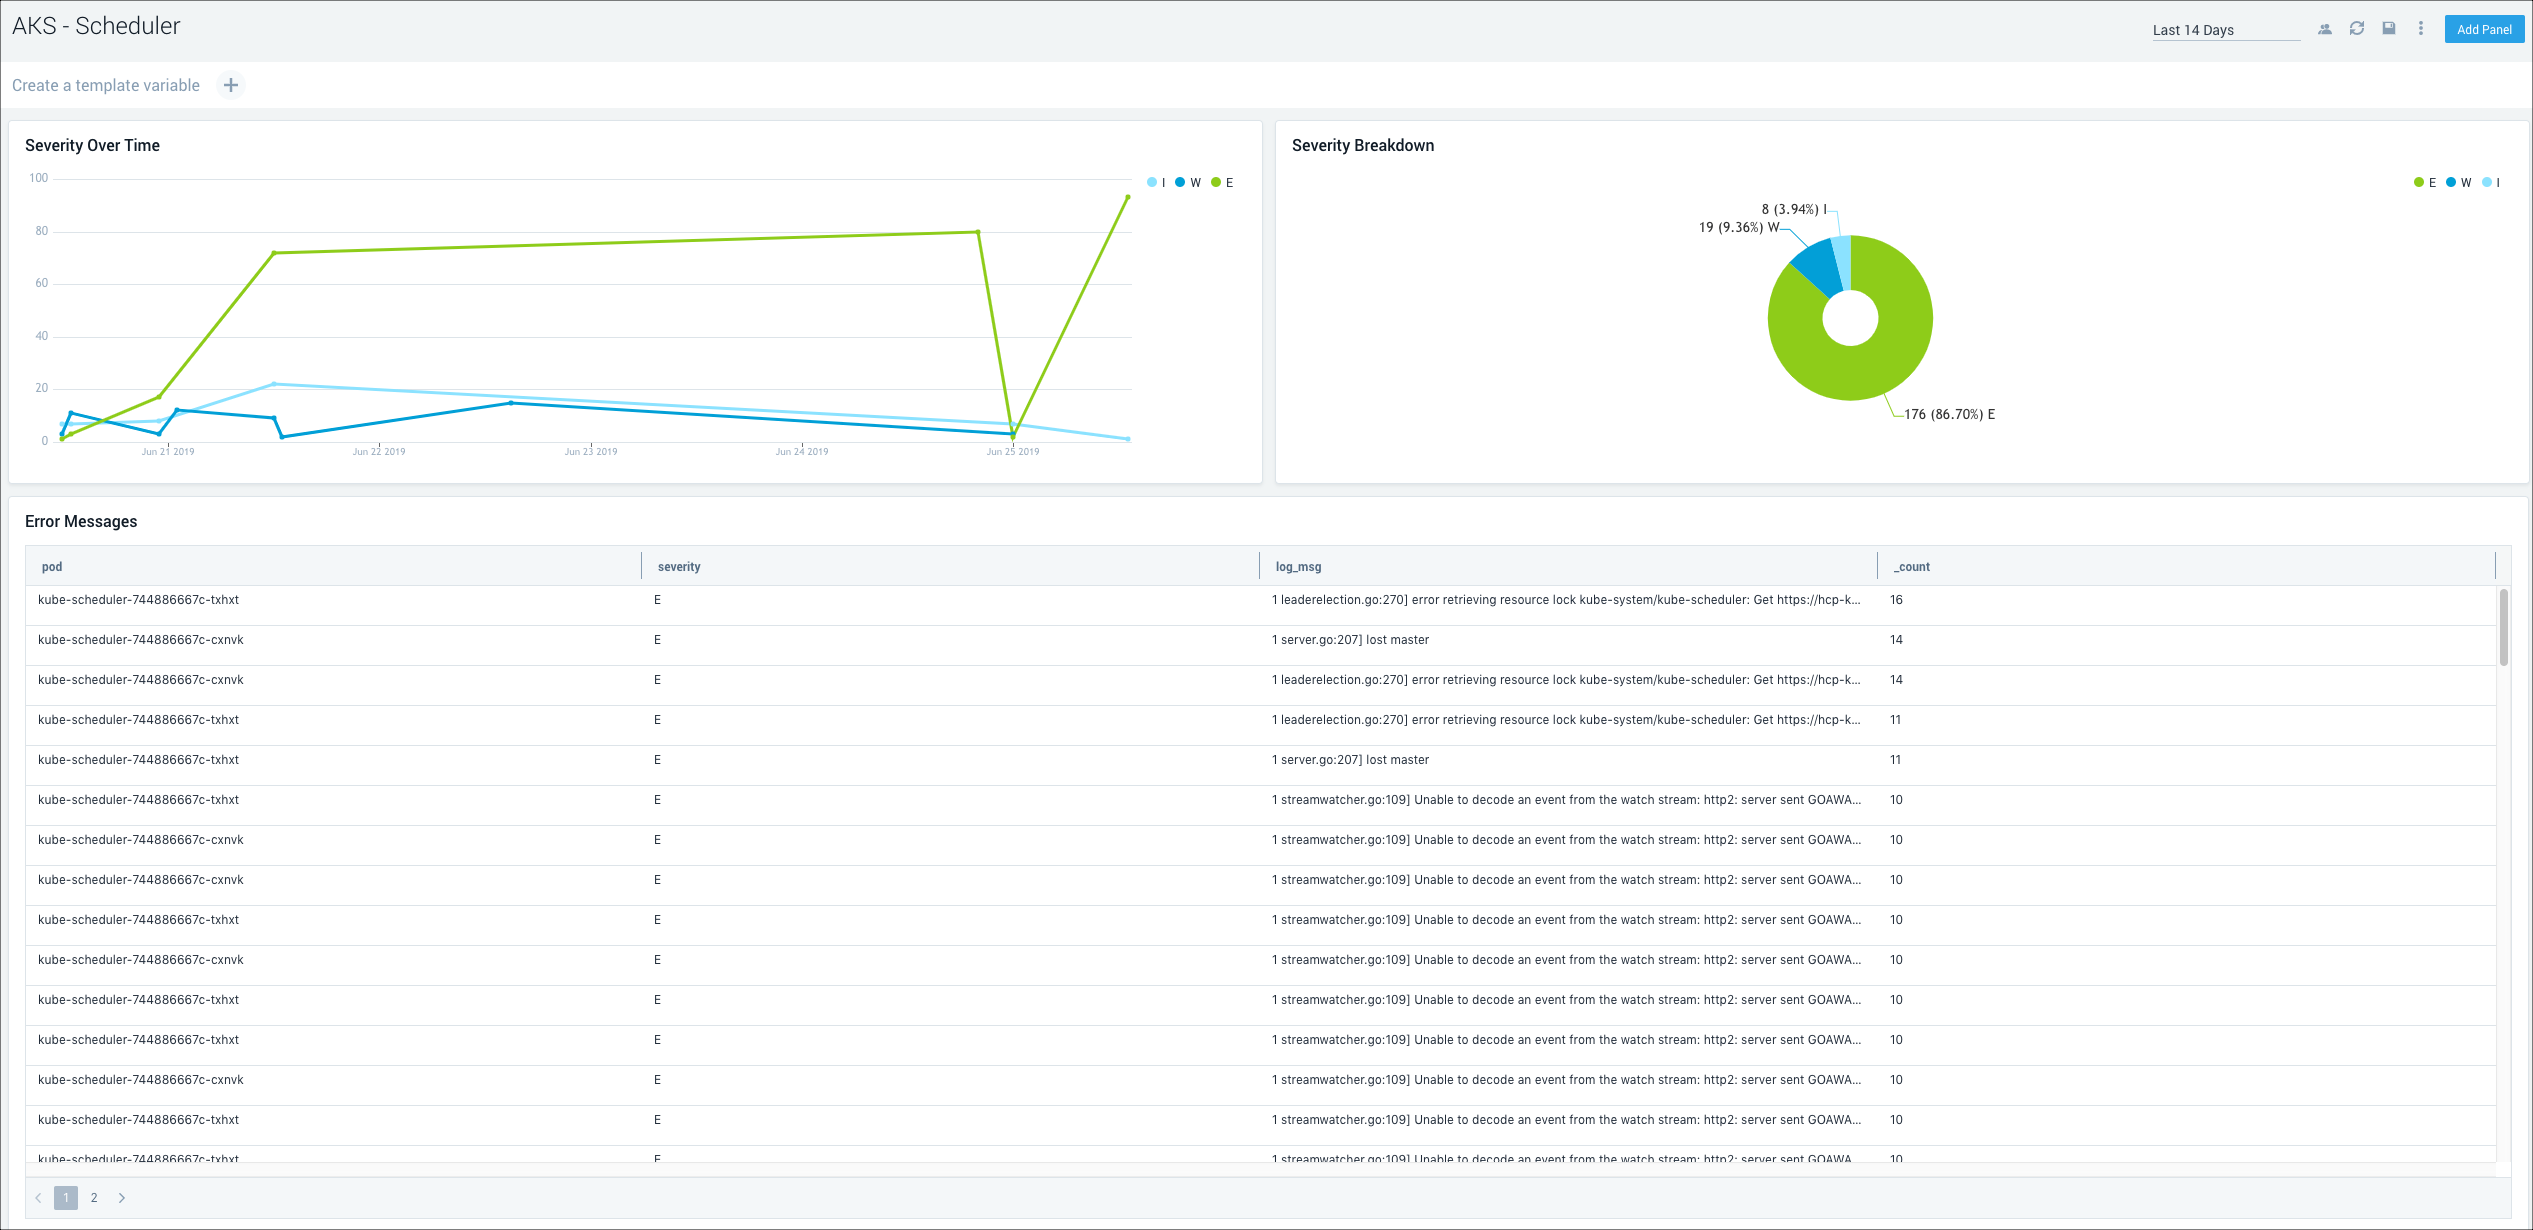
The Sumo Logic App for Azure Kubernetes Service (AKS) - Control Plane provides visibility into the AKS control plane with operational insights into the API server, scheduler, control manager, and worker nodes. The pre-configured app dashboards display resource-related metrics for Kubernetes deployments, clusters, namespaces, pods, containers, and daemonsets. This app works in conjunction with Sumo Logic Kubernetes app that provides visibility into worker node metrics and application logs.
The following dashboard is an example of one of the many pre-configured app dashboards you can access to view and analyze data from your Kubernetes environment.
Google Kubernetes Engine (GKE) - Control Plane
The Sumo Logic App for Google Kubernetes Engine (GKE) - Control Plane allows you to monitor resource-related logs and metrics for Kubernetes deployments, clusters, namespaces, pods, containers, and daemonsets. The App provides visibility into the GKE control plane with operational insights into the API server, control manager, and worker nodes. This app works in conjunction with Sumo Logic Kubernetes app that provides visibility into worker node metrics and application logs.
The following dashboard is an example of one of the many pre-configured app dashboards you can access to view and analyze data from your Kubernetes environment.
