bin
The bin operator assigns output results to user defined bins. A bin is configured to hold a range of values that can be used for sorting results in a histogram and further aggregation. It is a quick and effective way to visualize the distribution of data.
Syntax
bin <numeric field> width=<#>[, min=<#>][, max=<#>]
Where:
<numeric field>is the field you want to assign to bins. The data type needs to be numerical. Required.<width>is the bin width as a floating point number. Required.<min>is the lower boundary of the results as a floating point number. All data points with values less than the min are assigned to the first bin. Optional.<max>is the upper boundary of the results as a floating point number. All data points with values more than the max are assigned to the last bin. Optional.
Output Fields
_bin_labelis the default alias field, which has a standard interval representation._bin_loweris the lower boundary of the bin interval._bin_upperis the upper boundary of the bin interval.
tip
You can sort by the lower or upper boundary of the bin interval.
Examples
Distribution of error counts
A query counting error messages and using the bin operator to see the distribution of error counts based on bins with a width of 100:
_sourceCategory=stream error
| timeslice 1m
| count by _timeslice
| bin _count width=100.0
| count by _bin_label, _bin_lower
| sort by _bin_lower

Latency distribution
A query parsing the latency of a function call and using the bin operator to see latency distribution over time:
_sourceCategory=analytics
| parse "ms: *" as time
| bin time width=10.0, min = 0.0, max = 500.0
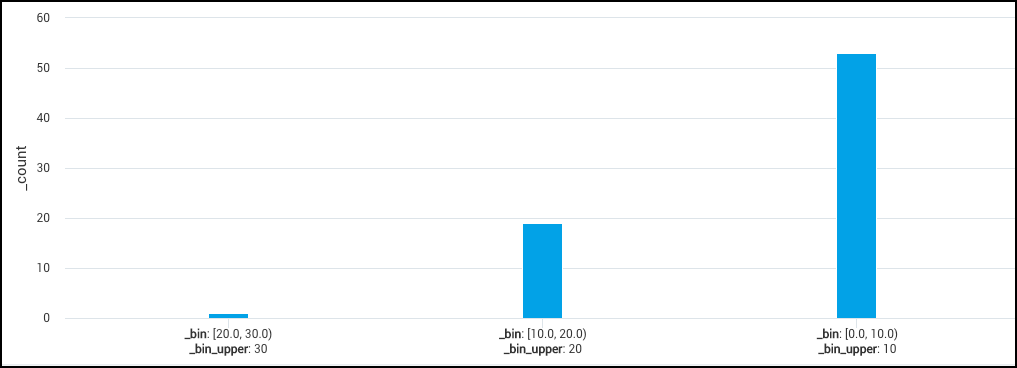
You can aggregate bins further:
_sourceCategory=analytics
| parse "ms: *" as time
| bin time width=10, min = 0, max = 500
| count by _bin_label, _bin_upper
| sort by _bin_upper
