Add a Metrics Visualization to a Dashboard
You can add a metrics visualization as a panel in a dashboard.
This topic has information about Sumo Logic's Classic metrics UI. For information about the Metric Explorer UI, which replaces the Classic metrics UI, see Metrics Explorer.
Add a metric chart to a dashboard
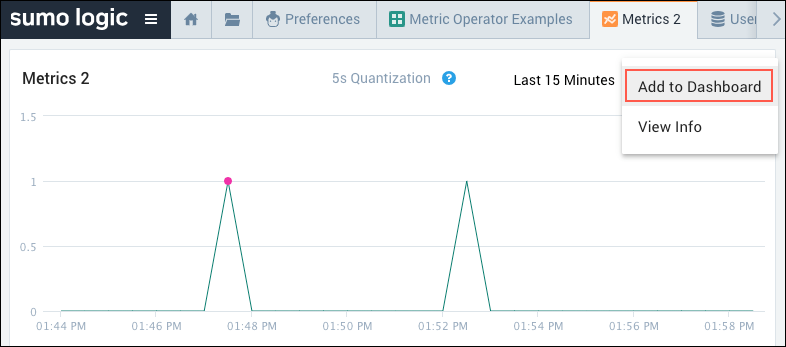
Choose Add to Dashboard from the three-dot menu in the upper right corner of the metric chart
 .
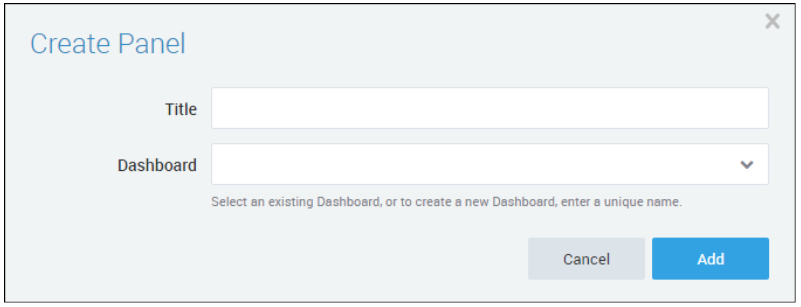
. To add the chart to to an existing dashboard, enter a title for the panel, select the dashboard from the Dashboard pulldown, and click Add.
To create a new dashboard and add the chart to it:
Enter a title for the panel and a name for the new dashboard.
Click the Create New Dashboard link to create the dashboard.

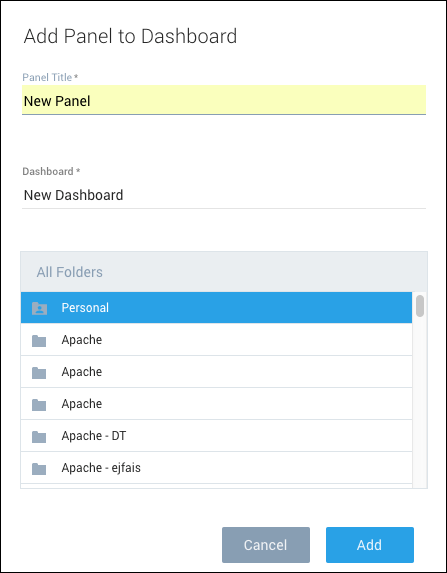
On the Add Panel to Dashboard window, select the folder where you want to save the new dashboard, and click Save.

The dashboard opens to show the new Panel.
Work with Metrics Panels
Do any of the following from a Metrics Panel on a Dashboard.
Click the time entry to select another interval.
Click the Gear or Show in Metrics icon to reopen the Metrics page with the visualization displayed. You can modify settings on the Metrics page, and then add to the Dashboard again. It is not currently possible to replace the existing Panel with the modified settings. After adding the Panel with the updated settings, you can remove the older Panel from the Dashboard. To delete the Dashboard, hover over the Panel in Edit mode and click the X icon in the upper right corner.
Click the Filter icon to use filters (See Use Filters in Dashboards for details):
- (Edit mode only) Add filters for the metrics Panel.
- (Non-Edit mode only) Click the Filter icon to apply a filter to the Metrics data.
Click the Show Panel Information icon to display summary information about the data.
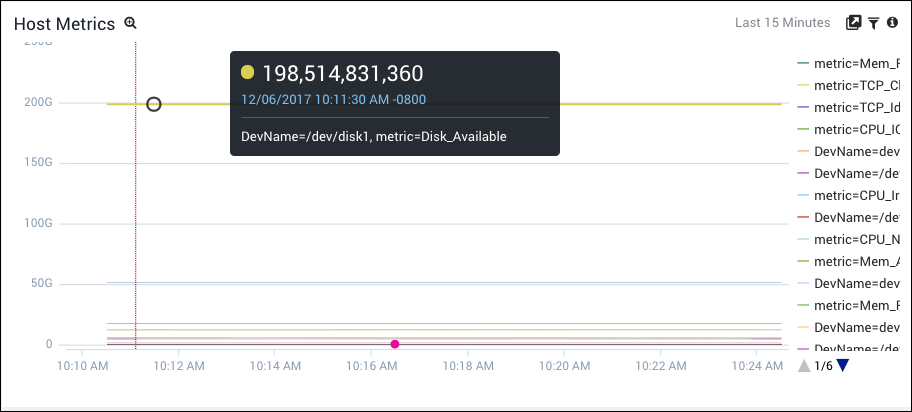
(Non-Edit mode only) Hover over a chart line in the Panel to display details.
