Data Limits for Metrics
This page describes the limits Sumo Logic enforces on the metrics you ingest into Sumo Logic, including data volume limits and metadata-related limits.
note
For information on metrics retention, see Metric Ingestion and Storage.
It is important to understand the volume of metrics that you are ingesting into Sumo Logic.
For billing and reporting purposes, data volume for metrics is measured in Data Points per Minute (DPM). When the DPM limit is exceeded, data is cached on the host and the Source is throttled. To check your current account usage relative to your available DPM limit, see the Account Overview tab of the Account page, at Administration > Account.
The calculation of DPM varies according to the type of metric Source.
The examples in this topic assume a one-minute scan interval, but shorter scan intervals will increase the DPM. For example, collecting at a 10-second scan interval will lead to six times the DPM of a one-minute scan interval.
Limits for host metrics sources
For host metrics, DPM depends on the number of hosts, the number of unique data points, and the scan interval. See Collected Metrics for a list of the specific host metrics that you can collect.
Disk metrics. Approximately 10 metrics are collected for each Source disk on each host.
Total disk metrics for single host = 10 x number of disks
Total disk metrics for multiple hosts = 10 x number of disks per host x number of hosts
Example: A host with 8 disks will generate 80 metrics. If you have 3 hosts, each with 8 disks, 10 x 8 x 3 = 240 individual metrics will be generated.
Network metrics. Network metrics are calculated per interface on each host, and approximately 4 metrics per interface are collected.
Total network metrics for single host = 4 x number of interfaces
Total network metrics for multiple hosts = 4 x number of interfaces per host x number of hosts
Example: A host with 6 network interfaces will generate 24 metrics. If you have 5 identical hosts, 4 x 6 x 5 = 120 metrics will be generated.
CPU, memory, and TCP metrics. Approximately 10 CPU, memory, and TCP metrics are collected for each host.
Total metrics for single host = 10
Total metrics for single host = 10 x number of hosts
Limits for CloudWatch sources
Some Amazon namespaces report metrics every minute, while others report every five minutes. For each metric type, five individual metrics are reported (average, sum, samplecount, maximum, and minimum). The number of reported metric types varies according to namespace (a good general guideline for estimation is 10 per namespace instance).
Total CloudWatch metrics per namespace = 10 x 5
See the AWS documentation for details on the metrics for different namespaces.
Limits for streaming metric sources
Streaming metric sources are custom, as are the number of collected metrics. Customers can specify the reporting interval external to the Sumo Logic configuration. The reporting interval determines when the source sends data to Sumo Logic (which does not poll for the data). Be aware of this when you’re setting up the source.
Limits on number of unique time series
In some cases, Sumo Logic disables a metrics source to limit the number of ingested time series. Sumo disables a metric source that has received too many unique time series. For more information, see Disabled Metric Sources.
Metrics metadata limits
This section describes the limits Sumo Logic enforces on the metadata tags attached to ingested metrics. These limits apply to both metric dimensions and metatags. We use the term dimension to refer to metadata that uniquely identifies what the metric measures. We use the term metatag to refer to additional, but not identifying, information about what the metric measures. Metatags provide context about a metric, and are useful in querying your metrics.
Except where noted, the metadata that Sumo Logic requires or adds to metrics, listed below, do not count towards the limits described below:
metric_rawName_collector_collectorId_contentType_source_sourceCategory_sourceHost_sourceId_sourceName
Total length of metadata per metric
For any single metric, Sumo Logic will accept a total of 4000 characters of metadata, excluding the tags that Sumo Logic requires or adds to the metric. Metrics exceeding this limit will not be ingested.
Number of dimensions and metatags
For any single metric, Sumo Logic will accept a total of 100 dimensions and metatags, excluding the tags that Sumo Logic requires or adds to the metric. Sumo Logic excludes metatags first, and dimensions, as necessary.
Tag name length
The name (key) of a metadata item, whether a dimension or metatag, is limited to 255 characters. Any name exceeding this limit will be removed from the metric.
Tag value length
The value of a metadata item, whether it is a dimension, metatag, or metadata required or added by Sumo Logic, is limited to 400 characters with one exception: the _rawName tag in Graphite metrics is limited to 1000 characters. Metadata whose value exceeds this limit will be removed from the metric. If the removed tag is _rawName (in Graphite metrics) or metric, the whole metric will be ignored.
Audit logging
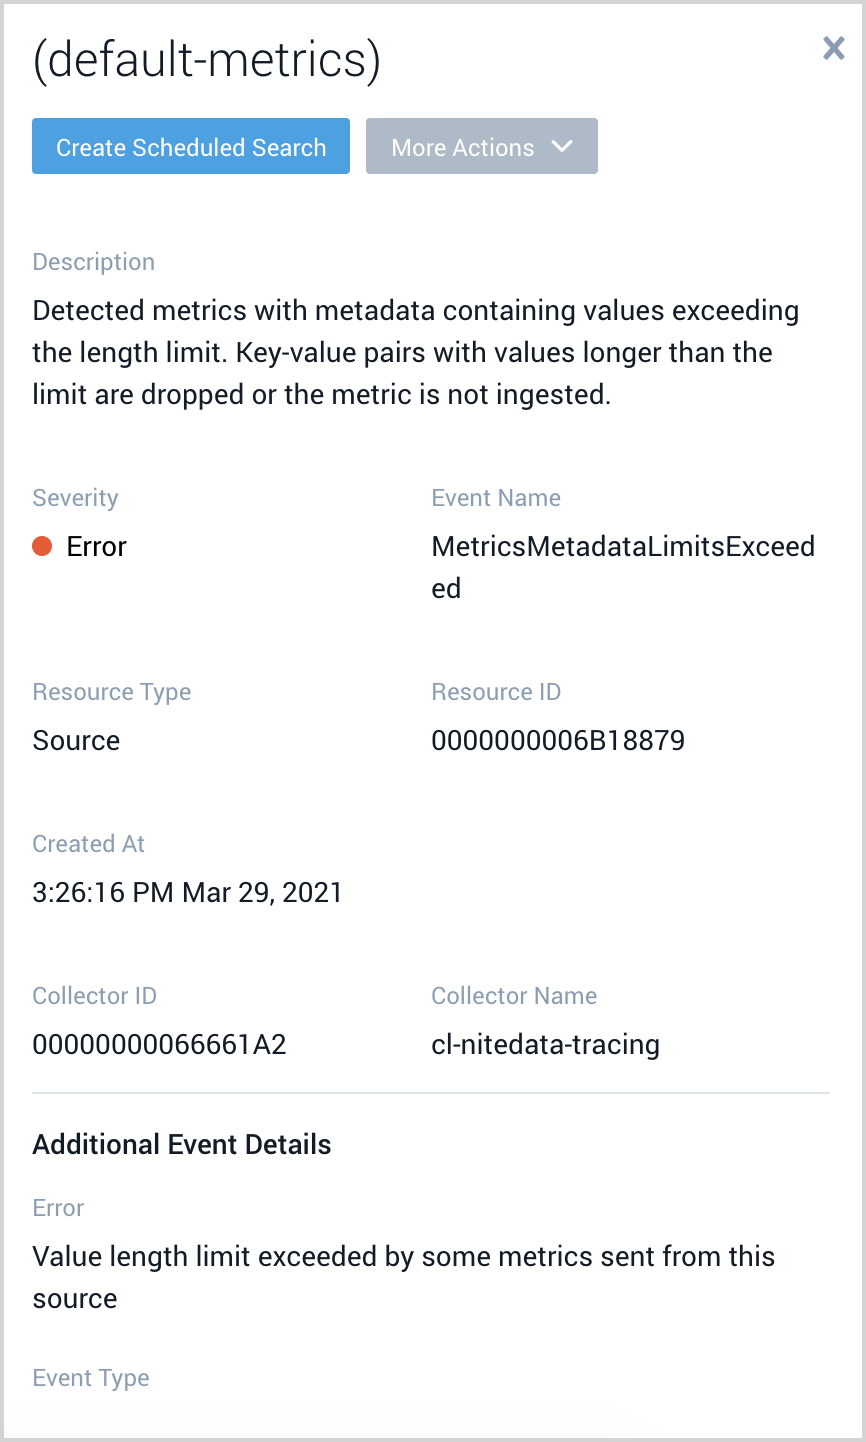
When one of the limits described above is exceeded, Sumo Logic creates a MetricsMetadataLimitsExceeded Health Event for the associated Metric Source and writes an error message to the Audit Event Index.
Here is an example of a Health Event for a Metrics Source that sent offending metrics:

Here is an example of an Audit Event Index message generated when metrics sent to Sumo Logic exceed the metadata value limit.
{"status":"UnHealthy","details":{"trackerId":"MetricsMetadataLimitsExceeded","error":"Value length limit exceeded by some metrics sent from this source","description":"Detected metrics with metadata containing values exceeding the length limit. Key-value pairs with values longer than the limit are dropped or the metric is not ingested."},"eventType":"Health-Change","severityLevel":"Error","accountId":"0000000000000131","eventId":"30e37c7e-f7b3-4cf3-8c41-de34ff4f1991","eventName":"MetricsMetadataLimitsExceeded","eventTime":"2021-03-29T13:26:16.665Z","eventFormatVersion":"1.0 beta","subsystem":"Metrics","resourceIdentity":{"collectorId":"00000000066661A2","collectorName":"cl-nitedata-tracing","id":"0000000006B18879","name":"(default-metrics)","type":"Source"}}