Use Log Overlay to Analyze Metrics Visualizations
note
This topic has information about Sumo Logic's Classic metrics UI. For information about the Metric Explorer UI, which replaces the Classic metrics UI, see Metrics Explorer.
Metrics visualizations give you a clear picture of what is happening in your environment. By adding log overlays to your metrics visualizations, you can investigate why behavior is occurring and what corrective action might be called for. Log overlays help you correlate the performance shown in your metrics visualizations with logged events that could be responsible for changes in behavior.
For example, if your metrics visualization shows booking failures and successes for your online travel site and you notice a sudden increase in failed bookings, you can add a log overlay query on *error* to the visualization to identify and investigate the error messages associated with the spike.
How log overlay works
To open the Metrics page, click + New in the tab bar and select Metrics.
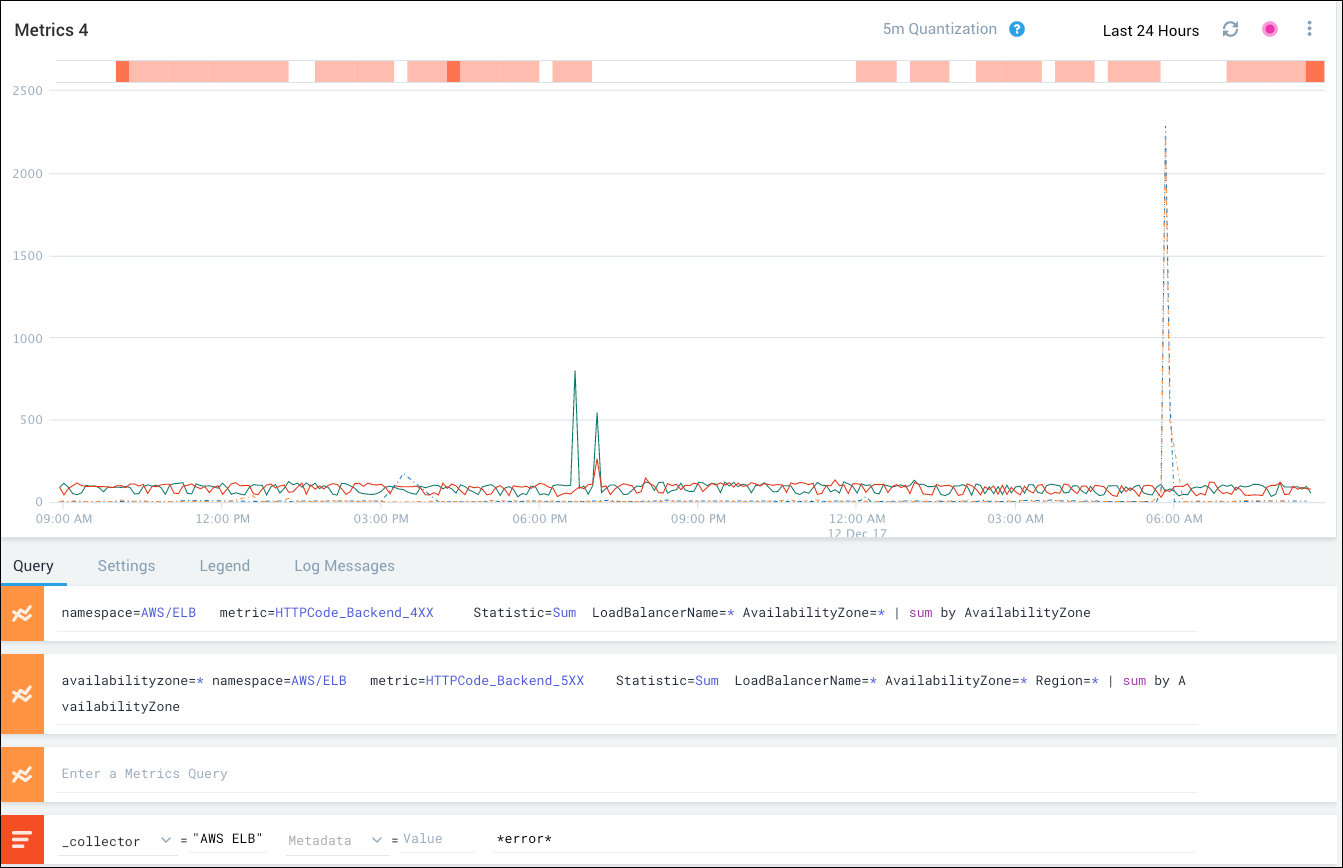
The Query tab includes a log overlay query area below the metrics query area.

Specify a log query, which must include one or more selectors (filters). Selectors can be either of the following:
- Sequence of space-separated tag=value pairs. Example:
_sourceCategory=*/travel/checkout - Unqualified strings (value with no key). Example:
*error*
The visualization is refreshed to show an orange log overlay bar at the top of the chart area.

The log overlay bar consists of individual vertical bands that represent log messages for message intervals. The relative number of messages is represented by the intensity of the orange color (deeper orange = more messages).
Because the intervals for metrics collection might not correspond exactly to the intervals for log collection, the vertical bars might be offset slightly from the associated metrics in the visualization.
For additional information about the log messages in the log overlay bar:
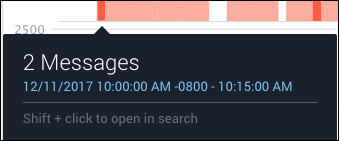
Hover over a band in the bar to see the associated message count and interval.

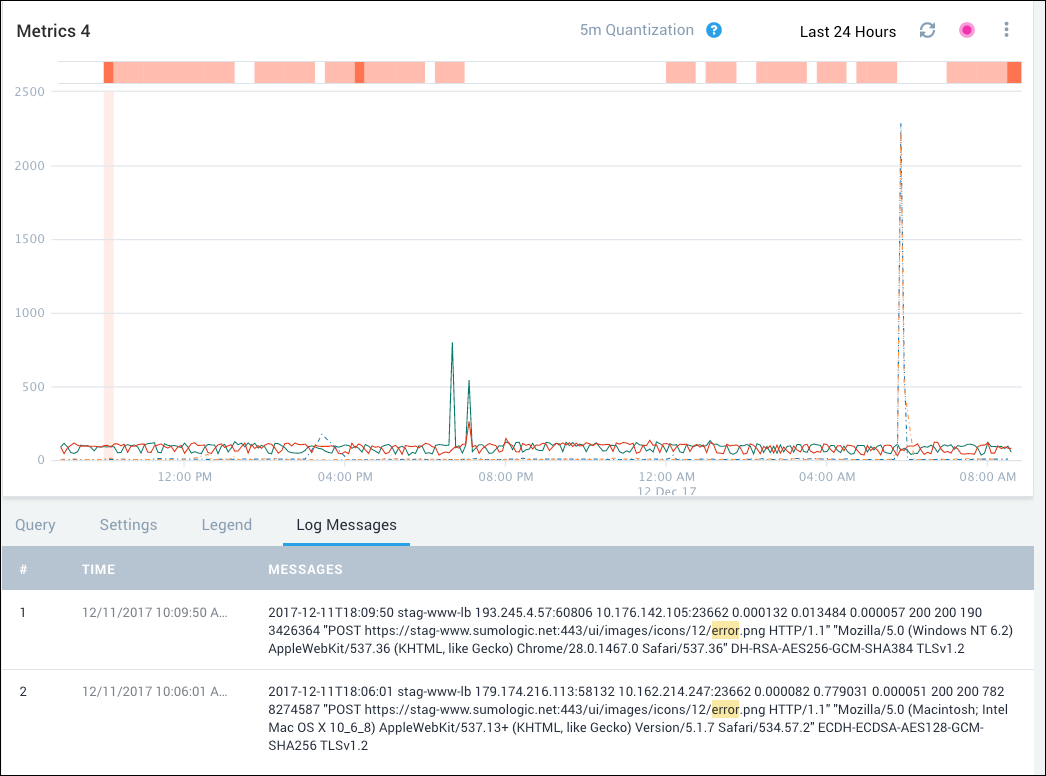
Click a band in the bar to open the Log Messages tab and display the messages associated with the log query.

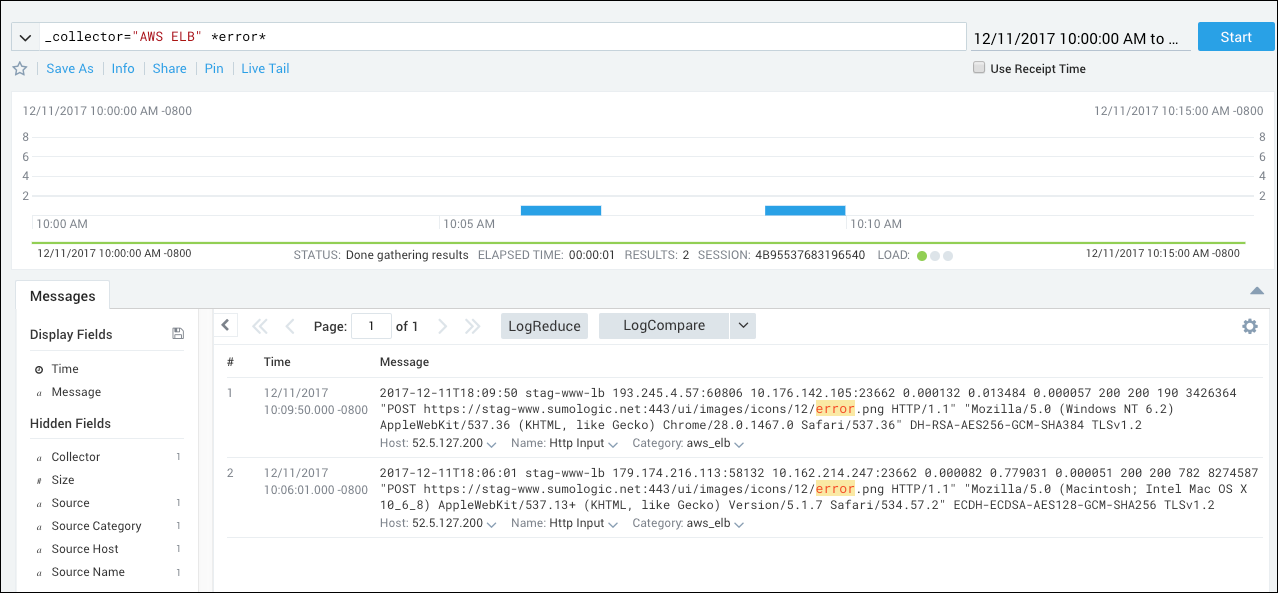
Press Shift and click to open the Search page with the log query and interval populated and the search results shown. You can troubleshoot the problem as you would for any search results. To return to the metrics visualization, press the Back button on your browser.
